

Why fresh volatility means a ‘valuation opportunity’ is opening up in U.S. stocks
A Few Stocks Carry the S&P 500: 41% of Stocks Trade 30% Below Highs
Darryn Pollock
The S&P 500 is within 0.2% of its record, yet 41% of S&P 500 stocks sit over 30% below highs. It is quite clear, there are just a few names are carrying the whole market.
Some 84% of index members trade at least 10% below all-time highs, and 17% are down more than 50%. However, the index weights companies by market value, so the largest stocks dominate its moves.
Which S&P 500 Stocks Are Missing the Rally?
Real Estate leads, with 97% of its stocks at least 10% below all-time highs, The Kobeissi Letter said.
Materials follow at 96%, Utilities at 94% and Consumer Discretionary at 92%.
In contrast, Energy has held up better at 62%, followed by Healthcare at 70% and Information Technology at 72%.
Meanwhile, real estate stocks hit a record low against the S&P 500 last week.

Longer-dated Treasury yields hit 24-year highs on October 7. Higher yields can weigh on rate-sensitive sectors such as real estate and utilities.
How Long Can a Few Names Hold Up the Index?
The index closed above 7,800 for the first time on October 6, CNBC reported. In addition, Nvidia, Apple and Microsoft make up roughly a fifth of the S&P 500.
Kevin Gordon, Schwab’s head of macro research and strategy, says artificial intelligence (AI) stocks now hold the index up. However, the average member fell 14% peak to trough since early August, he noted.
Goldman Sachs’ ex-AI index excludes stocks the bank classes as AI enablers. It gained 6.7% in the six months to October 6, against 18.3% for the S&P 500.
Gordon said a single mega-cap capex miss, a shortfall in AI spending, paired with pared-back budgets could disrupt earnings.
With 17% of members already down more than 50%, the index may lack a broad base if AI spending falters. Third-quarter reports from the largest AI spenders may show whether that base holds.
FACTORS THAT AFFECT OPTIONS PRICES.
(WHY SHOULD YOU CARE?)
- Asset Price
- The higher the asset price the higher the stock price.
- Because of the higher cost to purchase stock, options become more attractive to investors who want to participate in the stock gains, or losses when they can’t afford to purchase the stock.
- The higher the asset price the higher the stock price.
- Strike Price
- The difference between the current stock price and an options strike price is called Moneyness.
- When the strike price is Out Of The Money (OTM) 100% of the options price is Time Value (Extrinsic Value).
- When the strike price is In The Money (ITM) the options price will be made up of some % of Time Value, and some % of Exercise Value (Intrinsic Value).
- The difference between the current stock price and an options strike price is called Moneyness.
- Time to Expiration (A Very Important Factor)
- The greater the time to expiration, the greater the cost of the option.
- Shorter-term options cost less and time decays faster.
- Longer-term options cost more and time decays slower.
- The greater the time to expiration, the greater the cost of the option.
- Implied (Expected) Volatility
- A stock that is expected to have higher volatility (Bigger Price Swings), the higher the cost of the option due to a greater risk to the option seller that the stock will finish ITM.
- Risk Free Interest Rate
- Investments in vehicles that offer a Risk Free Return are competitive to options prices.
- Options must offer a return potential that is better than the current risk free rate.
- Investments in vehicles that offer a Risk Free Return are competitive to options prices.
- Dividends
- Dividends cause the stock price to drop by the dividend amount on the x-date.
- This hurts Call options, so options prices tend to factor in a lower price due to the dividend before the x-date.
- This helps Put options, so options prices tend to factor in a higher price due to the dividend before the x-date.
- Dividends cause the stock price to drop by the dividend amount on the x-date.
Earnings –
10/13/26: GS, UNH, JPM, WFC, C, JNJ
10/14/26: MS, ASML, BAC
10/15/26: SCHW
10/19/26: ZION, GE
10/20/26: GM, NOC, PM, CB, RTX, NFLX, TSLA, KEY
10/21/26: LRCX, TMO, MCO, CMA, TXN
10/22/26: LMT, TSCO, UNP, PG, HSY, MA
10/23/26: XOM, AXP
10/26/26: VZ
10/27/26: GOOGL, KO, SBUX, SPGI, BA
10/28/26: GEV, VRT, TMUS, F, META, ORLY, MSFT, ROKU,
10/29/26: MRK, SNDK, AMZN, H, ICE, TWLO, INTC, LLY
10/30/26: CVX, AZN
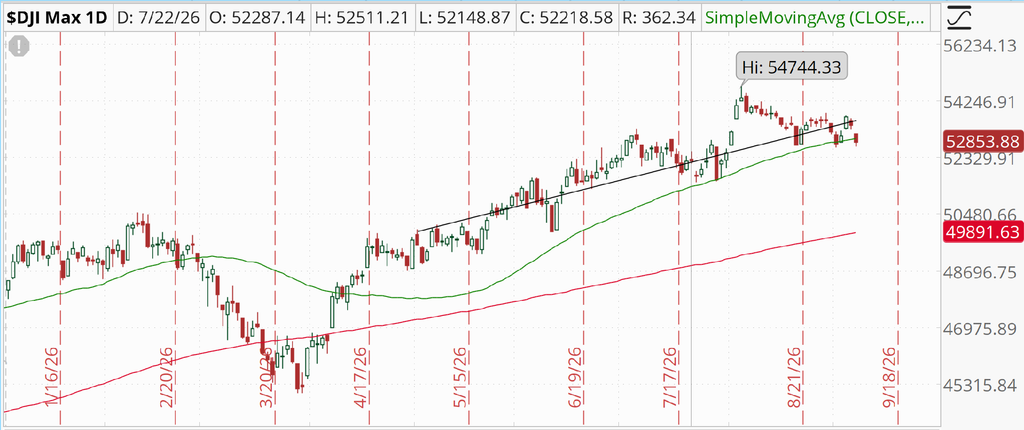
DJIA – Flat to Bearish
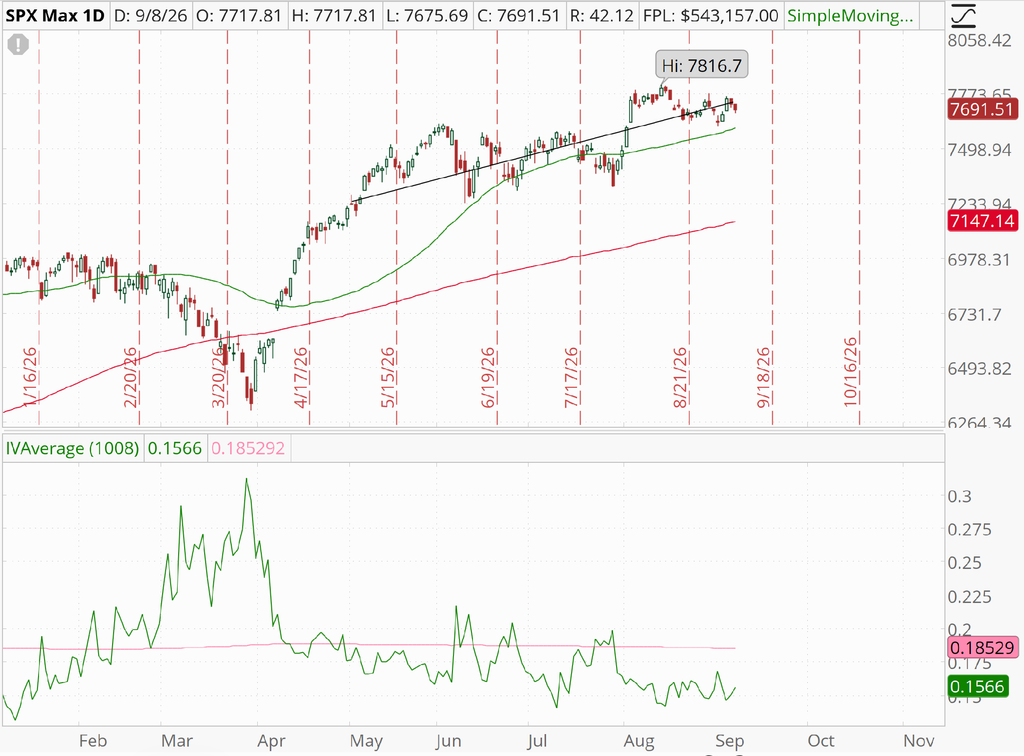
SPX – Flat to Bearish
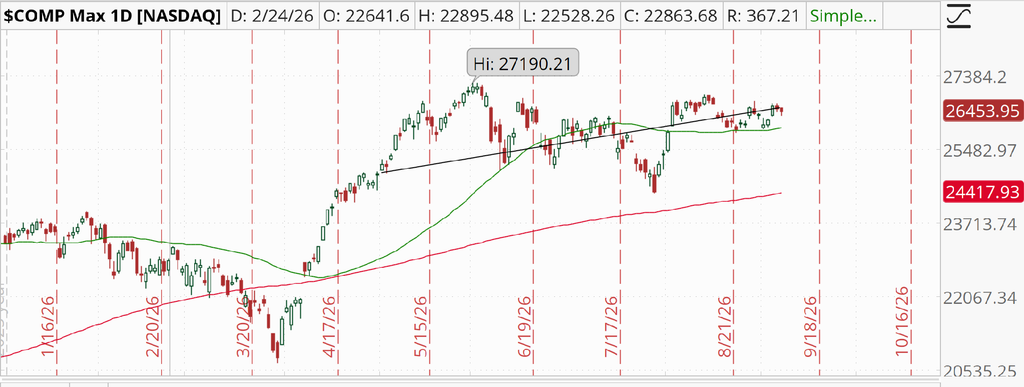
COMP – Flat to Bearish
Where Will the SPX end September 2026?
Flat to Bearish
09-04-2026 +0.27%
Earnings:
Mon:
Tues: GS, UNH, JPM, WFC, C, JNJ
Wed: MS, ASML, BAC
Thur: SCHW
Fri: KR, RENT, HOFT
Econ Reports:
Mon:
Tue: NFIB Small Business Optimism Index
Wed: MBA, Quarterly Services Survey
Thur: Jobless Claims, PPI Final Demand, Existing Home Sales, EIA Natural Gas Report, EIA Petroleum Status, Fed Balance Sheet
Fri: CPI, Consumer Sentiment
How am I looking to trade?
Looking for Opportunities both Bull & Bear
www.myhurleyinvestment.com = Blogsite
info@hurleyinvestments.com = Email
Questions???
