

Why fresh volatility means a ‘valuation opportunity’ is opening up in U.S. stocks
As the Market Crashed in 1987, Paul Tudor Jones Made $100 Million in a Single Day: ‘The Most Important Rule of Trading Is to Play Great Defense, Not Great Offense’
https://finance.yahoo.com/markets/stocks/articles/market-crashed-1987-paul-tudor-173002488.html
It doesn’t take a genius to make money in a bull market. But if you want to come out on top during a crash, you’ve really got to know your stuff. That’s what separates casual investors and newbies from the Wall Street legends.
Think about it: Michael Burry won betting against the housing bubble before the global meltdown of 2008. Warren Buffet built his huge fortune buying when everybody else was selling. Then, there’s hedge fund billionaire Paul Tudor Jones.
He might not be a household name, but Jones offers a textbook lesson in how a wise investor profits off market panic. On October 19, 1987, the Dow Jones Industrial Average suffered its biggest single-day drop in history. It was so bad that anybody who can still remember that day calls it “Black Monday.”
Billions of dollars worth of wealth evaporated into thin air, and some traders lost everything over the course of just a few hours. But after the dust all settled, it turned out Paul Tudor Jones hadn’t lost a dime. In fact, he’d made $100 million in a single day by betting against the collapsing market.
How’d he do it? Years of disciplined risk management.
“The most important rule of trading is to play great defense,” Jones has always argued. “Not great offense.”
Almost 40 years later, that piece of advice has never been more relevant. We’re wrestling with out-of-control inflation, sluggish growth, geopolitical turmoil, and everything in between. So, what does “great defense” actually look like?
Why Defense Always Beats Offense
To contextualize just how big this win was, let’s set the scene. The stock market had been enjoying a huge rally up until the autumn of 1987. Valuations had ballooned, investor optimism was high, and everybody thought the bull market was just going to keep on running.
Everybody, that is, but Paul Tudor Jones.
Jones started diving deeper into historical market comparisons with market strategist Peter Borish, and the pair noticed disturbing similarities between the stock market crash of 1929 and the price movements that had been happening throughout the late 1980s.
Jones didn’t think it was a coincidence, and so he started to build bearish positions before the crash. By the time Black Monday rolled around, the value of his positions exploded. His hedge fund, the Tudor Investment Corporation, allegedly tripled in size over the course of a single trading session.
At first glance, it looks like the secret to Jones’ success is all about data and market predictions. But Jones has always seen things differently.
His philosophy is built around the assumption that most traders (even himself) get it wrong a lot of the time. That’s why his moves center more on controlling losses than they do on maximizing gains. In other words, capital has always got to come first, and profits are always second.
Jones often warns traders against averaging down on losing positions just because the prices look appetizing. He doesn’t get emotionally attached to past decisions and regularly reassesses whether the original thesis of his positions still holds true.
“Every day I assume every position I have is wrong,” he says.
“I know where my stop risk points are going to be. I do that so I can define my maximum possible drawdown. Hopefully, I spend the rest of the day enjoying positions that are going in my direction. If they are going against me, then I have a game plan for getting out.”
It might sound like a conservative approach, but it’s clearly the best way to avoid spectacular losses. That’s how he won big on Black Monday when everybody else went broke. And with all the market turmoil we’ve seen in recent months, this is an approach we could all learn from.
Why Risk Management Can Give You An Edge
This might sound like an ancient lesson in Wall Street history. After all, the tech has changed. Markets trade a lot faster than they used to, and AI can execute automated transactions in milliseconds. But the psychology behind Paul Tudor Jones and his $100 million win hasn’t changed at all.
Speculative bubbles are driven by greed, and panic selling is driven by fear.
When investors get overconfident, they try to talk themselves into believing history won’t repeat itself. But it always does. Every time the market corrects, investors make the same old mistakes. They spend too much time and too much money on fashionable sectors, ignore diversification, and treat every dip like a buying opportunity.
Sound familiar yet?
Unfortunately, the truth is that sometimes those dips are a catastrophe waiting to happen. Jones’ approach is all about ensuring you’ve still got a strong financial footing when those catastrophes do sneak up on you.
That doesn’t mean you’ve got to refuse to take risks or hide in cash. But you do have to understand how much risk you’re actually taking on, and that starts with diversification. It means paying close attention to position sizing and accepting that selling isn’t a failure. It preserves your capital and gives you flexibility for when something better comes along.
At the end of the day, Paul Tudor Jones didn’t become one of the hedge fund greats because he predicted a colossal crash one time. He became a legend by recognizing that markets are inherently uncertain. He’s spent decades sculpting his investment strategy around that hard truth, and that’s what he means by “playing great defense.”
It’s all well and good finding the next stock that doubles or triples. But Jones shows us that long-term success isn’t about making the boldest or sexiest trades. It’s about doing what you’ve got to do to protect your capital when everybody else is losing theirs.
Nvidia to Team With Wall Street on $500 Billion Funding Package
Intel to Sell $15 Billion in Stock After AI Boosts Demand
SEC Exempts Data-Center Bonds From Key Securitization Rules
Earnings –
BABA 8/28 est
BIDU 8/19 est
COST 9/24 AMC
MRVL 8/27 est
MU 9/23 est
NKE 9/29 est
NVDA 8/26 AMC
WMT 8/20 BMO
https://www.briefing.com/the-big-picture
Record highs, lower valuations
Briefing.com Summary:
*Record highs don’t necessarily mean higher valuations; earnings growth has outpaced price appreciation, compressing forward P/E multiples.
*Rising earnings estimates have been the market’s primary support, reinforcing investor confidence despite macro uncertainty.
*Broadening earnings strength has fueled broader market participation, lifting small-cap stocks and the equal-weighted S&P 500.
You might have heard that a lot of things are costing more these days. The stock market isn’t one of those things.
Some might find that hard to believe given that the stock market has risen to new record highs. The price level, though, isn’t the determinant for value; earnings are.
The stock market can go up in price but down in its valuation if earnings are rising faster than prices. And that is exactly what has happened. Both the market cap-weighted S&P 500 and the equal-weighted S&P 500 are less expensive today than when the year began.

Following the Estimates
On a year-to-date basis, the market cap-weighted S&P 500 is up 13.3%. The forward 12-month EPS estimate is up 24.5% to $383.98. That translates into a forward 12-month P/E multiple of 20.1x compared to 22.2x at the start of the year. That is a slight premium to the 10-year average of 19.0x.
The market isn’t cheap by historical standards, but it is cheaper than it was at the start of the year. That helps explain why investors have remained willing buyers despite record highs. As long as earnings estimates continue to trend higher and interest rates don’t disrupt the picture, that support should remain intact.

The steady climb in forward earnings estimates has been the market’s quiet story all year. While headlines have focused on tariffs, inflation, Fed policy, and geopolitical risks, the market has consistently looked through those concerns because none has materially altered the market’s confidence in the earnings outlook.
Market sentiment has gotten rattled at times, but the enduring earnings strength has been the stabilizing factor.

The earnings picture has also broadened, helping to broaden the market’s leadership. Buying interest is no longer confined to the mega-cap stocks, reflecting the fact that earnings strength is no longer confined to them. In fact, the small-cap stocks have handily outperformed the mega-cap stocks, evidenced by the 22.3% year-to-date gain for the Russell 2000 versus the 9.9% gain for the Vanguard Morningstar Mega-Cap ETF (MGK).
In turn, the equal-weighted S&P 500 has outperformed the market cap-weighted S&P 500, gaining 14.9% year-to-date. Its forward 12-month P/E multiple has slipped to 16.4x, versus 16.7x when the year began, with the forward 12-month EPS estimate increasing 16.7% to $541.60, according to FactSet.
Briefing.com Analyst Insight
Investors often equate record highs with overvaluation, but those aren’t synonymous. Record prices accompanied by record earnings are a much different proposition than record prices driven solely by expanding valuations.
Today’s market still carries risks, but the earnings backdrop suggests those risks are being balanced by stronger fundamentals. In that sense, the market’s message has been remarkably consistent all year: prices are higher, but valuations are lower.
—Patrick J. O’Hare, Briefing.com
This stock market indicator just flashed a warning not seen since the dot-com bubble
The analysis
The S&P 500 (^GSPC) has hit its second-most expensive valuation in history, as measured by the Shiller P/E Ratio, better known as the CAPE ratio.
This valuation metric measures the price of a stock index relative to its average inflation-adjusted earnings over the previous 10 years.
As it stands today, the CAPE ratio far surpasses the Crash of 1929 and is only slightly behind the levels seen during the dot-com bubble. The CAPE ratio peaked at about 44.19 in November 1999, at the height of the internet bubble, then went on to plunge to 21 by January 2003.
The S&P 500, pushing to a fresh record this month, has sent its dividend yield to the lowest level in history at 1.04%, per Yahoo Finance AlphaSpace analysis.
The dividend yield on the S&P 500 measures the total annual dividend income generated by the companies in the S&P 500 index relative to the index’s combined market value.
The bottom line
A market could stay “overvalued” for a while. And as you sit there and wonder if the market is overvalued and poised to crash, you will likely miss out on more upside.
Stay invested. Let the pundits try to pick market tops and bottoms.
CAPE is not the best measure of value! For example: GAAP accounting rules Change periodically making comparisons to old data meaningless.
Changes in the balance of tech heavy, high-margin, light-asset stocks in the indexes make comparisons meaningless.
CAPE flashed overbought in 1997. Three years later the dot-com bubble burst. The timing is not relevant.
CAPE ignores macro environment including interest rates. People are willing to pay higher PE ratios when interest rates are not an attractive investment. You have to consider alternative markets.
Higher
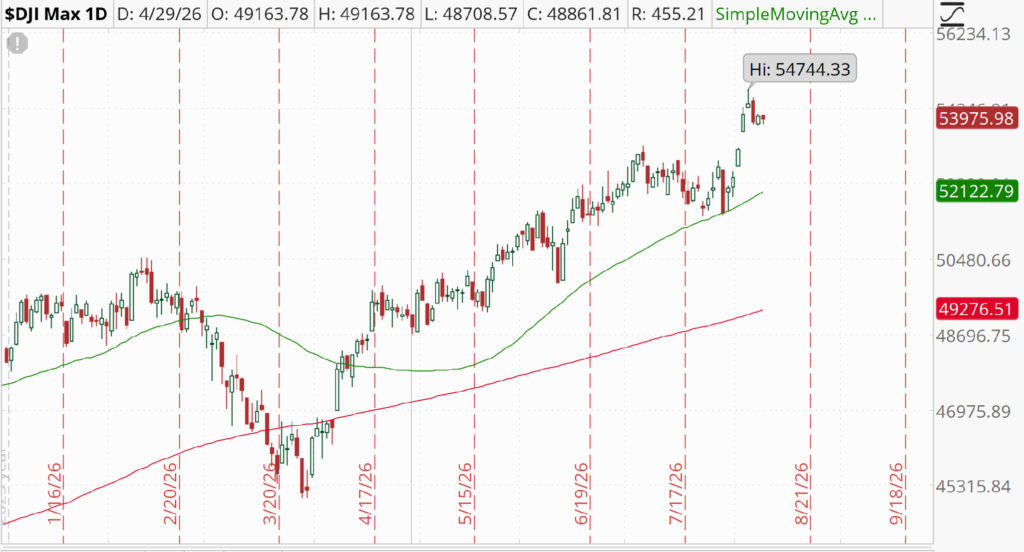
DJIA – Bullish
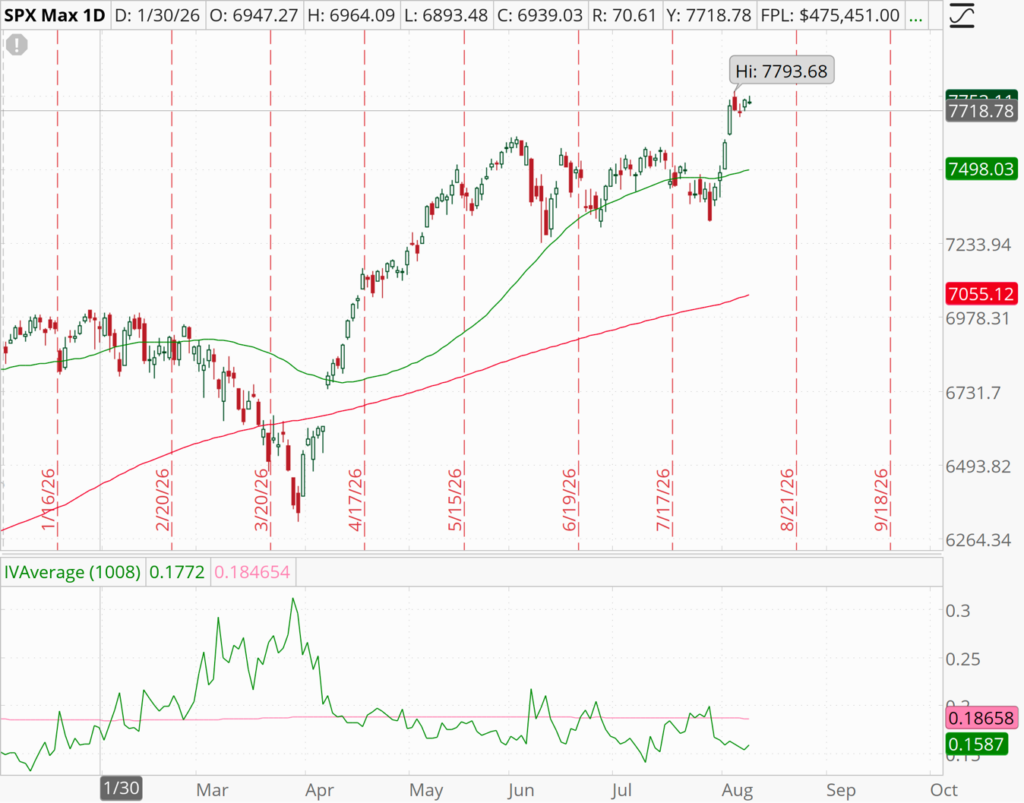
SPX – Bullish
COMP – Bullish
Where Will the SPX end August 2026?
Higher
08-03-2026 +1.50%
08-07-2026 +3.37%
Earnings:
Mon: B, SPG, RKLB
Tues: SMCI, VG, QNT
Wed: CSCO, COHR, PAAS
Thur:AMAT, BN, NU, JD, KB, BAP, PS
Fri: RLX, SGML, NB
Econ Reports:
Mon: Beth Hammack Speaks
Tue: NFIB Small Business Optimism, Existing Home Sales
Wed: MBA, CPI, EIA Petroleum Status
Thur: Beth Hammack Speaks, Jobless Claims, PPI Final Demand, Thomas Barkin Speaks, EIA Natural Gas Report, Fed Balance Sheet
Fri: Retail Sales, Business Inventories, Consumer Sentiment
Cleveland Fed’s Hammack: It will take more than one interest rate hike to bring down inflation
How am I looking to trade?
I’m bullish for the rest of August, but looking to add protection at a low cost before September begins.
www.myhurleyinvestment.com = Blogsite
info@hurleyinvestments.com = Email
Questions???
