Hi Kevin
Is my account safe? Please read this article. Thanks
This question came from this article
Several Big Brokerages Leave Customer Accounts Open to Theft, Senators Say
Senators Ron Wyden and Elizabeth Warren, ranking Democrats on the Finance and Banking Committees, have urged regulators to require brokerages to provide stronger customer protections.
MY Response:
Since the Apex feed was hacked MoneyBlock has been beefing up the security. We now have the two-step authentication and they track IP address data sign in from computers. They are as safe as everyone else and continue to monitor how others are being hacked to prevent it. I’m convinced that they take care of protecting our accounts and I have all of my funds sitting with them right now.
In God we Trust, Guns are just backup.
Patterns and context
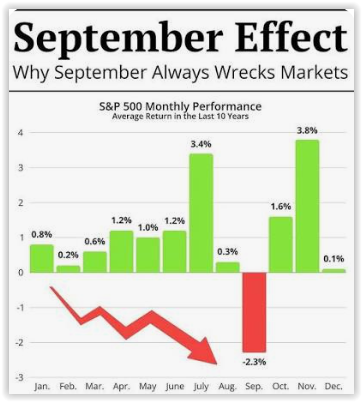
- September effect: Multiple September months since 2000 have been negative, often linked to the “September effect” — a historical tendency for stocks to underperform in that month www.simianx.ai.
- Post-crash weakness: After major crashes (2000–2002, 2008, 2020), September and May often saw steep declines.
- COVID crash: May 2020 was the single worst month in this period, with a −34% drop quantflowlab.com.
- May weakness: May has been a recurring weak month, especially during downturns.
Key takeaway: While seasonality is not a guarantee, historical data shows that September and May have been the most consistent “worst” months since 2000, with November and February also standing out in specific years. The COVID crash in May 2020 remains the single most severe monthly drop in this timeframe.
https://www.simianx.ai/stories/sp-500-seasonality-best-worst-months-1950-2026
How the Stock Market’s Calendar Really Works: 76 Years of Monthly Data
Every year, traders ask the same two questions: what are the best months for the stock market, and which months should they fear? S&P 500 seasonality — the tendency of the index to perform differently in different calendar months — is one of the oldest and most studied patterns in finance. This reference compiles the approximate average monthly returns of the S&P 500 from 1950 through 2025, explains the famous anomalies behind them — the September effect, “Sell in May and go away,” the Santa Claus rally, and the presidential cycle — and shows what the data implies for the rest of 2026, a midterm election year that historically sits in the weakest seat of the four-year cycle.
One warning before the tables: seasonality describes averages across 76 years, not guarantees about any single year. Treat it as context that tilts probabilities, never as a standalone signal. We will come back to how systematic traders actually combine it with live data at the end.
The Complete Monthly Seasonality Table (1950–2025)
The table below summarizes the approximate average price return and the share of positive months for the S&P 500 in each calendar month since 1950. Figures are rounded and compiled from monthly closing data; small differences between data vendors are normal.
| Month | Avg. return | % of years positive | Rank | Seasonal note |
|---|---|---|---|---|
| January | +1.0% | 59% | 6 | “January effect” + new-year inflows |
| February | −0.1% | 54% | 10 | Mid-quarter lull |
| March | +1.1% | 64% | 5 | Quarter-end rebalancing |
| April | +1.5% | 71% | 1–2 | Strongest spring month |
| May | +0.3% | 59% | 8 | Start of the “weak half” |
| June | +0.1% | 54% | 9 | Often flat, low conviction |
| July | +1.2% | 59% | 4 | Best summer month |
| August | −0.1% | 55% | 11 | Thin liquidity, vacation tape |
| September | −0.7% | 44% | 12 | The September effect — worst month |
| October | +0.9% | 61% | 7 | Volatile but a “bear killer” |
| November | +1.5% | 68% | 1–2 | Start of the strongest stretch |
| December | +1.4% | 74% | 3 | Highest hit rate of any month |
Bar chart of average S&P 500 returns by calendar month from 1950 to 2025, with September the only deeply negative month
Three facts jump out of seven decades of data:
- November, April and December are the elite months. They combine high average returns (+1.4% to +1.5%) with high hit rates (68–74% positive). The November–April window contains five of the six strongest months.
- September is the only month that is reliably bad. It is the sole month with a deeply negative average (−0.7%) and a sub-50% hit rate. Every other “weak” month (February, June, August) is closer to a coin flip around zero.
- The summer is not a disaster — it is a dead zone. May, June and August average roughly zero. The problem with the weak half of the year is not large losses on average; it is that you historically collected very little reward for the risk you carried.
The September Effect: Why the Worst Month Keeps Underperforming
The September effect is the most persistent calendar anomaly in US equities. Since 1950, September is the worst month for the S&P 500, the Dow and the Nasdaq alike, and the pattern has been documented in markets outside the US as well.
Why does it persist when most known anomalies get arbitraged away? Researchers offer overlapping explanations rather than one clean answer:
- Mutual fund fiscal year-ends. Many US funds close their fiscal year on October 31 and harvest losses in September, creating mechanical selling pressure.
- Post-vacation repositioning. Institutional desks return from August holidays and execute deferred risk reductions at the same time.
- Bond issuance calendar. September is historically a heavy month for new debt supply, pulling liquidity from equities.
- Self-fulfilling caution. Enough market participants now expect a weak September that they de-risk in advance, front-loading the weakness.
Whatever the mix of causes, the practical takeaway is modest: September is a poor month to add leverage and a historically rewarding month to hold hedges — not a reason to liquidate a portfolio. If you want to watch the conditions that actually turn a seasonal dip into a real drawdown, the breadth, revision and credit-spread signals tracked in our Wall Street drawdown watch matter far more than the calendar.
“Sell in May and Go Away”: What 76 Years of Data Actually Show
The most famous seasonal rule of all splits the year into two halves: the “strong half” from November through April and the “weak half” from May through October. The slogan predates the modern S&P 500 — it originated with London brokers leaving for the summer — but the data behind it is real.
Since 1950, the S&P 500 has averaged roughly +6.8% in November–April versus roughly +1.7% in May–October. Compounded over 76 years, that gap becomes absurd: $10,000 invested only during the winter halves grows to well over $1 million, while the same $10,000 invested only during the summer halves grows to roughly $36,000.
Log-scale line chart comparing $10,000 compounded only in November–April versus only in May–October from 1950 to 2026
So should you actually sell in May? For most investors, no — and the reasons are worth spelling out:
- Both halves are positive on average. Exiting May–October historically reduced total returns versus simply staying invested; it just improved risk-adjusted returns.
- Taxes and costs eat the edge. Realizing gains every May converts long-term compounding into short-term tax events. After friction, the naive version of the strategy loses to buy-and-hold in most studies, including the long-run evidence summarized by Investopedia.
- The dispersion is enormous. May–October 2020 gained over 20%. May–October 2008 lost roughly 30%. The average hides everything that matters in any given year.
The sophisticated reading of “Sell in May” is not exit in May; it is expect less from the summer tape and size accordingly. That is also how it interacts with the bear-market evidence: as our reference on every S&P 500 bear market since 1929 shows, the deepest damage in history has clustered in the May–October window — including 1987, 2002 and 2008.
October: The Crash Month That Is Secretly a Bear Killer
October owns the scariest reputation on the calendar because the 1929, 1987 and 2008 crashes all detonated in it, and October’s realized volatility is the highest of any month. Yet its average return since 1950 is positive (+0.9%), and it carries a nickname professionals use more often than “crash month”: the bear killer. A remarkable number of post-war bear markets — including 1957, 1960, 1962, 1966, 1974, 1990, 1998, 2002 and 2011 — made their final lows in October.
The lesson is that October is a month of resolution, not of reliable direction. Volatility clusters there, and historically that volatility has marked endings more often than beginnings. Panic-selling an October air pocket has been one of the most expensive habits in market history.
The Santa Claus Rally, the January Effect, and the Turn of the Month
Three smaller anomalies round out the seasonal map:
- Santa Claus rally. The last five trading days of December plus the first two of January have averaged roughly +1.3% since 1950, positive in close to four out of five years. Its inventor, Yale Hirsch of the Stock Trader’s Almanac, attached the famous warning: “If Santa Claus should fail to call, bears may come to Broad and Wall” — a missed rally has often preceded weak Januaries.
- The January effect. Small-cap stocks historically outperformed large caps in January as tax-loss selling reversed. This is the clearest case of an anomaly fading after publication: since the 1990s the edge has shrunk dramatically as investors front-ran it.
- Turn-of-the-month effect. A disproportionate share of all equity returns accrues in the window from the last trading day of a month through the first three or four of the next, driven by salary flows, 401(k) contributions and systematic rebalancing.
The January-effect story is the essential cautionary tale for this whole topic: calendar edges are weak, public, and capable of decaying. Anyone trading them mechanically without confirming data is volunteering to be the liquidity for those who do confirm.
The Presidential Cycle: Why 2026 Sits in the Weak Seat
Beyond the monthly map, the four-year presidential election cycle is the strongest medium-term seasonal pattern in US equities — and 2026 is a midterm year, historically the weakest of the four.
Bar chart of average S&P 500 annual returns by presidential cycle year since 1950, with midterm years like 2026 the weakest
Since 1950, the approximate average S&P 500 return by cycle year:
| Cycle year | Average return | Character |
|---|---|---|
| Year 1 — post-election (2025) | +7.0% | New-administration agenda priced in |
| Year 2 — midterm (2026) | +4.5% | Weakest year; largest average drawdown |
| Year 3 — pre-election (2027) | +16.8% | Strongest year by a wide margin |
| Year 4 — election (2028) | +7.3% | Positive but choppy into the vote |
Midterm years carry two signature features. First, the largest average intra-year drawdown of the cycle — roughly 17% on average — typically bottoming in the August–October window as election uncertainty peaks. Second, an unusually reliable resolution: the S&P 500 has been higher 12 months after every midterm election since 1950, with double-digit average gains, as policy uncertainty clears regardless of which party wins.
For 2026 specifically, the historical script says: respect the possibility of a rough late summer and early autumn, and treat any September–October midterm-year weakness as historically fertile ground rather than a reason to capitulate. That script interacts with the live macro picture — Fed policy expectations in particular — which we track in real time in our 2026 Fed rate-cut pricing map. And if the S&P’s longer-term path toward new highs is your focus, the momentum and liquidity framework in S&P 500 to 7000 is the companion read.
Does Seasonality Exist in Crypto Too?
Calendar patterns are not unique to equities. Bitcoin has its own well-documented rhythms — historically strong Octobers (“Uptober”), weak Septembers, and the four-year halving cycle that dominates everything else. The mechanics differ (halvings and liquidity cycles rather than fiscal year-ends), but the analytical rule is identical: averages tilt probabilities, single years routinely defy them. Our reference on Bitcoin’s halving cycles and the data on how BTC trades after Fed rate cuts cover the crypto side of the seasonal map in depth.
How Traders Actually Use Seasonality (and How They Shouldn’t)
Used badly, seasonality is astrology with a spreadsheet. Used well, it is a prior — a base rate you update with live evidence. Three practical rules separate the two:
- Never trade the calendar alone. A weak-September prior plus deteriorating breadth, widening credit spreads and falling earnings revisions is a real signal. A weak-September prior by itself is trivia. The multi-agent systems on the SimianX AI leaderboard are explicitly built around this idea: thirty AI models from six providers analyze live market data, news and technicals — and their real profit-and-loss is published, so you can see which models actually convert context like seasonality into returns. Our breakdown of which AI model is the best trader summarizes the standings.
- Use seasonality for sizing and timing, not direction. The historical edge of November–April is an argument for carrying fuller risk in the strong half and tighter risk in the weak half — not for binary in/out switches that incur taxes and miss outlier summers.
- Automate the discipline. The hardest part of any seasonal plan is following it in October when screens are red. Systematic execution — for example through AI autopilots that apply consistent rules around position sizing and risk-off conditions around the clock — removes the emotional override that destroys most calendar-based plans. You can compare plans on the pricing page or browse the rest of our research in the stories library.
Individual names dance to their own seasonal calendars too — semiconductor leaders like NVDA cluster around earnings and product cycles, mega-caps like AAPL around product launches — which is another reason index-level averages should only ever be the starting layer of an analysis.
FAQ: S&P 500 Seasonality
What is the best month for the stock market?
By average return since 1950, April and November (+1.5% each) lead, with December close behind (+1.4%). December has the highest hit rate — positive in roughly 74% of years.
What is the worst month for stocks?
September, by a clear margin. It is the only month with both a deeply negative average return (−0.7%) and a sub-50% share of positive years since 1950.
Does “Sell in May and go away” actually work?
The performance gap is real — roughly +6.8% in November–April versus +1.7% in May–October since 1950 — but mechanically exiting has historically lowered total returns after taxes and costs. Most professionals read it as “expect less from summer,” not “go to cash.”
Is 2026 a good year for stocks historically?
2026 is a midterm year — the weakest of the four-year presidential cycle (+4.5% average) with the largest average intra-year drawdown (~17%), typically bottoming between August and October. The flip side: the S&P 500 has been higher 12 months after every midterm election since 1950.
Should I trade based on seasonality alone?
No. Seasonal averages hide enormous year-to-year dispersion, and well-known calendar edges decay once publicized. Use seasonality as a prior that adjusts position sizing, and confirm with live breadth, credit, earnings-revision and volatility data before acting.
The Bottom Line
The 76-year seasonal map of the S&P 500 is remarkably stable in shape: a powerful November–April engine, a flat and accident-prone summer, one genuinely dangerous month in September, and an October that ends more bear markets than it starts. Layer on the presidential cycle and 2026 reads as a year to stay invested but stay humble — with the historically weakest stretch of the cycle directly ahead in late summer, and the historically strongest 12-month window of the entire cycle beginning right after the midterms.
Calendars set the stage; data decides the play. Combine the two, and seasonality stops being a slogan and becomes what it always should have been — a base rate in a bigger, live-updating model of the market.
3 key takeaways from a tough week on Wall Street
Published Fri, Aug 21 20264:01 PM EDT
Updated Fri, Aug 21 20267:51 PM EDT
While the market finished Friday’s session higher, it wasn’t enough to overcome a losing week.
The S&P 500 and Nasdaq Composite snapped a three-week advance, seeing five-day losses of more than 1% and roughly 2%, respectively. The Dow Jones Industrial Average dropped about 1%, its straight weekly decline.
Here’s what weighed on the market this week:
Bonds in driver’s seat
Sovereign bond yields were the major catalyst for the week’s pressure.
On Tuesday, yields around the world jumped to multi-year highs as fears around inflation and government borrowing, among others, plagued investors.
Yields declined Wednesday after the Treasury Department pledged to at least double government debt buybacks in the next few months, before rising again the next day, with the 30-year Treasury bond yield retracing all of Wednesday’s decline.
Long yields continued to rise Friday.
“We can’t cross 40 trillion in debt and have the Federal Reserve with a massive balance sheet and expect that rates can come down in the face of a good economy,” said Leo Kelly, founder and CEO of Verdence Capital Advisors. “This is going to be an ongoing tug of war on these rates now.”
“You have to fix the addiction to spending in government,” he continued.
Conflict in the Middle East only adds to the pressure on bonds. So long as the conflict there rages, fueling inflation thanks to higher energy prices, that will further drive up yields, according to Adam Phillips, managing director of investments at EP Wealth Advisors.
The Treasury Department’s buyback operation is “not the cure to what ails the bond market,” Philips said.
Signs of slower consumer spending
Walmart contributed to the downdraft on Thursday, when its shares saw their worst one-day slump in more than four years after the country’s largest brick-and-mortar retailer said U.S. same-store sales growth in the second quarter fell short of Wall Street expectations.
Walmart highlighted other causes for concern, beyond the damage from new caps on drug prices, Phillips said.
“No matter how you slice it, this wasn’t a great quarter for Walmart,” he said. “They’re seeing an increasingly selective buyer who is extremely cost conscious, and I expect us to remain in that environment, especially as we see sustained oil prices that remain elevated.”
Walmart is an economic bellwether, he noted. “They provide a really good insight into what that lower part of the K is doing,” Phillips said, referencing the so-called K-shaped economy.
Static U.S.-Iran war
The Middle East war also dominated headlines after a 60-day peace window expired earlier in the week without the U.S. and Iran reaching an agreement.
While Iran’s president reportedly signaled a desire for the war to end, oil prices increased as Washington threatened economic pressure on the country, with President Donald Trump saying in a post on Truth Social that “this will be Economic Warfare and Isolation on an unprecedented scale.” The U.S. kept up a blockade of Iranian ports and Iran continued intermittent attacks on maritime traffic.
“We’re back to watching the negotiations in real time,” Jason Stephens, founder at Evertern Wealth, told CNBC. With the midterm elections in less than 11 weeks, he believes the Trump administration will feel a growing push to get something done over the next month or so.
Earnings –
COST 9/24 AMC
LULU 9/03 est
MRVL 8/27 AMC
MU 9/23 est
NKE 9/29 est
NVDA 8/26 AMC
https://www.briefing.com/the-big-picture
The Big Picture
Where will our markets end this week?
Higher
DJIA – Bullish
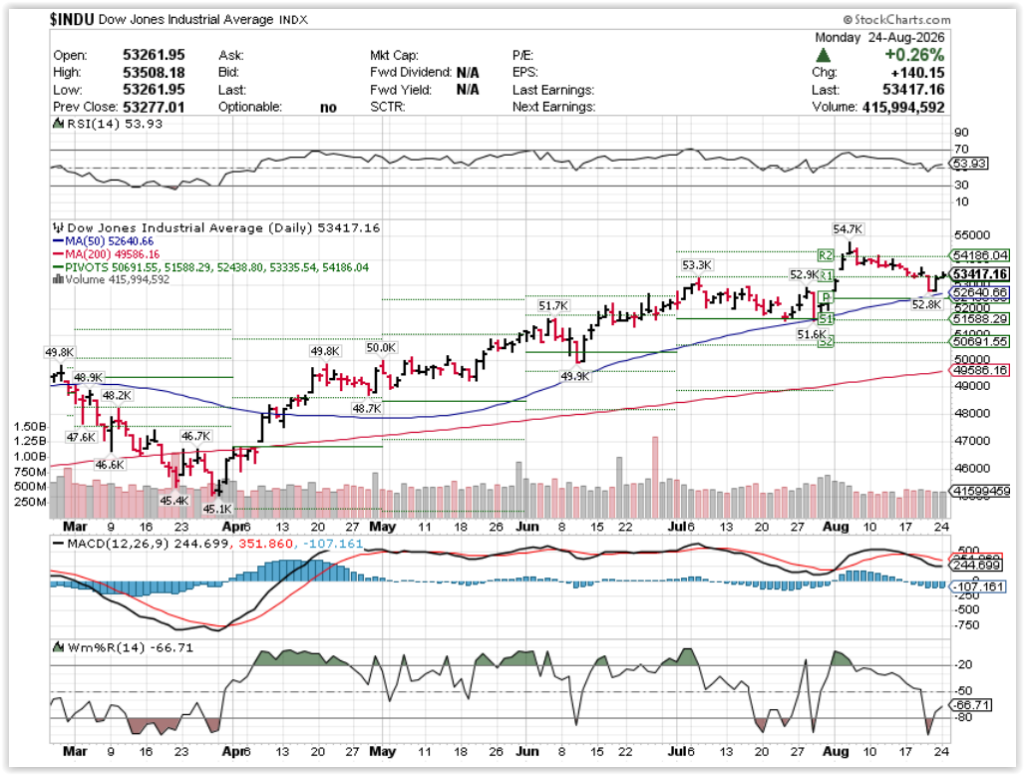
SPX – Bullish
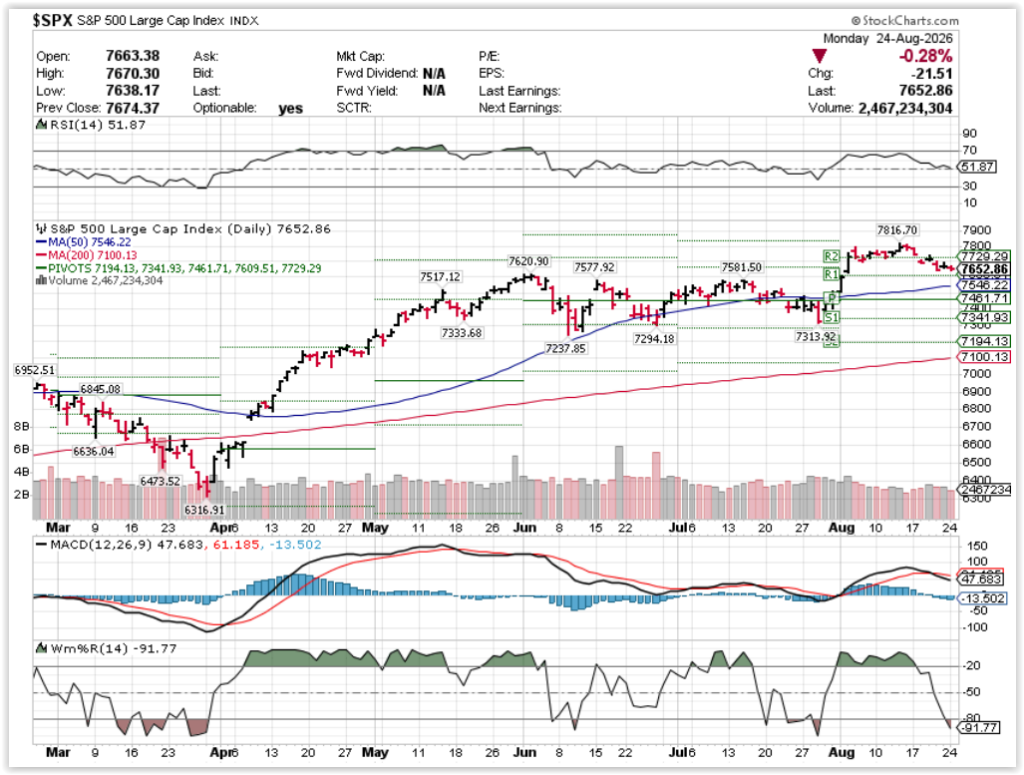
COMP – Bullish

Where Will the SPX end August 2026?
08-24-2026 +1.50%
08-17-2026 +1.50%
08-10-2026 +1.50%
08-03-2026 +1.50%
Earnings:
Mon:
Tues: DKS, INTU, ZM
Wed: ANF, KSS, HPQ, CRM, URBN, NVDA
Thur: BBY, BURL, GAP, ULTA, MRVL, DG, DLTR,
Fri:
Econ Reports:
Mon:
Tue: FHFA Housing Price Index, S&P Case-Shiller, Consumer Confidence, New Home Sales,
Wed: MBA, Personal Spending, Personal Income, PCE, PCE Core, GDP, GDP Deflator, Durable Goods, Durable ex-trans
Thur: Initial Claims, Continuing Claims,
Fri: Chicago PMI, Michigan Sentiment
How am I looking to trade?
Placing ATM puts or slightly OTM for September Effect
Adding Covered Calls to positions for the summer doldrums
www.myhurleyinvestment.com = Blogsite
info@hurleyinvestments.com = Email
Questions???
AI is so big, it’s now impossible for investors to avoid
Stocks, corporate bonds and venture capital are increasingly dominated by a single investment theme, Apollo points out
By
Follow
Updated July 16, 2026, 7:43 a.m. ET
The AI theme hasn’t just cornered the stock market, it has systematically swallowed up corporate credit and venture capital, too.
Referenced Symbols
For decades, the golden rule of investing was simple: Put 60% of your money into stocks for strong returns and 40% into bonds for safety. But according to Torsten Slok, chief economist at Apollo, that classic framework is officially dead.
“The new 60-40 is AI vs. non-AI,” Slok wrote in a slide deck shared with MarketWatch.
Exposure to the artificial-intelligence boom has become virtually impossible for investors to avoid. The theme hasn’t just cornered the stock market. It has systematically swallowed up corporate credit and venture capital, too.
As a result, many investors who probably intended to hold a diversified portfolio of stocks, bonds and alternatives may not be aware of just how heavily leveraged they are to AI.
The 10 largest companies in the S&P 500 already make up about 40% of the capitalization-weighted index’s value, Slok pointed out. Rest of S&P 500Top 10Share of top 10 companies in S&P 500
Among the 10 largest companies in the index, nine have businesses that are tied to AI, with the lone exception being drugmaker Eli LillY. Similar levels of concentration can be found in foreign stock markets as well, most notably emerging markets, where a handful of semiconductor names in Taiwan and South Korea have come to dominate major emerging-market indexes.
Source: Apollo
Credit and venture-capital investors are also pouring historic amounts of capital into the theme. In 2026, nearly all net new venture investment has flowed to companies in the AI space. Meanwhile, in the investment-grade bond market — where recent massive debt offerings from companies like Oracle
and SpaceX
have received a lukewarm reception from investors — AI infrastructure now accounts for nearly half of all net new bond issuance.
| AI issuance | Non-AI issuance | |
| Investment grade | 49% | 51% |
| Venture capital | 87% | 13% |
| High-yield | 38% | 62% |
| Source: Apollo |
Even those who don’t own assets are still probably more exposed to the AI investment theme than they realize. If the AI boom falters, the consequences could be felt by investors and ordinary consumers alike. Over the past few years, the race for AI dominance between the U.S. and China has evolved from a popular investment trend into a genuine macroeconomic risk.
Slok said he expects the money pouring into the AI data-center buildout to drive about half of the 2% real GDP growth expected for the U.S. economy in 2026.
The big risk, of course, is that the technology fails to deliver the hoped-for results: a dramatic boost to worker productivity and to corporate profit margins. So far, the only companies that appear to be making money off the technology are those that make the semiconductors and other equipment needed to power and operate AI data centers.
“It needs to be the case that this will generate a lot of productivity gains, a lot of profit margin, a lot of earnings growth — especially for the 493,” Slok told MarketWatch in an interview. He was referring to the companies in the S&P 500 that aren’t members of the “Magnificent Seven,” an elite group with trillion-dollar valuations.
“There’s no doubt that the Mag Seven have done well, but at the end of the day, is this going to spill over?” he said.
If the data-center buildout were to slow, the effect of that slowdown in spending could ripple across the economy. Also, a sharp decline in asset values could quickly spill over into the real economy. Since the COVID-19 pandemic, the wealth effect has played an increasingly important role in driving consumption in the U.S.
So far, investor appetite for AI-related assets has remained robust, even as an AI-driven momentum trade has hit the rocks in July, according to Rob Haworth, a senior strategist at U.S. Bank Wealth Management.
Also read: The U.S. stock market is becoming ‘too big to fail’
The fact that the S&P 500 hasn’t seen a bigger pullback suggests that for now, investors are shifting money into other corners of the market, rather than pulling it out of equities entirely, said Mark Hackett, chief market strategist at Nationwide. The index finished Wednesday roughly half a percentage point shy of its most recent record finish in early June.
“Market sentiment is telling you the demand is there, credit spreads aren’t widening out, so investors aren’t being scared away by all of this debt issuance,” Haworth told MarketWatch on Wednesday. “The story is still strong.”
Exxon CEO Just Explained Gas Prices Honestly, and It Demolishes a Decade of Political Talking Points

When gas prices climb, Washington reaches for its favorite villain. Price gouging. Corporate greed. Big Oil profiteering. It is a script so well-worn that both parties can recite it in their sleep, and it has the singular advantage of requiring no understanding of how energy markets actually work.
On July 31, ExxonMobil chairman and CEO Darren Woods went on CNBC’s Squawk Box and, in about fifteen minutes, dismantled the whole act with a single observation that any American paying four dollars a gallon deserves to hear.
“There’s a disconnect today because now we have a refinery constraint,” Woods said. “Pump prices are being established by the supply and demand of refined petroleum products, not crude.”
Read that again, because it explains what has baffled drivers for months. Crude oil peaked above $126 a barrel in the spring after Iran’s war closed the Strait of Hormuz. It has since retreated to the $85 to $90 range, sliding further this week on renewed talk of a deal that could reopen the strait. Yet regular gasoline still averages above $4 a gallon nationally, and diesel sits north of $5.30, according to federal Energy Information Administration data. The old rule that pump prices follow crude has broken, and Woods explained precisely why.
The Bottleneck Nobody in Washington Wants to Discuss
For most of modern history, the world had more refining capacity than it needed. Crude was the binding cost, so when crude fell, gasoline fell with it. That cushion is gone. The war and the Hormuz closure did not merely choke off crude shipments.
They simultaneously knocked out Middle Eastern refined-product exports and starved Asian refineries of the Gulf crude they depend on, erasing nearly 9 percent of global refining capacity in one stroke. Refineries that still have crude to run, particularly American ones, are earning crack spreads of $50 to $60 a barrel against a historical norm in the twenties.
That is not greed. That is arithmetic. When the world loses a tenth of its ability to turn oil into fuel, the price of fuel detaches from the price of oil, and no congressional hearing or Federal Trade Commission investigation can legislate the physics back into place.
Asked when drivers might see relief, Woods did not sugarcoat it. “I wouldn’t hold my breath here in the short term,” he said, adding that prices will likely stay near current levels until the strait reopens and product flows are reestablished, or until China pushes additional refined exports into the global market. Even a ceasefire will not flip a switch. Shippers burned by six months of tanker attacks will not race back into the Persian Gulf the day a deal is signed.
A Company That Prepared While Others Postured
Here is the part that should sting the anti-fossil-fuel crowd. The same day Woods gave that interview, ExxonMobil reported second-quarter earnings of $14.5 billion and free cash flow of $17.2 billion, despite temporarily losing roughly 10 percent of its upstream production to the Middle East conflict.
Excluding that disruption, the company posted its highest production in more than two decades, driven by record Permian output and Guyana. Its Gulf Coast refineries delivered record second-quarter diesel production while global supply tightened. The company returned $9.4 billion to shareholders and, in a fitting bit of symbolism, completed its move from New Jersey to Texas on July 1.
“The second quarter was shaped by disruption, but defined by execution,” Woods said in the earnings release. Translation for policymakers who spent a decade demonizing domestic energy investment while blocking pipelines and refinery expansions… the companies that kept drilling, kept refining, and kept investing are now the reason American fuel supply has held together at all. The United States has not built a major new refinery since the Carter administration. Every politician who cheered that stagnation owns a piece of today’s pump price.
The men of Issachar were commended in Scripture as those “that had understanding of the times, to know what Israel ought to do” (1 Chronicles 12:32).
Understanding the times is precisely what our energy debate lacks. The times demand refining capacity, secure shipping lanes, and leaders who grasp that affordable fuel is the foundation of a working family’s budget, not a bargaining chip in a climate crusade.
Woods handed the country an honest diagnosis. Whether Washington has the humility to accept an explanation that does not involve a villain is another question entirely. History suggests the subpoenas will arrive before the understanding does.
Jim Cramer says the market is too negative — and that’s creating buying opportunities
Published Tue, Aug 18 20266:23 PM EDT
Alexa LoMonaco@in/alexa-lomonaco/
Key Points
- CNBC’s Jim Cramer said widespread pessimism over rising rates, oil prices and inflation is pushing stocks lower and creating more attractive buying opportunities.
- Cramer pointed to resilient consumer spending and continued AI infrastructure demand as reasons investors shouldn’t become overly bearish.
It’s important to remember we are a service economy, says Jim Cramer
CNBC’s Jim Cramer said Tuesday the relentless negativity surrounding the market is creating opportunities for investors willing to look past the headlines and endure a little more near-term volatility.
His comments came as rising Treasury yields, persistent inflation, and elevated oil prices weighed on stocks. All three of the major indexes finished the day in the red. The 30-year Treasury yield touched 5.33%, its highest level in nearly two decades, while Brent crude topped $90 a barrel as U.S.-Iran negotiations remained stalled. However, Cramer argued those concerns are overshadowing signs of resilience in the economy.
“I know ‘not bad’ isn’t much of a clarion call. But you’re certainly getting better prices than you’d see if the backdrop were good,” the “Mad Money” host said. “Maybe that’s the way to think about it. That’s the opportunity, and the cost seems to be manageable, even if this likely isn’t the exact bottom.”
“I am saying that it’s not all bad … that it could get better,” he said.
Cramer pointed to oil and bonds as two areas where fears may be overdone. While higher crude prices are adding to inflationary pressure, he doesn’t expect Brent crude to rise much beyond $100 as additional supply comes online. Higher Treasury yields could also eventually attract buyers, he said, as investors can lock in increasingly attractive returns on government debt. Bond yields move inversely to prices, so all else equal, an increase in buyers would push down yields.
He also sees opportunity in technology. With a record number of short bets on the Nasdaq 100, Cramer said he is looking to use the weakness to gradually buy beaten-down data center stocks. He highlighted Micron, which Cramer’s Charitable Trust, the portfolio run by CNBC’s Investing Club, recently purchased amid strong demand for memory used in AI infrastructure.
Resilient consumer spending gives Cramer another reason not to become too bearish. Airbnb reported strong travel demand, while Club holding Home Depot delivered what Cramer called its “best quarter in five years.”
“All I can tell you is that, at the end of the day, we’re a service economy,” Cramer said. “If service is doing well then you can’t be too negative.”
Cramer isn’t arguing the market’s problems have disappeared or calling an exact bottom. His point is that widespread pessimism is pushing down prices even as parts of the economy remain strong — potentially giving investors a more attractive entry point if investors’ worries don’t fully come to pass.
Jim Cramer talks strength beneath the surface in the economy
Jim Cramer’s Guide to Investing
Click here to read Jim Cramer’s Guide to Investing at no cost to help you build long-term wealth and invest smarter
Sign up now for the CNBC Investing Club to follow Jim Cramer’s every move in the market.
Santoli: Why all the fuss about bond yields is happening now
Published Mon, Aug 24 20267:54 AM EDT
Updated Mon, Aug 24 20268:31 AM EDT
Michael Santoli@michaelsantoli
Key Points
- The textbooks say the cycle high in real yields should act as a restraint on economic growth and equity valuations.
- Veteran technical strategist Rick Bensignor believes that tech stocks may have peaked in relative terms and healthcare and financials are better positioned.
- The 1968 classic book, “The Money Game,” shows that concern about so-called circular financing is nothing new on Wall Street.
It’s a ripe summer in the American economy, and the AC thermostat hangs in the hottest room in the house, the kitchen, where the sun streams in and the oven is always set to broil.
The thermostat in this case is the bond market, working to offset the blistering demand for debt from governments and companies by raising borrowing costs to multiyear highs. The kitchen is the AI-buildout sector, desperate to turn some $2 trillion into vast reserves of computing capacity by the end of next year.
The lift in bond yields isn’t having much effect in moderating the pace of capital-raising and corporate investment. But it could threaten to overcool other parts of the economy, such as housing and Main Street spending.
This is the backdrop in which Treasury Secretary Scott Bessent sought to restrain longer-term Treasury yields last week by expanding an existing program to buy back small amounts of less-liquid government debt in the open market.
The move prompted a rather overheated response from market participants and commentators, as either a bad look for a Treasury Secretary who had charged his predecessor with untoward massaging of market rates, or too small to matter, or both. The criticism intensified after the initial drop in yields reversed a day later, while sharp declines in the U.S. dollar and jump in gold prices held, a combination that could be read as a vote of no confidence in the stewards of the financial-policy apparatus.
And, of course, the selloff in bonds inevitably inflames worry over a long-threatened fiscal breakpoint becoming reality. Unease over the U.S.’s ability to finance structural deficits is like an autoimmune condition: It flares up under the stress from adverse market stimuli, such as overheating capex and war-inflation feedback loops, then often goes dormant again.
But would it come as a surprise to learn that the 10-year Treasury yield’s rise last week amounted to a mere 4 basis points, to 4.74%? That the yield has been up here before a couple times over the past three years, if only briefly? What about the fact that the yield on investment-grade corporate debt remains below its peak from a few years ago, because spreads over Treasuries are so snug?
The absolute yield level isn’t broadly punitive yet to big companies. Nor, for now, is it a strong undertow pulling down equity values. With nominal GDP growth (real growth plus inflation) running near 5-6% right now, how much lower would one expect 10-year yields to be? The steepness of the yield curve is likewise not extreme relative to historical ranges.
So why all the fuss?
The orderliness of the move so far has allowed the stock market to hang relatively tough for now. There are no clear trigger thresholds for yields that instantly undercut equities, even if equity investors are watching warily.
The textbooks say the cycle high in real yields – the 30-year real yield, or nominal yield minus market-projected inflation, now exceeds 3% – should act as a restraint on economic growth and equity valuations. Such effects can be subtle, long-gestating and offset for a time by exciting corporate growth in the here and now.
It’s also important to recognize that the S&P 500 has lived pretty comfortably in that same sweltering kitchen with the AI builders. About a third of its recent earnings growth is directly from AI infrastructure companies. It truly is a capital-goods and business-to-business benchmark more than a gauge of broad U.S. consumption. The consumer-discretionary sector makes up 9.2% of the S&P, but its weight drops below 4% if AI/tech proxies Amazon and Tesla are excluded.
Thus, the market hovers within a couple of percent of record highs, even as last week showed July housing starts fell 12.4% and Walmart posted its weakest quarterly comparable-store sales growth since 2020.
This isn’t to suggest the underlying economy is struggling broadly; not at all. Consumer-spending growth oscillates in a stable range, unemployment is low, the aggregate consumer debt-service burden manageable.
Yet wage growth is sagging while inflation remains elevated, tax-refund windfalls are in the past and the real juice in the economy remains corporate spending fueled by ample earnings – a capital-over-labor dynamic that makes rising interest rates play to the public as an exacerbating factor on “affordability” rather than a positive sign of household-sector momentum.
Countertrend rally in bonds?
For investors, the same fattening of real yields embedded in Treasuries that raises the hurdle rate for borrowers represents compensation paid to the owners of the debt. Is value therefore building in bonds, just as conventional wisdom turns against their role as a diversifier for equities?
Barry Knapp of Ironsides Macroeconomics notes the latest climb in yields has occurred in the face of softer inflation and employment readings and spottier consumer data: “Although we continue to be secular bond bears, and do not view the Treasury Secretary’s actions as a significant positive catalyst, we still think there is scope for a countertrend rally in long maturity [Treasuries].”
The S&P 500 did slouch 1.4% last week as the bond market dominated the chatter. Equity investors are watching the bond market ration capital through higher yields to the public and private sectors. The main thing stock folks are worried about – the voracious consumption and headlong deployment of capital for AI – is now the thing lifting rates and potentially restraining growth elsewhere.
Semiconductor stocks fell more than 5%, their rebound rally stopping right at “logical” resistance levels, while there was some slippage in the market’s clockwork rotations. Banks did not love the Treasury-market ructions, sliding 4%. Industrials, a pricey shadow AI play, lost more than 3%. The S&P 500 itself receded back toward the top of its prior multi-month range that held from May through July before bouncing modestly.
Rick Bensignor, a veteran macro and technical strategist now at Bensignor Investment Strategies, reads the tape as saying that tech has peaked in relative terms and healthcare and financials are better positioned. He spies some technical warnings in the action: “The S&P 500 shows 10 of the last 13 sessions with ‘closed’ candles, suggesting real institutional selling after the Aug. 4 upside breakout day. If Nvidia doesn’t bring new material buying [with its results on Wednesday], I really raise the caution flag.”
Market Temperature Gauge
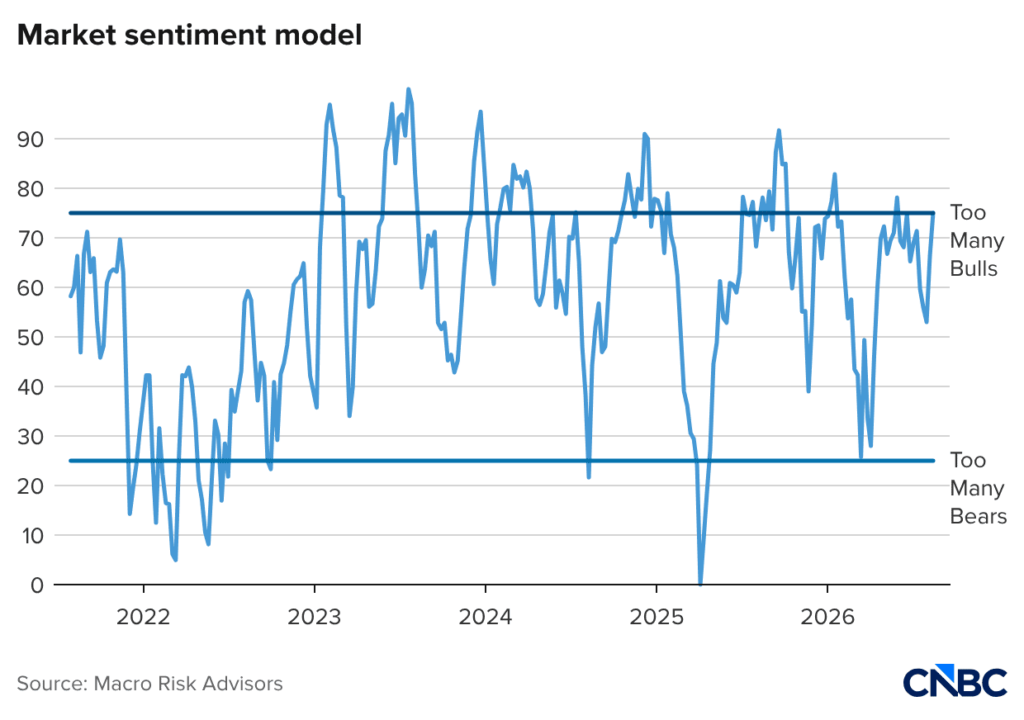
This indicator from John Kolovos of Macro Risk Advisors uses several data points to reflect both what investors are saying and what they are doing.
Kolovos on the latest reading: “A jump in sentiment partially explains this week’s pullback in stocks. Of concern remain low levels of implied volatility, while sentiment surveys are starting to show more bullish respondents. We’ve been advocating tactical VIX call spreads as an insurance policy despite my bullish forecast for the market.”
Around the Street
— “The Money Game,” by the writer who published under Adam Smith, is rightly esteemed as one of the best chronicles of Wall Street ever set to paper. Appearing in 1968, it captures a previous technology boomtime in the markets, when mainframe computers (and space-and-defense tech) were exciting imaginations and inflating valuations.
The discussion of today’s “circular financing” of customers’ tech purchases by the big hardware manufacturers finds an echo in this anecdote, in which a grizzled veteran asks a “kid” investor how he made a 100x profit in six months:
“Computer leasing stocks, sir!” he said, like a cadet being quizzed by an upperclassman. “The need for computers is practically infinite,” said Billy the Kid. “Leasing has proved the only way to sell them, and computer companies themselves do not have the capital. Therefore, earnings will be up 100% this year, will double next year, and will double again the year after that. The surface has barely been scratched. The rise has scarcely begun.”
— The Wall Street Journal delivers an engaging obituary of Victor Niederhoffer, a roguish, infamous trader who lived a vivid life and died earlier this month.
Niederhoffer would email me now and then back when I wrote a column for Barron’s, typically delivering a patronizing backhanded compliment suggesting one of my pieces showed that I “almost got it.”
His most acute scorn was reserved for my then-colleague, Alan Abelson, the longtime lead columnist and former Barron’s editor known for his florid, literate and persistent bearishness. Vic likened Alan to “a priest who doesn’t believe in God – a stock-market writer who hates the stock market.”
Vic never hated the market, but it didn’t always love him back: He made and lost two fortunes, blowing up by effectively shorting volatility before market collapses.
Market on Close
The way earnings growth has outraced rising stock prices in recent quarters has allowed bullish voices to celebrate valuation compression done the easy way.
This is true if focusing on the standard price-to-earnings ratio, which has ebbed from 23 to 20 in the past 10 months. But, as we know, the biggest earners are reinvesting furiously to bankroll the AI buildout. Now what’s scarce, along with memory chips and gas turbines, is free cash flow.
Here we see the S&P 500 price-to-free-cash-flow ratio, using projected FCF, sitting just under 30, a multi-decade high.

Another way to express this: Stocks have a free cash flow yield of 3.4% as 10-year Treasuries sit at 4.74%.
The corporate cash burn is largely a choice, of course, though the heavyweight tech platforms are not behaving as if they see plausible alternatives to competing in the arms race toward superintelligence. Or at least to accrue enough data center capacity to rent to those trying to create a new collective consciousness out of silicon.
Wells Fargo and Citigroup have room to buy a big bank. These 5 regionals fit the bill
Published Sun, Aug 23 20268:00 AM EDT
Updated Mon, Aug 24 202611:22 AM EDT
Key Points
- Citigroup and Wells Fargo are the only U.S. megabanks with room under the 10% national deposit cap to buy a large regional bank — but neither has moved.
- Wells Fargo CEO Charlie Scharf has signaled openness to a “transformative deal”, while Citi CEO Jane Fraser says the bank’s focus is on organic growth, not M&A.
- Despite looser regulatory barriers, North America bank merger value fell by more than half in the first six months of 2026, according to EY.
- Bain projects one to three new $1 trillion-plus megabanks by 2030 as the number of regional banks shrinks from 49 to as few as 30.
Walk the halls of any major banking conference or listen in on a quarterly earnings call, and one topic keeps coming up: With the window for mergers wide open under the Trump administration, who will take a swing?
After years on the sidelines because of regulatory restrictions, large banks can once again contemplate buying other lenders, even a $100 billion-plus-asset regional bank.
While JPMorgan Chase and Bank of America are barred from such a deal because they already have more than 10% of national deposits, there are two megabanks that could pursue a large acquisition: Citigroup and Wells Fargo. The nation’s third- and fourth-largest banks have enough room under the national deposits cap to pursue a hefty regional bank, according to investment bankers, consultants and investors.
“Two years ago, it was impossible for a bank of that size to get approval to acquire almost anything,” said Brian Graham, co-founder of advisory firm Klaros. “Now, it’s possible they can get a deal done. I’d be shocked if they aren’t exploring it.”
After spending much of the last decade in a penalty box — Citigroup via consent orders and Wells Fargo capped by growth restrictions — both institutions have cleared key regulatory hurdles and are in growth mode.
A large acquisition — like the ones that rival JPMorgan pulled off during the crises of 2023 and 2008 — would give Wells Fargo or Citigroup thousands of branches and billions of dollars in deposits.
For Citigroup, which has only about 650 U.S. branches, it would offer a much-needed source of cheaper funding. For Wells Fargo, which already has a large branch network, such a transaction would add more scale and cost-cutting opportunities.
“There’s a massive race for scale, and the shot clock is running,” KBW analyst Chris McGratty said about the broad need for industry consolidation. “If you want to do something, this is the time to do it.”
While there are over 4,200 banks in the U.S., only a handful would make sense as acquisition targets for Wells Fargo or Citigroup. A viable target needs to be large enough to move the needle, but small enough to keep the acquirer comfortably beneath the 10% national deposit cap. On top of that, a complementary branch network, good cultural fit and quality deposits are must-haves, making most deals hard to justify.
Run screens on those criteria, and five regional banks emerge as strong contenders for either bank.
Fifth Third delivers a commercial and retail engine across the Midwest and a fast-growing Southeastern footprint. Huntington provides a low-cost deposit base alongside a growing branch presence in high-growth markets in Texas and the Carolinas.
Citizens offers dense retail and commercial coverage across affluent Mid-Atlantic and New England cities. KeyCorp brings a middle-market commercial business and branches stretching from the Great Lakes to the Pacific Northwest.
Finally, Regions delivers a retail deposit footprint in the fast-growing Southern corridor, including Texas and Florida.
Beyond that group, a bank that would work specifically for Wells Fargo is Zions, which provides relationships across high-growth Western states, fitting well with its footprint.
For Citigroup, a possible target that makes sense is First Horizon, with its presence across the fast-growing U.S. Sunbelt.
Wells Fargo and Citigroup declined to comment for this article. Most of the regional banks mentioned above also declined to comment, with the exception of Zions and First Horizon, which did not respond.
‘We will look at it’
When asked about the potential for Citigroup to purchase a large bank in April, CEO Jane Fraser said the bank’s focus is on organic growth, not deals.
Still, Citigroup executives reportedly discussed the idea of buying a major regional lender to bolster its deposit base, Bloomberg News said in March. Citigroup said at the time that the report was “baseless speculation.” The firm’s shares dropped more than 4% that day.
To many of the analysts covering the bank, Citigroup is still trying to prove that its self-help story can deliver higher returns. Taking on a large regional bank would add branches, employees, technology systems and integration risk while Citigroup is trying to simplify itself.
“A depository deal would be a major distraction” for Citigroup, said KBW’s McGratty.
Wells Fargo CEO Charlie Scharf, on the other hand, has telegraphed an openness to a transformative deal, from acquiring a bank to a credit-card player, even as he also emphasized the organic growth emphasis.
“We should always consider ways to increase franchise value, including M&A,” Scharf wrote in a March shareholder letter, acknowledging that regulators were more amenable to deals.
While “we feel no pressure to pursue” a deal, Scharf said, “if a great opportunity exists, we will look at it.”
But there’s one problem: So far, the wave of consolidation that many expected when Trump returned to office in 2025 hasn’t materialized. In fact, the value of North America bank mergers actually fell by more than half to $30.1 billion in the first six months of 2026 compared to the year-earlier period, according to EY data.
Yes, regulatory barriers may be falling. But few banks are eager to sell when profits and share prices are rising.
“Most companies have good profit margins, stock prices are really good, and it just raises the bar if they are going to sell,” said Frank Sorrentino, a mergers banker at Stephens. “Everybody thinks they’re a buyer, not a seller.”
Activist investors who have pushed banks to improve shareholder returns say executives are now routinely comparing the economics of an acquisition with simply repurchasing their own stock, creating more discipline around deals.
Regional champion?
The moment is still favorable for mergers, according to Sorrentino, who called it “probably the best environment that we’ve seen since the financial crisis.”
Last year, Congress overturned Biden-era restrictions around mergers at the Office of Comptroller of the Currency, and the Federal Deposit Insurance Corporation reinstated its long-standing merger guidelines, effectively restoring expedited reviews and lowering the bar for regulatory clearance.
When it comes to big acquisitions, Wells has something Citi doesn’t: a stronger stock currency. That could make a deal easier to justify, particularly if the target fills a geographic or product gap.
But another way to win the race is for regionals to team up with each other.
For years, bankers have speculated that two of the three biggest super-regionals — PNC, U.S. Bancorp and Truist — could eventually combine to create a new banking champion capable of taking on the giants.
Bain projects that mergers among regionals will create one to three new megabanks with at least $1 trillion in assets by 2030, according to new research shared with CNBC. The consulting firm’s predictive model, which was based on two decades of data, also found that the ranks of regional banks will shrink from 49 to as few as 30.
“We expect more banks, particularly regional players, to use M&A to add capabilities,” especially around technology including artificial intelligence, Bain said.
That idea hasn’t gone away. If Wells Fargo and Citi decide not to swing, the regionals have to decide whether they can afford to sit on the bench — or merge with each other to keep pace.
The Lehman Bros. moment of the AI bubble is coming, says this critic warning of fallout for tech stocks and the entire market Ed Zitron sees a downfall driven by loss-making subscriptions and an insatiable need for cash By Barbara Kollmeyer |
In Sam we trust? OpenAI could be approaching a Lehman moment, argues artificial-intelligence skeptic Ed Zitron. JASON REDMOND/AGENCE FRANCE-PRESSE/GETTY IMAGES Blowout results from chip giant Taiwan Semiconductor Manufacturing Co., or TSMC, seem to be doing little for sentiment on Thursday. Worries about whether spending on artificial intelligence will pay off has been a downer for some stocks lately. Our call of the day from Ed Zitron, author of “The Hater’s Guide to the AI Bubble,” won’t help much. In a 15,000-word Substack post on Wednesday, Zitron, the founder of a technology-focused public-relations firm, argues that the question is not if, but when, OpenAI will collapse. “Its failure would be a watershed moment — the Lehman Brothers of the AI bubble, and an event that would define the end of one epoch, the start of another, and that would shake the afflicted out of that psychosis,” he writes. A dogged AI critic, Zitron sees a “cultlike” derangement around what he sees as an AI bubble kept alive by OpenAI’s existence. Back in early 2023, when Zitron said he started researching large language models, he called generative AI “the latest gold rush in technology.” He predicted two years ago that OpenAI’s Sora video generator was not viable — and it was canned this March. His Substack post attacks OpenAI’s business model and its plan to “burn over $852 billion by the end of 2030,” along with the $50 billion or more in compute spending this year. The latter, he estimates, is “more than 50% of all global compute spend.” As OpenAI and Anthropic raised $300 billion in the past few years, their infrastructure costs have been funded largely by hyperscalers, who have been creating an illusion that more companies will eat up compute like OpenAI. Oracle ORCL, he notes, is in particular danger from a prospective OpenAI collapse, as it could get stuck with “billions of wasted capex, and endless debt and leases.” Zitron predicts that OpenAI’s collapse will only come after “AI data center debt and venture capital funding has been almost entirely exhausted,” as OpenAI has vast money needs. “Based on my own reporting on its audited financials from 2024 and 2025, OpenAI will need to raise funding at least three more times in the next decade,” he says. Its downfall will be driven by loss-making subscriptions, weak advertising revenue and massive costs for customers, Zitron says. That will curb compute demand, end free ChatGPT and make investors wary of any AI startup, not to mention seizing up related data-center debt. Zitron doesn’t think Anthropic is safe, either, as it’s burning billions on training models, producing way too many Claude iterations and lacking focus. An OpenAI collapse will lead to a “violent, punishing effect on the entire stock market,” he says. The scale, he says, scares him “to the point I’m almost hoping I’m wrong.” In fairness, not everyone is so worried. The legendary investor Howard Marks, co-founder and co-chairman of Oaktree Capital Management, discussed in a podcast that aired on Wednesday how he changed his mind from thinking AI was a possible bubble to being more impressed by the technology. In a “My First Million” episode, Marks explained his shift: “I upgraded my opinion of AI and its potential because of its ability to talk about its own strengths and weaknesses, to use humor, to put information in the context of me, to use what it knows about me. And this is really exceptional stuff.” Marks referred to several qualities of AI that are “unprecedented.” Looking across past technological innovations like the railroads and the internet, he said there’s never been one that has had AI’s “quality of autonomy.” |