
Hurley Investments, LLC
175 W Canyon Crest Road, Ste 101 Alpine, Utah 84004
(888) 287-1030 FAX (801) 820-3180
A Registered Investment Adviser
HI Market View Commentary 12-11-2023
2024 Any Questions????
+8.5% election up year, +7.5% Bond market, Bullish start, down year with a recession, election year with rate cuts, Invest in Oil and Banks, Evercore ISI sees a big pullback in the first half of 2024, Oppenheimer has a bullish outlook for 2024, HSBC hit a new high beginning of the year but will the stock market rally last,
Translation: No one knows WHAT WILL HAPPEN until it does
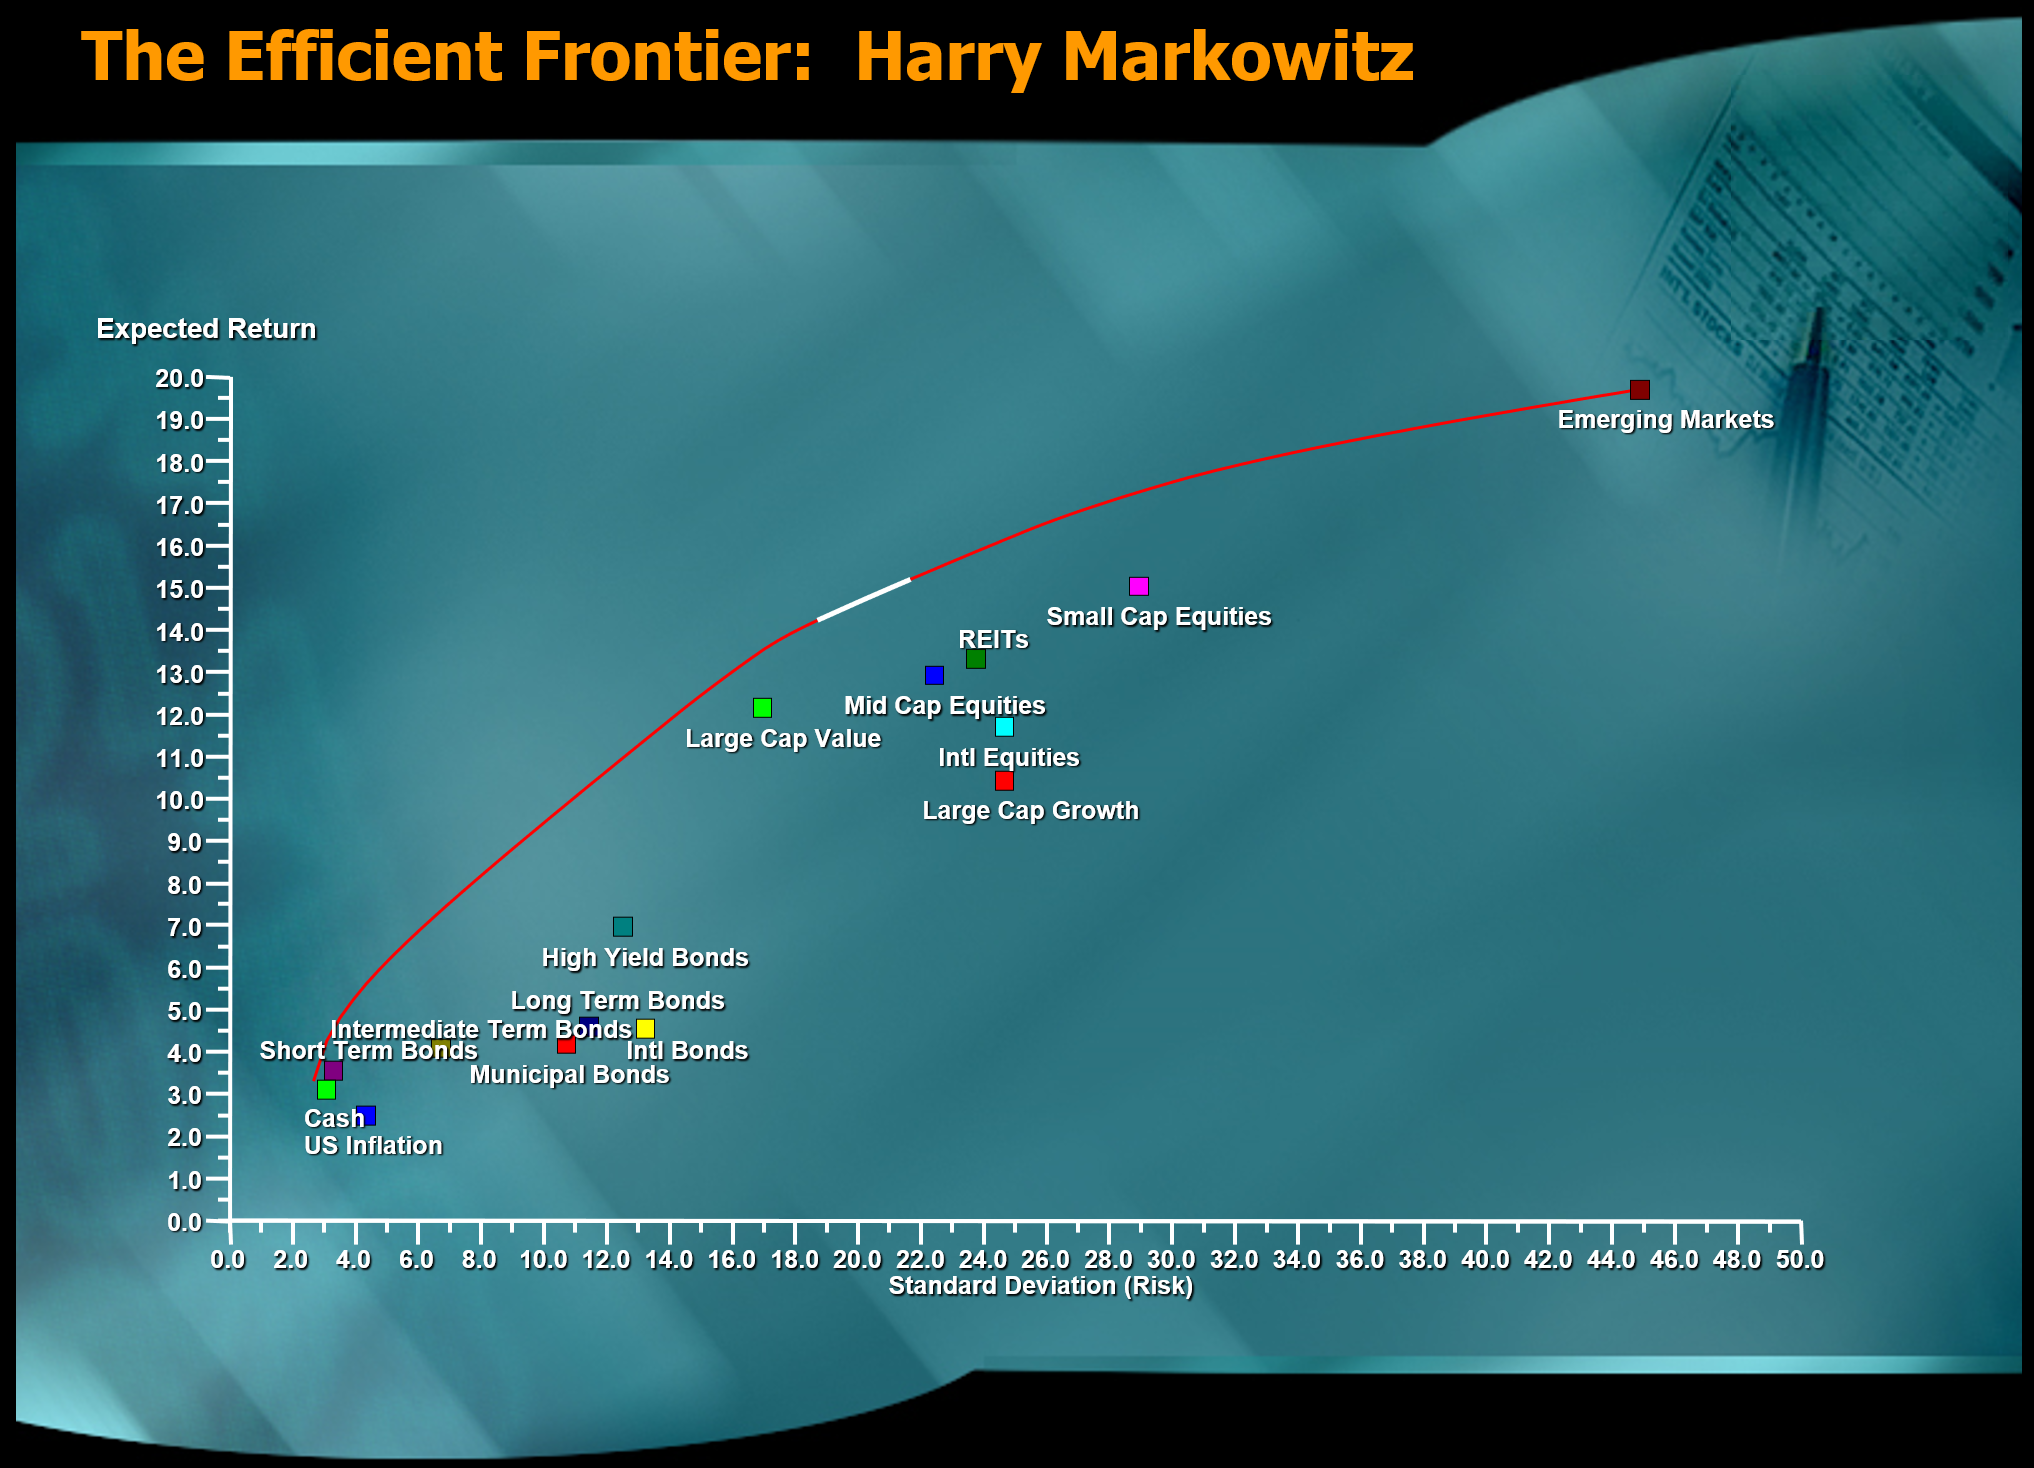
Diversification NEVER was protection
After all the ups and downs, the S&P is right about where it was on July 31 when it was a tad higher. While it is up 10.6% from the October low, the reality is the gains are almost all driven by the so called magnificent seven tech stocks. Of the 18.24% gain for the year,14% of the 18% is purely due to those seven stocks which make up a vastly disproportionate share of the S&P index. The PE multiple is 18.6, but if you take out the 7 then it is 16.4x. Earnings overall are below 2022 levels. So, you need to be very careful not to think the stock market is doing really well this year. It is for the few big tech stocks, but for many others it has gone up only a little, or down.
The Rant
DIS, BIDU, BAC, JPM, UAA, F, BA,
Not much has moved in the last two years, which is why we love process: Make up money on the way down, add more shares of stock (DIS $80.86), when stock come back we make an exponential return while everyone else breaks even
NO TIMING
Stop trying to make money on Protection !!!
YOU DON’T make money on protection when the stock loses more.
https://www.briefing.com/the-big-picture
The Big Picture
Last Updated: 08-Dec-23 16:23 ET | Archive
Preparing for 2024
Your author detests this time of year. Don’t get me wrong and paint me as a Grinch. The disdain has nothing to do with Christmas. Rather, it has everything to do with penning a year-ahead outlook.
They are a necessary evil in this business, we suppose, but in truth they are all educated guesses because no one knows the future with certainty.
We know what we know, and we extrapolate from there, which is why many pundits are forecasting a soft landing for the economy, continued improvement in inflation, a Fed that will cut rates in 2024, a double-digit increase in S&P 500 earnings, and another good year for the stock market.
Still, others prognosticate that the Fed’s aggressive tightening cycle will drive the economy into recession, which in turn means the labor market will deteriorate, earnings will disappoint, and the stock market won’t have a good year.
Oh, and lest we forget, 2024 is a presidential election year that will be ripe with projections, poll analysis, and mudslinging on both sides of the aisle.
What is one to do with all these views? Like Nassim Taleb says, “Invest in preparedness, not in prediction.”
Striking a Balance
The simple takeaway is that an investor’s portfolio should be prepared to capitalize on positive outcomes and to weather negative developments.
Such preparation often entails having a balanced portfolio, typically expressed as a “60-40” portfolio: 60% in equities and 40% in bonds with a skew toward higher quality in both markets.
The 60-40 approach is a bit of a catch-all construct. To be fair, it may be better suited for someone in their 50s than it is for someone in their 20s or their 80s, but the composition will ultimately have a lot to do with risk tolerance, which varies across age groups. A risk-averse 20-something may be just fine with a 60-40 portfolio, whereas a risk-taking 70-something might be entirely comfortable with a 70-30 portfolio.
The good news as 2024 approaches is that there is opportunity on both sides of the portfolio for investors of all ages, unlike past years when bond yields offered little to no real yield without taking on excess risk.
A 1-yr T-bill yields 5.12%; a 30-yr bond yields 4.32%; and the ICE BofA AAA US Corporate Index Effective Yield is 4.76%.
Stocks, meanwhile, are still attractively valued. We say that with an eye on the equal-weighted S&P 500, which trades at 15.3x forward twelve-month earnings versus a 10-year average of 16.4x, according to FactSet.
Meanwhile, small-cap and mid-cap stocks have value-based appeal without qualification. The S&P Midcap 400 trades at 13.7x forward 12-month earnings, versus a 10-year average of 15.6x, and the S&P Small Cap 600 trades at 13.1x forward twelve-month earnings, versus a 10-year average of 15.2x, according to FactSet.
“The” S&P 500
What about “the” S&P 500? The market-cap weighted S&P 500 trades at 18.7x forward twelve-month earnings. That is a slight premium to its 10-year average of 17.5x, so it isn’t terribly overvalued but it also isn’t cheap either.
The hang-up with the market-cap weighted S&P 500 is the concentration risk embedded in the so-called “Magnificent Seven.” That would be Apple (AAPL), Microsoft (MSFT), Alphabet (GOOG), Amazon.com (AMZN), NVIDIA (NVDA), Tesla (TSLA), and Meta Platforms (META).
Collectively, those seven stocks are the main reason why the market-cap weighted S&P 500 is up 20% this year. Their influence is reflected in the fact that the equal-weighted S&P 500 is up only 6.6%.
The index will struggle if these stocks are struggling, but the basis for why they might be struggling is key to the rest of the market. If they are struggling because the economy is performing better than expected, thereby fostering a rotation into more value-oriented stocks, then “the market” could still do okay.
If they are struggling for fundamental reasons, then it is likely those struggles would be more universal in nature, which would not be okay for “the market.” However, economic challenges that lead to fundamental struggles for stocks would be an opportunity for the bond side of an investment portfolio.
To Cut or Not to Cut
Interest rates will be key to the market’s performance in 2024. The rally at the end of 2023 has been predicated in large part on the thinking that the Fed will be cutting rates in 2024, not so much because it has to due to a rapidly deteriorating economic environment, but because it can due to inflation steadily retreating to the Fed’s two percent target.
Prior to the solid November employment report, the fed funds futures market had been pricing in five rate cuts before the end of 2024. Things shifted a bit after the aforementioned employment report, and now “only” four rate cuts are expected.
This view has been priced in even though most Fed officials are still suggesting they are not thinking about rate cuts. Fed Governor Waller came the closest in saying that the policy rate could be lowered if inflation continues to fall for several more months.
The risk for the market is that the Fed, which waited far too long to raise rates and watched inflation run amok, now waits too long to lower rates out of fear of cutting rates too soon and inflaming inflation again. The market would likely be agitated by this thinking, particularly if inflation keeps coming down, sensing that there would be a heightened risk of recession with real rates staying too high for too long.
The good news is that the Fed has room to cut rates to support economic growth, if need be, which is some ammunition it lacked for the better part of the last 15 years.
Price Matters
Rate cuts would be good for the stock market, but you want rate cuts happening for the right reasons. In this case, that would be inflation getting back to target without a concomitant recession. Recessions are bad for earnings.
Data from Yale University Professor Robert Shiller indicates the average peak-to-trough earnings drop in a recession, dating back to 1960, has been about 31%. The current bottom-up EPS estimate for calendar year 2024 is 246.36, according to FactSet, which is 11.5% higher than the calendar year 2023 estimate.
It is important to highlight that 31% is an average, so it is possible to have a much smaller earnings decline or a much larger earnings decline. In any case, it is best for a market trading at 18.7x the calendar year estimate already that earnings don’t decline at all.
That consideration is why we see more opportunity in the equal-weighted S&P 500, and in small-cap and mid-cap stocks, because they aren’t priced at this time for quiescent outcomes. That’s not to say they wouldn’t suffer in the event of a downward revision to earnings estimates, but they are priced more attractively for the possibility that the economic outcome is more adverse than expected. In turn, they are priced more attractively for an economic outcome that is as expected or better.
The state of the labor market is going to be a guiding force for the economy. Consumer spending accounts for close to 70% of GDP, and consumers who are employed are consumers who spend.
2023 is coming to an end with the labor market in good shape. The unemployment rate of 3.7% is near a 54-year low and the 4-week moving average for initial claims is 221,000, roughly where it was before the pandemic. The four-week moving average of 1.872 million for continuing jobless claims is running slightly higher than where it was before the pandemic but remains at a relatively low level overall.
The trend in jobless claims will be important to watch, as that should hold valuable clues for the economic trend.
What It All Means
In about a year from now, we will know what it all means for 2024. We don’t know today. We can only make educated guesses.
A balanced investment portfolio, however, takes some of the guesswork out of the equation, because it is effectively ready to handle any situation or opportunity as it arises.
2024 will have its share of situations and opportunities, but trying to pinpoint an endpoint price target is a fool’s errand. Some pundits are required to do it, and more power to them for hitting the mark. Most do not. According to FactSet, “industry analysts on average have overestimated the final price of the index by about 7.2% one year in advance during the previous 20 years.”
The aggregate prediction today among industry analysts is that the S&P 500 will close at 5,068.41 in 12 months. That’s roughly 10% higher than where the S&P 500 is trading today. So, if you need a price target, there you go.
This price target Grinch doesn’t have the heart to provide one knowing the future is uncertain, making the endpoint a moving target.
Just remember, as the recently deceased Charlie Munger put it, “Opportunity comes to the prepared mind.”
—Patrick J. O’Hare, Briefing.com
Earnings dates:
COST – 12/14 est
MU- 12/21 est
Where will our markets end this week?
?????
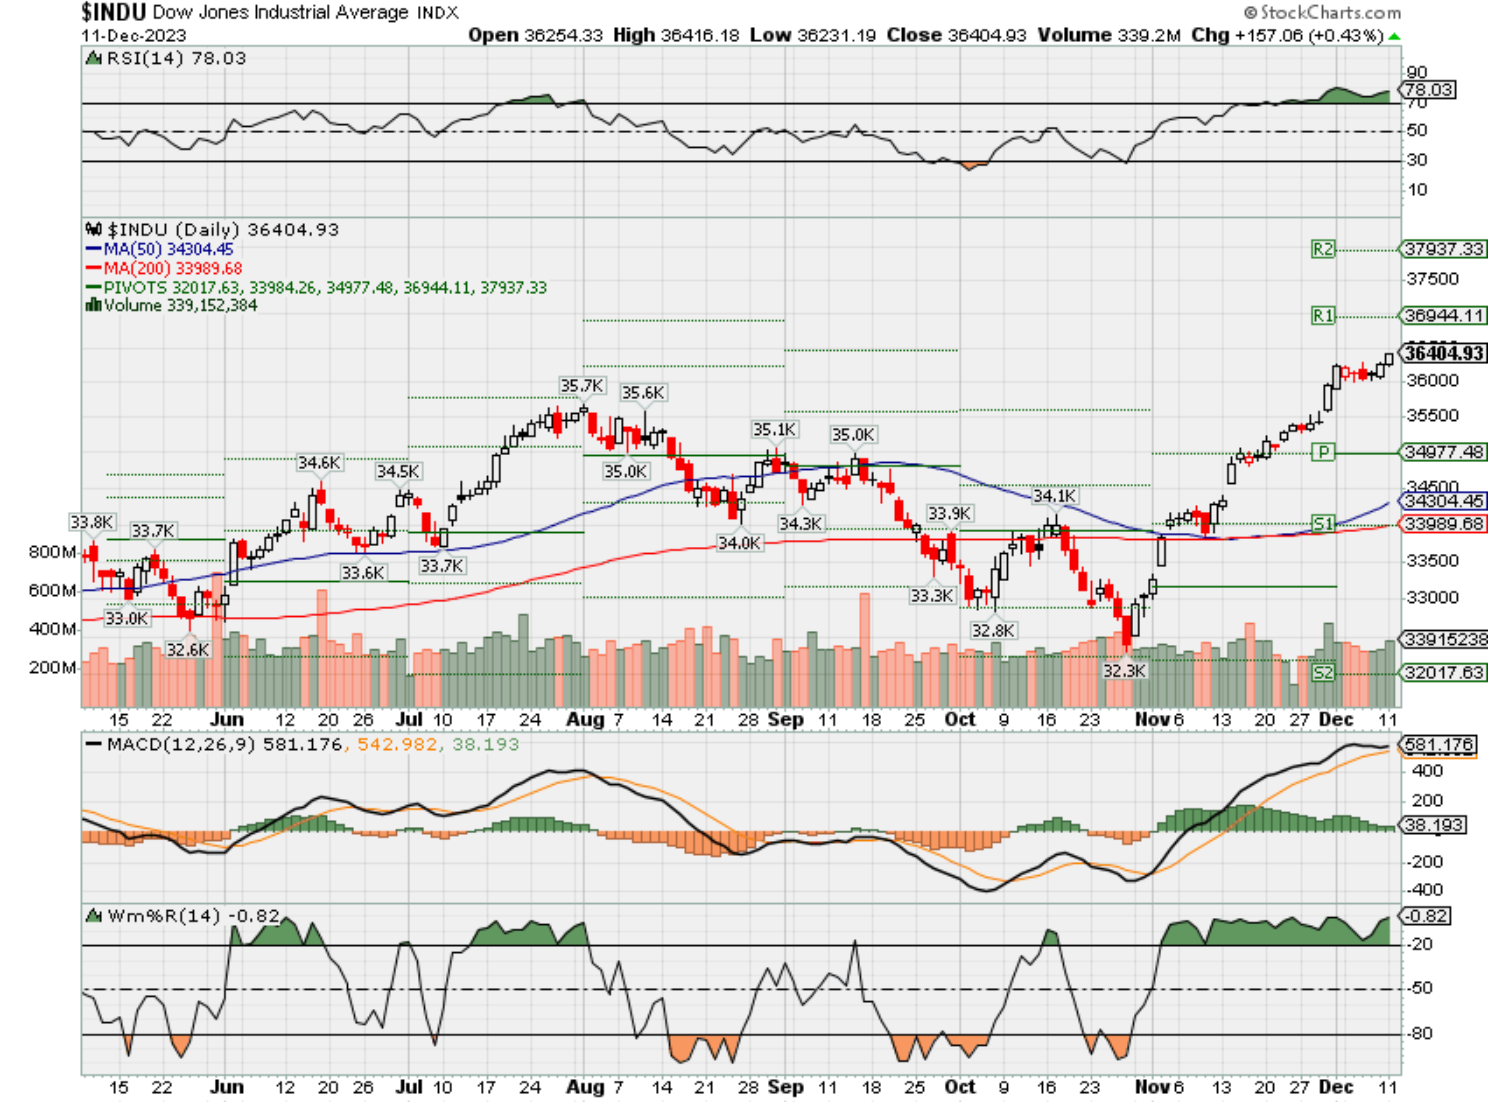
DJIA – Bullish Overbought
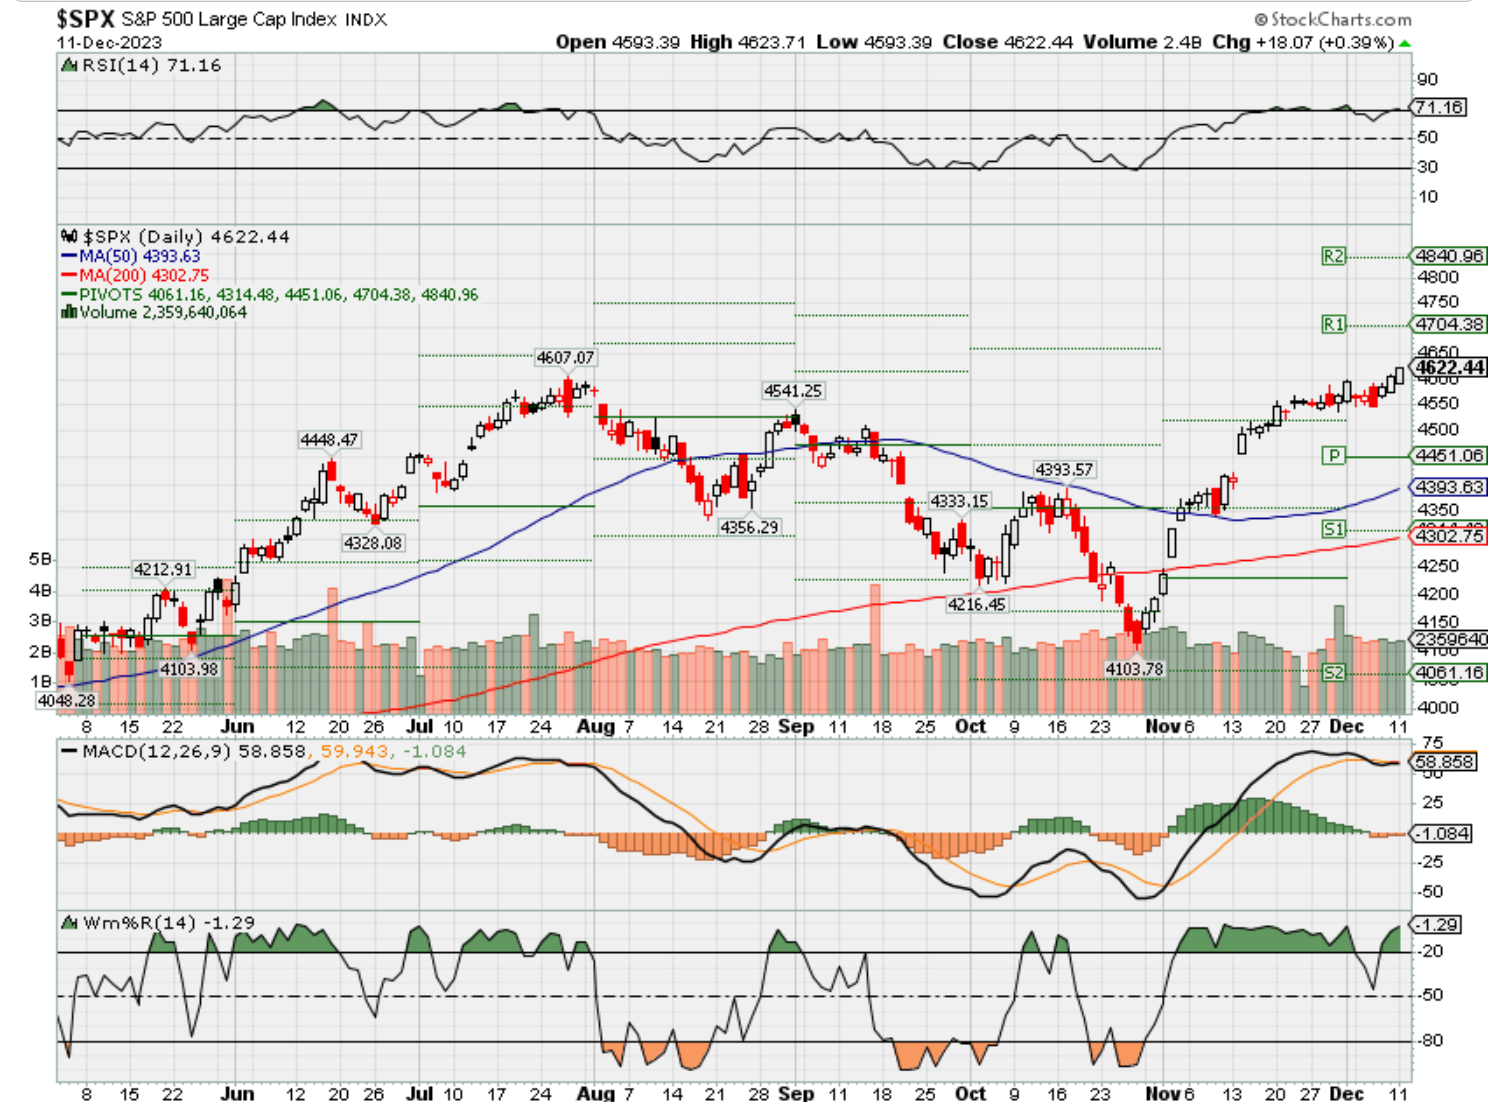
SPX –Bullish overbought
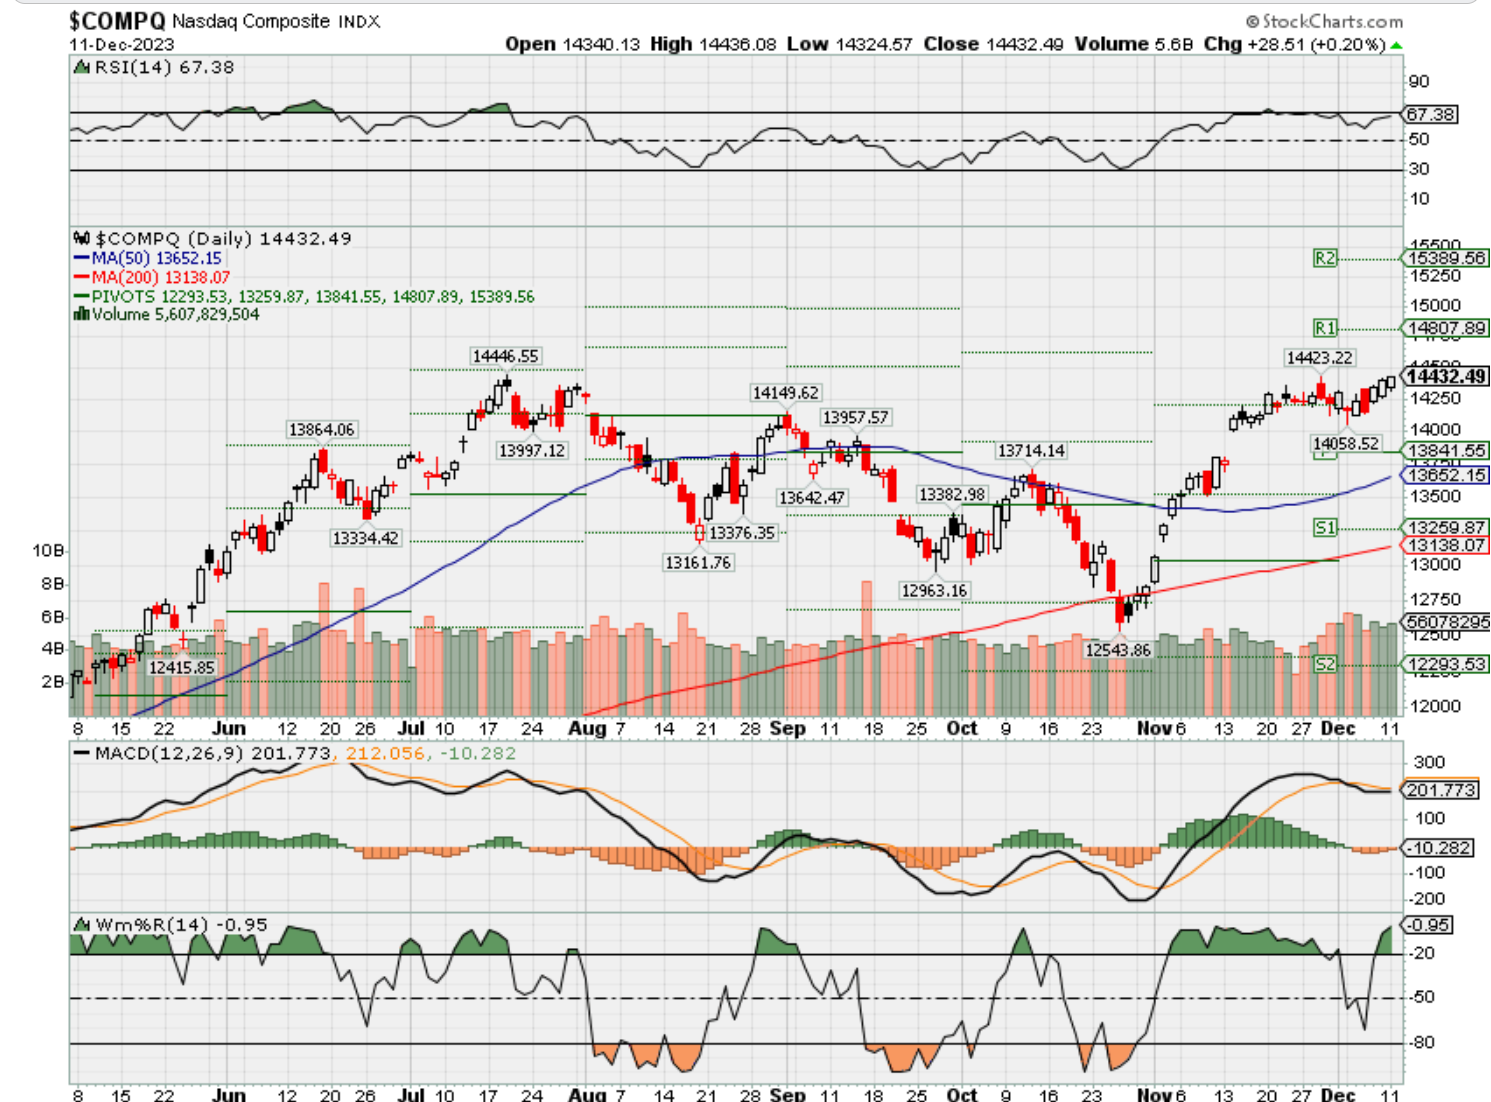
COMP – Bullish Overbought
Where Will the SPX end Dec. 2023?
12-11-2023 +2.5%
12-04-2023 +2.5%
11-27-2023 +2.5%
Earnings:
Mon: ORCL
Tues: JCI, ADBE
Wed:
Thur: COST, JBL, LEN
Fri: DRI,
Econ Reports:
Mon:
Tue CPI, Core CPI, Treasury Budget
Wed: MBA, PPI, Core PPI, FOMC Rate Decision
Thur: Initial Claims, Continuing Claims, Retail Sales, Retail Ex-Auto, Business Inventories, Import, Export
Fri: Empire, Capacity Utilization, Industrial Production
How am I looking to trade?
www.myhurleyinvestment.com = Blogsite
info@hurleyinvestments.com = Email
Questions???
https://finance.yahoo.com/news/extremely-rare-stock-market-signal-010830319.html?guccounter=1
An ‘extremely rare’ stock market signal with a 100% accuracy rate is flashing and points to record highs in 2024
Matthew Fox
- The stock market is likely to see record highs in early 2024 after an “extremely rare” signal just flashed.
- That’s according to Carson Group chief market strategist Ryan Detrick, who highlighted another sign that breadth is improving.
- “We continue to expect stocks to do quite well and we remain overweight equities,” Detrick said.
An “extremely rare” signal just flashed in the stock market, suggesting to Carson Group chief market strategist Ryan Detrick that record highs are imminent.
Detrick highlighted in a Thursday note that more than 60% of all components in the S&P 500 hit a new 20-day high last week. This runs counter to the idea that mega-cap tech companies are driving the bulk of the gains in the stock market.
“Last week, we saw a very rare breadth thrust, which suggested many stocks were surging, which tends to be a signal of impending strength,” Detrick said. “This is extremely rare and showed a lot of buying has taken place recently, not just in a few large stocks.”
Since 1972, this rare signal has flashed 15 times, not counting last week’s signal. The S&P 500 was higher a year later 100% of the time after the signal flashed, generating an average return of 18%.
If a similar gain occurs over the next year, the S&P 500 would trade at just above 5,400, which exceeds even the most bullish stock market forecasts.
Carson Group
Detrick highlighted that there have been other bullish signs in the stock market in recent weeks, including the S&P 500 surging 8.9% in November, representing its 18th best month ever.
When measuring the S&P 500’s 20 best months of performance, stocks were higher 80% of the time a year later, with an average gain of 13%. And when counting the 30 months in the S&P 500’s history when gains were at least 8%, stocks went on to rise 90% of the time in the following year.
“Once again, this signals the strength we just saw was likely the beginning to more strength, not the end,” Detrick said.
Finally, he noted that the S&P 500 hasn’t hit a record high since January 2, 2022, nearly two years ago. With stocks less than 5% away from new highs, Detrick said he expects a record high to be hit in early 2024, and if that happens, it would be one more bullish signal.
“Previous times stocks went at least one full year without new highs and then hit one, the future returns were very solid. In fact, stocks were up 13 out of 14 times a year later and up 14.9% on average after long streaks without a new high and then finally making one,” Detrick explained.
When combined with the “extremely rare” technical breadth thrust signal that flashed last week, all signs are pointing for a continued bull market in 2024.
“Any one of these signals by themselves could be argued to be random, but when you start stacking them all on top of each other, we continue to expect stocks to do quite well and we remain overweight equities,” he said.
Read the original article on Business Insider
https://finbold.com/3-cryptocurrencies-to-avoid-trading-next-week-11/
3 cryptocurrencies to avoid trading next week
CRYPTOCURRENCY Dec 8, 2023
A strong momentum surrounds the cryptocurrency market, with most projects in a weekly green. In this positive scenario, crypto traders can leverage their results by avoiding overbought cryptocurrencies.
Therefore, looking at the Relative Strength Index (RSI) and other technical and fundamental analysis indicators offers valuable trading insights. For that reason, Finbold picked three cryptocurrencies to avoid next week, according to data from CoinGlass.
Notably, this week’s picks will mostly consider the RSI in the daily and weekly time frames. Resulting in the following cryptocurrencies to avoid trading: Bonk (BONK), Holo (HOT), and TraderJoe (JOE).
Avoid trading Bonk (BONK) next week
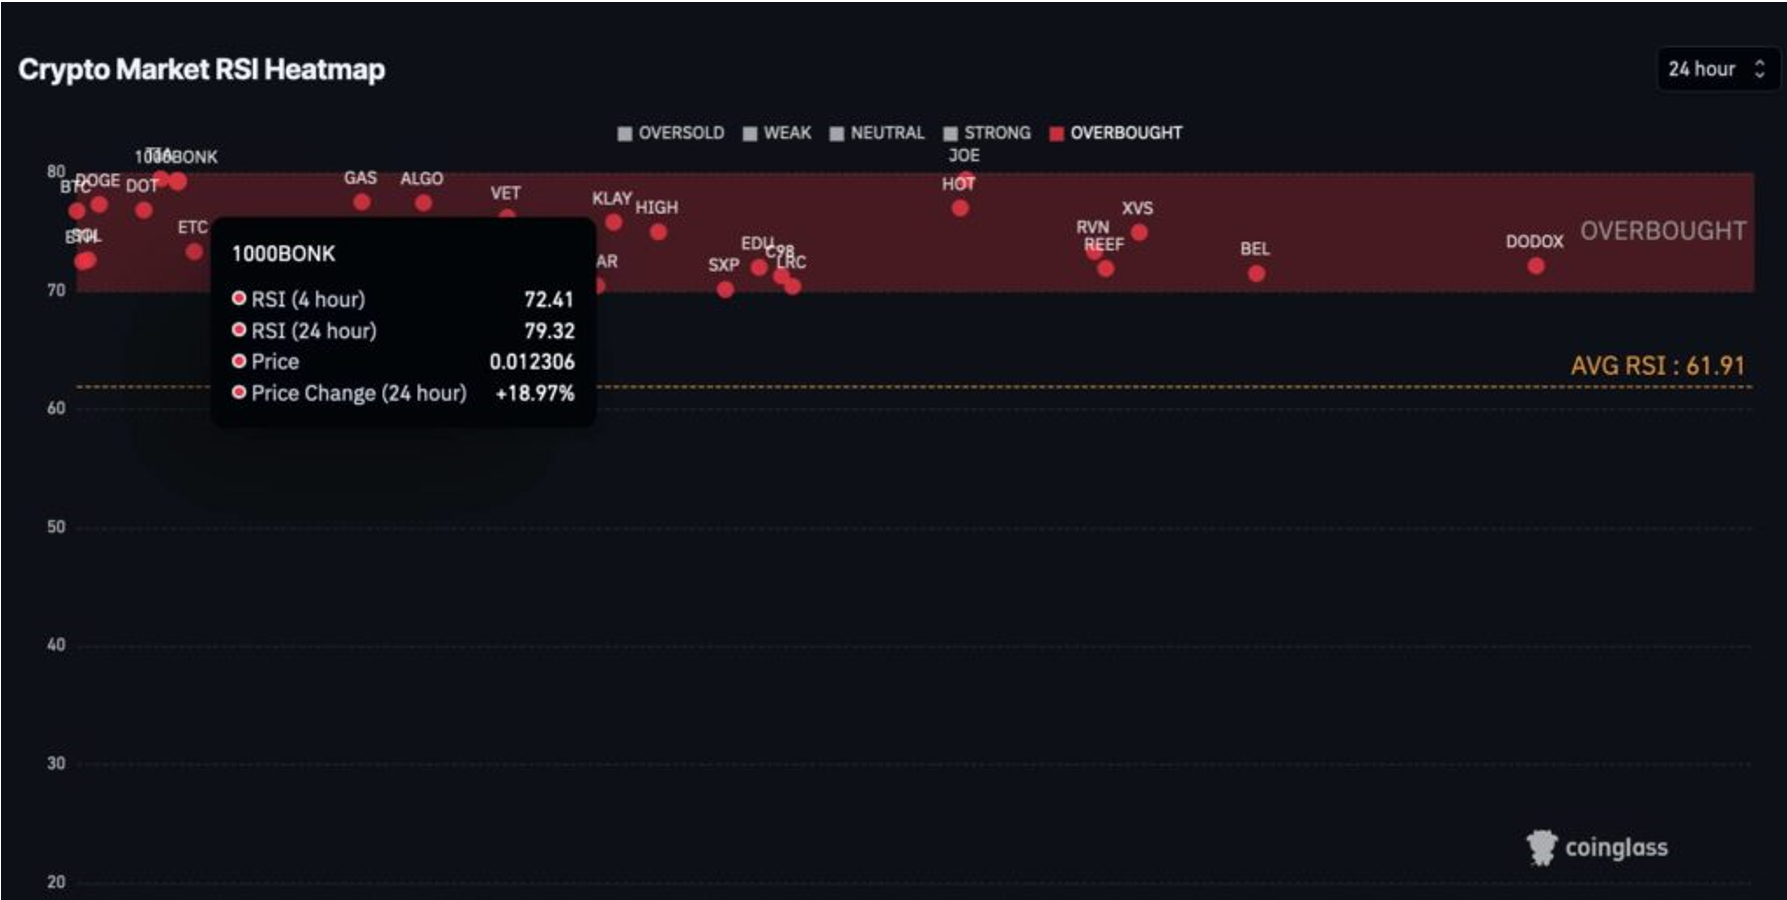
Among the most overbought cryptocurrencies of the day is Bonk, the self-proclaimed first dog-themed coin on Solana (SOL). BONK had a 24-hour RSI of 79.32 at the time of publication, with 72.41 in the 4-hour time frame.
Interestingly, this meme coin has a gigantic 60 trillion BONK circulating supply, which is standard for meme coins. For that reason, CoinGlass indexes it as 1000BONK, priced at $0.0123, up 18% in the day.
Daily Crypto Market RSI Heatmap – 1000BONK. Source: CoinGlass
Bonk rose within Solana as the leading Ethereum (ETH) competitor gained popularity. However, its fully speculative demand might not be sustainable in the long term, and investors should expect a retrace.
Holo (HOT)
Holo is a platform built to host decentralized applications of the Holochain. However, the token HOT is not Holochain’s native accounting asset. It is an ERC-20 IOU token that will become redeemable after the native token launch.
Therefore, traders must be cautious while trading this IOU version, which incurs extra risks.
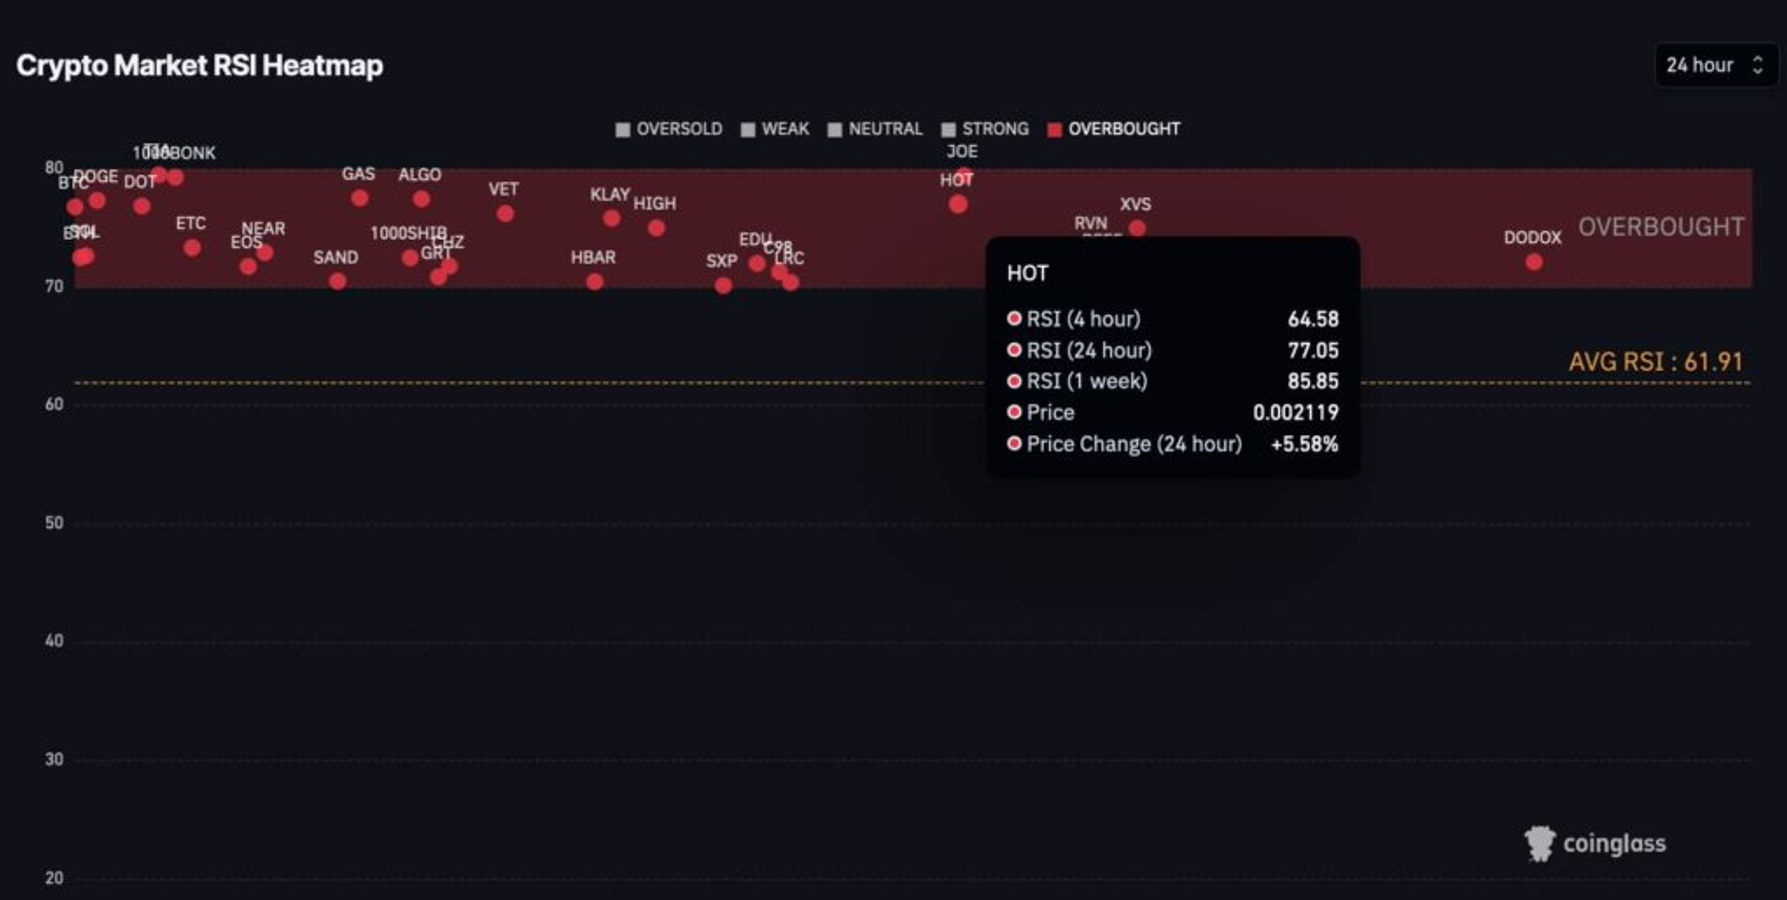
HOT is now trading at $0.002119 by press time, showing high overbought status in both the daily and weekly time frames. Its RSI points to 85.85 in seven days and 77.05 in 24 hours. Nevertheless, it is still in a ‘strong’ momentum at the 4-hour time frame.
Daily Crypto Market RSI Heatmap – HOT. Source: CoinGlass
TraderJoe (JOE)
Meanwhile, TraderJoe’s native token, JOE, features as the last pick of cryptocurrencies to avoid trading next week.
JOE has seen an increased demand with Avalanche’s (AVAX) DeFi ecosystem relevant growth. TraderJoe is a decentralized exchange and one of the most popular and capitalized protocols on Avalanche.
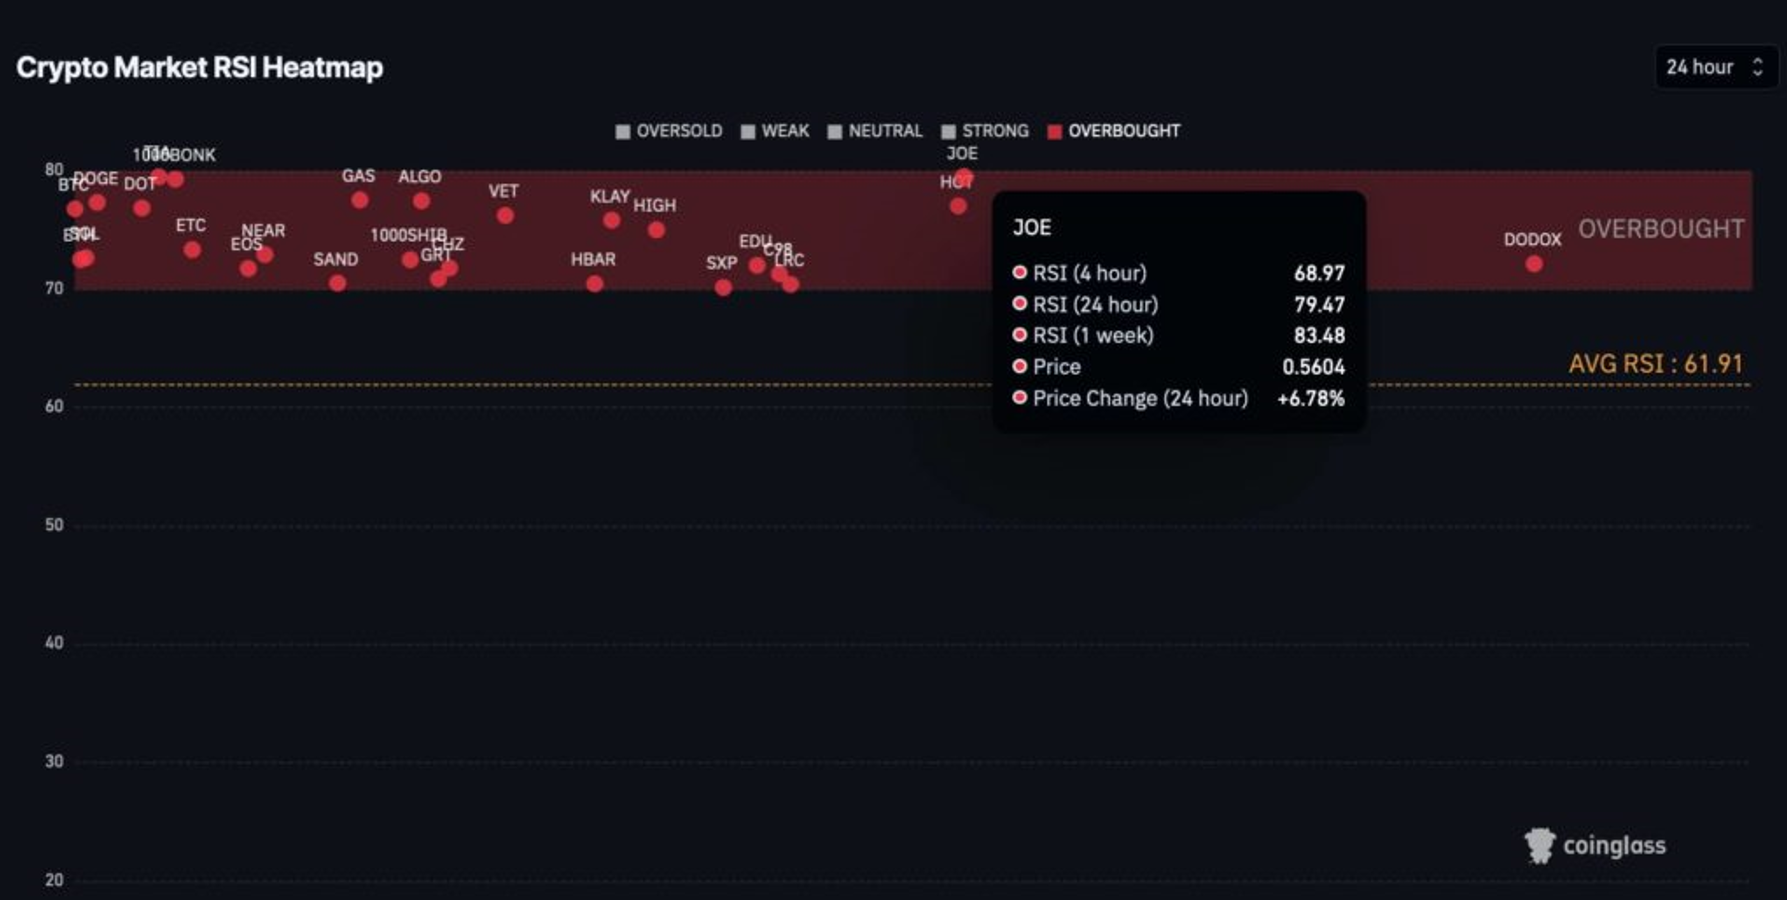
In particular, the protocol has surged in Total Value Locked (TVL), which was reflected in its token’s performance. JOE is changing hands by $0.5604 at the time of publication, up 6.78% in the last 24 hours.
However, it also features as one of the most overbought cryptocurrencies daily and weekly. JOE’s RSI records 83.48 in the week and 79.47 in the day, still growing strong in the last 4 hours.
Daily Crypto Market RSI Heatmap – JOE. Source: CoinGlass
All things considered, any of these three mentioned cryptocurrencies to avoid trading next week might still perform well in the volatile and unpredictable cryptocurrency market. Value is subjective, and speculation could drive prices, capitalization, and ranks upward despite the mentioned aspects.
Disclaimer: The content on this site should not be considered investment advice. Investing is speculative. When investing, your capital is at risk.
https://finance.yahoo.com/news/us-stocks-rise-even-bond-050816488.html
US stocks rise even as bond yields jump after strong labor market data
Aruni Soni
- US stocks rose on Friday as markets digested a strong jobs report that signaled resilience in the economy.
- Bond yields jumped following the data as it suggested Fed rate cuts may not come soon.
- But labor market growth is “occurring against a backdrop in which wage growth is moderating,” a JPMorgan economist said.
US stocks rose on Friday as markets digested a strong jobs report that tested convictions of imminent rate cuts from the Federal Reserve.
The November data showed 199,000 jobs were added to the US economy, compared to 150,000 in October, while unemployment slipped to 3.7% from 3.9% the month before. Following the release, bond yields jumped, with the yield on the 10-year Treasury clocking in at 4.23%.
While the resilient labor market points to economic strength, calming recession fears, it does suggest that markets may have overestimated how soon the Fed may cut rates.
“The Fed has been stymied by better than expected data releases but as long as inflation continues to edge lower the Fed will likely remain on hold,” Quincy Krosby from LPL Financial said. “But if today’s report is a harbinger of continued consumer spending the Fed may have to issue a considerably more hawkish message and telegraph that they still cannot declare victory on their campaign to quell inflation.”
Meanwhile, JPMorgan’s chief US economist thinks that the strong jobs data is not a sign of a protracted fight against inflationary pressures.
“We’re seeing, generally speaking cooling in wage pressures,” Michael Feroli said in a Global Data Pod podcast episode on Friday. “So one might be concerned that this still resilience in the labor market is creating a problem for inflation, but actually it’s occurring against a backdrop in which wage growth is moderating to a more sustainable level.”
Here’s where US indexes stood as the market closed at 4:00 p.m. on Friday:
- S&P 500: 4,604.37, up 0.41%
- Dow Jones Industrial Average: 36,247.87, up 0.36% (130.49 points)
- Nasdaq Composite: 14,403.97, up 0.45%
Here’s what else is going on:
- OPEC and Saudi Arabia are losing their grip on the oil marketas prices see the longest fall in five years.
- A new study showsthat a stock-only strategy offers better returns than a 60/40 mix over the long-term.
- An “extremely rare” stock market signalwith a 100% accuracy rate is flashing and points to record highs in 2024.
- Fundstrat’s Tom Lee said that stocks are taking off on a “liquidity rally”and will rocket to new highs next year.
In commodities, bonds, and crypto:
- Oil prices rose withWest Texas Intermediate up 2.65% to $71.18 a barrel. Brent crude, the international benchmark, moved up +2.39% to $75.82 a barrel.
- Goldslipped by 1.35% to $2,018.08 per ounce.
- The10-year Treasury yield surged more than 10 basis points to 4.23%.
- Bitcoingained 2.06% to $44,135.50.
Read the original article on Business Insider
Ford cuts planned 2024 production of electric F-150 Lightning in half
PUBLISHED MON, DEC 11 20235:55 PM ESTUPDATED AN HOUR AGO
SHAREShare Article via FacebookShare Article via TwitterShare Article via LinkedInShare Article via Email
KEY POINTS
- Ford Motor will cut planned production of its all-electric F-150 Lightning pickup roughly in half next year.
- It marks a major reversal after the automaker significantly increased plant capacity for the EV in 2023.
- EV demand has been slower than many expected, as prices and interest rates remain high. But sales of the F-150 Lightning have steadily increased this year.
DETROIT — Ford Motor will cut planned production of its all-electric F-150 Lightning pickup roughly in half next year, marking a major reversal after the automaker significantly increased plant capacity for the electric vehicle in 2023.
The new production plans call for average volume of around 1,600 F-150 Lightnings a week at Ford’s Rouge Electric Vehicle Center in Dearborn, Michigan, starting in January, according to a source familiar with the decision. The automaker most recently planned to produce roughly 3,200 of the vehicles on average per week.
“We’ll continue to match production with customer demand,” a Ford spokeswoman said Monday.
Ford executives have recently said the automaker will match production to demand, as the company cancels or postpones $12 billion in upcoming EV investments.
The production cuts for the F-150 Lightning were first detailed in a planning memo to suppliers obtained by Automotive News. The memo cited “changing market demand” for the cuts, according to the publication.
EV demand has been slower than many expected, as prices and interest rates remain high. Automakers are working to cut costs of producing all-electric vehicles, while rethinking production and product plans for the years ahead.
Ford spent six weeks earlier this year to increase capacity of the F-150 Lightning at the Michigan plant, which was expected to be capable of producing 150,000 of the all-electric trucks, three times its initial planned output.
Sales of the F-150 Lightning have steadily increased in 2023, notching a monthly record of roughly 4,400 sold in November. The company has only sold 20,365 of the trucks this year through November, up 54% from a year earlier.
HI Financial Services Mid-Week 06-24-2014