
HI Market View Commentary 09-26-2022
This Year’s stock market theme
Isiah 5:20-21
20 Woe Unto them that call evil good, and good evil. That put darkness for light, and light for darkness; that put bitter for sweet, and sweet for bitter!
21 Woe unto them that are wise in their own eyes, and prudent in their own sight!
But Higher interest rates are never good news for the stock market and CURRENT Bond holders
What can we make on a current bond?= 4% BUT what can we make maybe a year from now?= 7%
So here is the problem, 1 year from now a 4% treasury bond will yield 8% which means all the 4% bonds are worth half as much as the 8%
SO what will the value be of the 4% bond purchased @ $1000
Par value when the time run out = $1000
Trading value is only $500 to $600 4% bond that you could make 40% more is discounted 40%
YOU DON’T FIGHT THE FED? = 23.31% from CNBC
We made the warning about the market being down 35% HOW Interest rate hike = how much more this year? Oct 0.75 Dec 0.75
Would another 1.5% interest rate hike kill the markets? Probably
What else wants 4.5% unemployment rate
Las two weeks before today the S&P 500 was down 9.3 – 9.8 (CNBC)
HI = 0.0056
Possible market catalysts to move it higher into the of the year
Christmas Rally = Catch for money managers = Seasonal
Elections = Republicans must win the House because I will stop funding for Executive orders and put gov’t into gridlock
Fed commenting on a pause in interest rate hike to let the hike take economic effect
Which means we have a 10% down year
IF we add shares here shortly you have a 13.3% upside plus another 10-20 % with shares added
IT IS THE BEAUTY OF THE COLLAR TRADE METHODOLOGY
Earnings dates:
MU 9/28
https://www.briefing.com/the-big-picture
Last Updated: 23-Sep-22 15:03 ET | Archive
The bond of friendship between the Fed and stock market is broken
It is a gift to have a best friend in life. They are someone you can lean on in a time of need or just hang out with to make the fun times even more fun.
A best friend can support you with positive feedback or sometimes support you with tough love by giving you the feedback you don’t want to hear but need to hear.
What a best friend won’t do is abandon you. They will stick with you through thick and thin. All friendships, though, have their challenges — even the best of friendships.
The stock market finds itself dealing with such a challenge right now. Its best friend — the Fed — is breaking the bond it formed with the stock market for the better part of the last 14 years and it isn’t apologizing for doing so.
A Dickensian Age
The bond of friendship between the Fed and the stock market was forged on the persistence of rock-bottom interest rates. It was strengthened by the introduction of quantitative easing and a willingness to provide stimulative monetary policy when the times got tough.
The times got pretty tough, too, in the last 14 years.
There was the global financial crisis, which was the worst of its kind since the Great Depression. There was the eurozone debt crisis. And there was the first global pandemic in one-hundred years.
The response in all instances was to cut policy rates sharply (or at least not raise them from rock-bottom levels), to buy copious amounts of Treasury and agency mortgage-backed securities, and/or introduce emergency lending facilities to keep the flow of credit going.
It has been a Dickensian age alright, replete with the best of times and the worst of times. Practically speaking, it was the worst of times for the real economy and the best of times for the stock market. Granted there were a few bouts of pain for the stock market along the way, but the chart below conveys how the Fed’s friendship during these tough times greatly benefited the stock market.
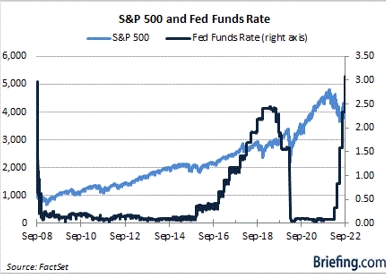
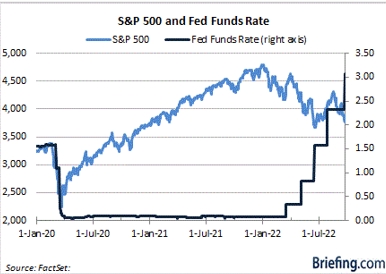
One can see on the right side in the chart above, however, that the fed funds rate has moved up rapidly this year. One can also see how the stock market has turned lower with that rapid shift in the fed funds rate. The chart below provides a better snapshot of the correlation that otherwise speaks to a frayed relationship.
Legacy on the Line
If you want to understand why the stock market is acting so poorly, all you need to do is to understand this: the Fed is no longer interested in being the stock market’s best friend. It doesn’t even want to be its friend.
The Fed can’t be the stock market’s friend, not with the inflation rate near a 40-year high and the Fed’s inflation-fighting credibility on the line.
At the same time, Fed Chair Powell’s legacy is on the line. Don’t think he doesn’t know that, as he continues to point to the inflation-fighting work former Fed Chair Volcker did back in the day as a template for what must be done today to restore price stability.
Fed Chair Powell has gone so far as to admit that the Fed’s (new) policy approach will lead to pain for some families, tacitly asserting that if it leads to a hard landing, so be it. The only objective right now is to get inflation back down to the 2.0% target and to restore price stability.
That mission will be accomplished with higher interest rates that weaken demand. The new median estimate for the Fed’s terminal rate is 4.60%, up from 3.80% in June, which is to say it is a moving target. Fed Chair Powell sounded quite confident, too, that the Fed will get to that rate relatively quickly.
The unknowns are whether that will indeed be the terminal rate and how long the Fed will sit at the terminal rate (whatever it proves to be) when it gets there.
Quick Change
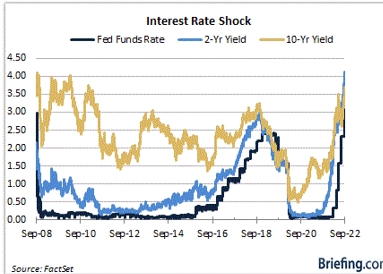
There has been a sharp adjustment in the Treasury market to account for the higher interest rate projections and a sharp adjustment in the stock market to account for the increased uncertainty about the economic outlook because of the higher interest rates.
And the stock market is not used to these higher rates.
The current target range for the fed funds rate is 3.00-3.25%, the current 2-yr note yield is 4.19%, and the current 10-yr note yield is 3.68%. Over the last 14 years, the average effective fed funds rate is 0.54%, the average 2-yr note yield is 0.96%, and the average 10-yr note yield is 2.32% (and that includes the spikes seen this year).
Truly, market participants should not be surprised by how high rates have gone. They should be astounded that they were kept as low as they were for as long as they were.
The added problem today, though, isn’t how high rates have gone. It is how quickly they have risen. When the year began, the fed funds rate was at the zero bound, the 2-yr note yield stood at 0.73% and the 10-yr note yield stood at 1.52%.
The pace of change has been a destabilizing force for stocks, as market participants have found reason to fret over liquidity constraints, quantitative tightening, offsides positioning, and the possibility of other central banks selling Treasury securities to support their weak currencies.
In brief, the pace of change has been disarming and it has reduced equity investors’ willingness to take on risk. At the same time, the higher interest rates have created newfound valuation pressures for stocks and newfound competition that hasn’t existed for the better part of the last 14 years.
What It All Means
It is easy to think that the last 14 years are what “normal” looks like in terms of interest rates. Nothing could be further from the truth. It has been an abnormal period and what a long, strange trip it has been.
That trip is ending and a return to “normal” is materializing. That will take some getting used to.
Transitions like this can be rough, especially when they happen abruptly like this one has. Reduced equity values — greatly reduced in many instances — are an unfortunate consequence of higher interest rates.
That’s because expectations need to be reset to account for slower growth, and a potential recession, in an environment of restrictive monetary policy.
Call it climate change, only in this case things are cooling down after a heated era of rock-bottom interest rates provided by a market-friendly Fed. Well, the Fed is no longer the stock market’s friend and that reality bites.
The Fed’s friendship with the stock market will be rekindled one day, but that day is a mystery at this point. Right now, the Fed is providing tough love that the stock market clearly does not want to hear and hasn’t heard for a long time.
—Patrick J. O’Hare, Briefing.com
https://go.ycharts.com/weekly-pulse
| Market Recap |
| WEEK OF SEP. 19 THROUGH SEP. 23, 2022 |
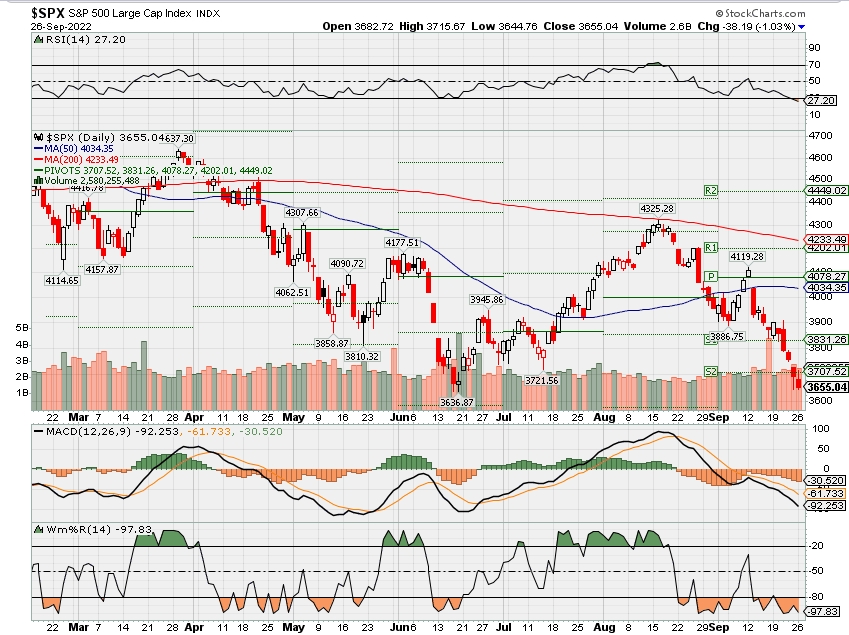
| The S&P 500 index fell 4.6% last week as the Federal Open Market Committee increased its key lending rate by another 75 basis points and signaled more tightening is ahead while a number of central banks elsewhere also boosted rates to try to combat inflation. The S&P 500 ended Friday’s session at 3,693.23, down from last Friday’s closing level of 3,873.33. This follows a 4.8% tumble last week ahead of the FOMC meeting and puts the market benchmark’s slide over the last two weeks at 9.2%. With just one week remaining in the month, this puts the S&P 500’s decline for September to date at 6.6%. The index is now down by nearly 23% for the year to date. At its low of the day on Friday, the S&P 500 traded at 3,647.47, the closest the index has come to its 52-week low of 3,636.87 since that low was set in June. The Dow Jones Industrial Average, meanwhile, hit its lowest level of 2022 on Friday. Last week’s slide came as the FOMC, the US Federal Reserve’s policy-setting committee, delivered its third consecutive 75-basis-point rate increase while also sharply raising its year-end benchmark lending rate outlook. The federal funds rate is now in a range of 3% to 3.25% while the year-end target for the rate is now at 4.4%, up from 3.4% previously. The rate increase by the Fed’s FOMC was followed by similar moves globally by officials at other central banks, including the Bank of England. On Friday, investors’ concerns about the impact on global economic growth escalated as data showed a sharp decline in economic activity in Europe, raising the risk of a recession there. All of the S&P 500’s sectors fell on the week. Energy had the largest percentage drop, down 9%, followed by a 7% slide in consumer discretionary and a 6.4% fall in real estate. The slimmest decline was in consumer staples, which shed 2.1%. The energy sector’s tumble came as futures in natural gas and crude oil also fell. The decliners included APA (APA), which said it has hired professional services firm GHD to conduct independent verification of the oil and gas company’s environmental projects emissions data over the next two years. Shares of APA lost 19%. In consumer discretionary, shares of Ford Motor (F) slid 16% on the week as the automaker issued a warning that its Q3 inflation-related supplier costs are projected to run about $1 billion higher than originally forecast in the quarter. The company also said supply shortages will result in a higher-than-planned number of vehicles awaiting parts at the end of Q3. Real estate’s drop came amid worries about how badly demand in the sector will be hurt by the continued climb in lending rates. Among the decliners, shares of Duke Realty (DRE) fell 4.6% last week while Prologis (PLD) shares shed 4.5%. The narrower drop in consumer staples came as General Mills (GIS) reported fiscal Q1 earnings above analysts’ expectations and lifted its fiscal 2023 guidance, prompting the food products company’s shares to rise 5.2% on the week. “Significant inflation and reduced consumer spending power has led to an increase in at-home eating and other value-seeking behaviors,” General Mills CEO Jeff Harmening said in prepared remarks. Next week, the final week of Q3, the market will receive key data on the housing market, economic growth and inflation. Tuesday will feature releases of August new home sales as well as the S&P Case Shiller US home price index for July, followed by the pending home sales index for August on Wednesday. Thursday, Q2 revised gross domestic product will be released, followed by the Friday release of the Personal Consumption Expenditures or PCE price index, a closely watched inflation reading, for August. Provided by MT Newswires |
Where will our markets end this week?
Lower
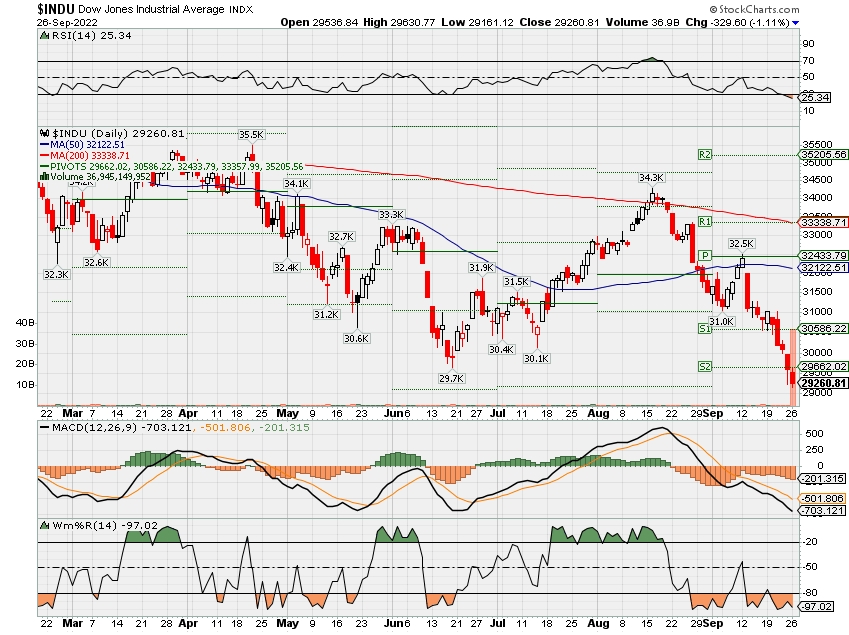
DJIA – Bearish
SPX –technically bearish
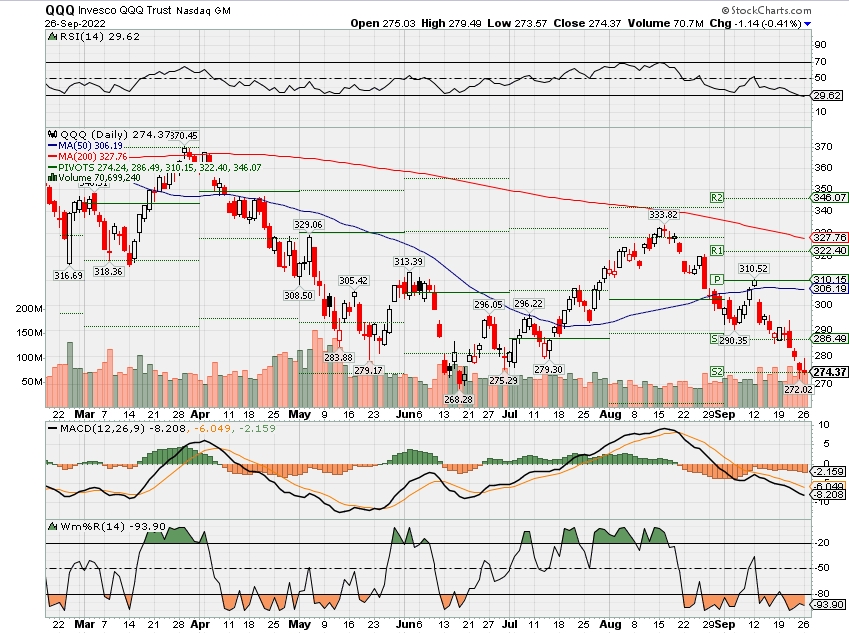
COMP – Bearish
Where Will the SPX end October 2022?
09-26-2022 -2.0% or 10%
Earnings:
Mon:
Tues: JBL, BB
Wed: PAYX, JEF, MTN
Thur: BBBY, KMX, RAD, NKE, MU
Fri:
Econ Reports:
Mon:
Tues: Durable, Durable ex-trans, FHFA Housing Price Index, S&P Case Shiller Index, Consumer Confidence, New Home Sales
Wed: MBA,
Thur: Initial Claims, Continuing Claims, GDP, GDP Deflator
Fri: PCE Prices, Chicago PMI, Personal Spending, Personal Income, Michigan Sentiment
How am I looking to trade?
Currently have put protection on everything with extra 10-50% more pus for shares, we also have SPY long puts and put spreads in play
www.myhurleyinvestment.com = Blogsite
customerservice@hurleyinvestments.com = Email
Questions???
Buy these ‘free cash flow favorites’ as the S&P 500 prepares to test the June lows
PUBLISHED FRI, SEP 23 20229:20 AM EDTUPDATED 38 MIN AGO
As investors prepare for equities to possibly retest their lows of the year, Evercore ISI has lowered its target on the S&P 500 and said traders should look to buy shares of companies with strong cash flow.
Markets have tumbled this week on fears the Federal Reserve’s commitment to aggressive rate hikes through the rest of this year will tip the economy into a recession. The major averages ended Thursday at their lowest levels since they fell to their lows of the summer. The S&P 500 fell to about 3,757, about 3% above its June low of 3,636.
“Within the context of a 3,975 target, we expect a full retest of the June low in the coming weeks before September/October volatility seasonality yields to a year-end rally,” Evercore ISI senior managing director Julian Emanuel said in a note Thursday.
Evercore ISI analysts recommend “patient accumulation” of its collection of free cash flow favorites. The stocks on its list are geared toward value, have strong free cash flow and shareholder return profiles and lower volatility.
Here are 10 of the names:
EVERCORE ISI’S FREE CASH FLOW FAVORITES
| STOCK | TICKER | FCF YIELD LAST 12 MONTHS | SHAREHOLDER RETURN LAST 12 MONTHS |
| META PLATFORMS | META | 8.2% | 12.3% |
| BANK OF AMERICA | BAC | 19.5% | 8.1% |
| MARATHON PETROLEUM | MPC | 19.9% | 22.3% |
| CHARTER COMMUNICATIONS | CHTR | 10.1% | 26.2% |
| MARATHON OIL | MRO | 19.9% | 13% |
| LENNAR CORPORATION | LEN | 7.8% | 11.7% |
| SYNCHRONY FINANCIAL | SYF | 47.5% | 28.8% |
| NVR | NVR | 8.2% | 12.2% |
| GODADDY | GDDY | 7.5% | 9.6% |
| DELL TECHNOLOGIES | DELL | 9.6% | 12.7% |
Source: Evercore ISI
Synchrony Financial has generated a free cash flow (FCF) yield of 47.5% over the past 12 months and a shareholder return of 28.8% over same period. Its share price is down about 36% this year. Bank of America has a FCF yield of 19.5% and shareholder return of 8.1%.
Both Marathon Oil and Marathon Petroleum screened well, with FCF yield of almost 20%, and shareholder returns over the past 12 months of about 13% and 22%, respectively.
GoDaddy and Dell Technologies are among the smaller names by market cap on the Evercore ISI list. GoDaddy’s free cash flow yield is about 7.5% while Dell’s is 9.6%.
Meta Platforms and Charter Communications are also in the group, along with homebuilders Lennar and NVR.
Bond market plunge means the low for stocks is not in yet, Bank of America’s Hartnett says
PUBLISHED FRI, SEP 23 202211:51 AM EDTUPDATED 40 MIN AGO
Jeff Cox@JEFF.COX.7528@JEFFCOXCNBCCOM
Pressure in the bond market is also exacting a toll on stocks, which look likely to go still lower from here, according to Bank of America’s top strategist.
In normal times, investors seek the safe haven of fixed income when stocks are falling. That means rising bond prices and a corresponding fall in yields.
However, with central banks rapidly raising rates to control inflation, fears of a recession are rising and making all assets toxic for investors these days. Treasury yields in the U.S. surged again Friday, with the 2-year note, which is most sensitive to Federal Reserve rate hikes, jumping 7.4 basis points to 4.2% around noon ET.
“Inflation/rates/recession shocks are not over, plus bond crash in recent weeks, means highs in credit spreads, lows in stocks are not yet in,” Michael Hartnett, Bank of America’s chief investment strategist, wrote in his weekly note analyzing the flow of money through markets.
As consumer and producer prices rise and the Federal Reserve and its global counterparts react, the “new regime of higher inflation means secular view remains cash, commodities, volatility to outperform bonds & stocks,” he added.
The stock market Friday was on its way to another losing week following a mid-summer rally. The S&P 500 has fallen more than 4.5%, while the Nasdaq 100, whose tilt toward tech stocks makes it particularly vulnerable to higher rates, also was down more than 4%.
Bank of America’s main sentiment indicator is “deeply bearish,” Hartnett wrote, though that still hasn’t translated into a contrarian buying point.
As a prescription for when investors may find opportunities, Hartnett offers: “Nibble at 3600 SPX, bite at 3300, gorge at 3000.” That would translate into respective S&P 500 losses from Thursday’s close of 4.2%, 12.2% and 20.2%. The index already has lost more than 22% this calendar year.
The cautionary tone comes as other Wall Street houses also are lowering expectations. Goldman Sachs on Thursday cut its S&P 500 target to 3,600 and warned that things could get worse if Fed rate hikes result in a “hard landing” for the economy. In that case, Goldman says the index could fall 16% from current levels.
Hartnett indicated that policy uncertainty remains a problem.
While central banks are tightening, fiscal authorities in the U.S., UK and elsewhere are continuing to provide stimulus, offsetting the inflation-fighting benefits of higher rates.
“Investors want policy coordination & policy credibility, and until they get it are likely to press shorts,” Hartnett said.
Is it time to buy Treasurys? Here’s how to allocate your portfolio, according to the pros
The latest threat to stocks now isn’t any macro risk — it’s rising 2-year Treasury yields, according to some fund managers and strategists.
Short-term, relatively risk-free Treasury bonds and funds are back in the spotlight as the yield on the 2-year Treasury continues to surge. On Wednesday, it reached 4.1% —the highest level since 2007. As of Thursday during Asia hours, it pushed higher to 4.124%.
“The new headwind for stocks is not just about inflation, potential recession, or even declining earnings estimates, but from the ‘competitive threat’ that rising interest rates makes bond yields more attractive,” John Petrides, portfolio manager at Tocqueville Asset Management, told CNBC.
“For the first time in a long time, the TINA market (There Is No Alternative to stocks) is no longer. Yields on short duration bonds are now compelling,” he said.
Michael Yoshikami, founder of Destination Wealth Management, agreed that bonds had become a “relatively compelling alternative” and could prove to be an “inflection point” for stocks.
While Mike Wilson, Morgan Stanley’s chief U.S. equity strategist, said that bonds offer stability in today’s volatile markets.
“While Treasury bonds do run the risk of higher inflation [and the] Fed reacting to that, they do offer still a safer investment than stocks for sure,” he told CNBC’s “Squawk Box Asia” Wednesday. “To be honest, I’ve been surprised we haven’t seen a greater flight to that safety already, given the data that we’ve seen.”
Data from BlackRock, the world’s largest asset manager, shows that investors have been piling into short-term bond funds. Flows into short-end bond ETFs are at $8 billion so far this month — the largest short-end bond inflows since May, BlackRock said Tuesday. Meanwhile, U.S.-listed short-term Treasury ETFs have attracted $7 billion of inflows so far in September — six times the volume of inflows last month, BlackRock said.
It comes as stocks have struggled, with S&P 500 down around 4% so far this month.
How to allocate
So should investors be fleeing equities and piling into bonds? Here’s what analysts say about how to allocate your portfolio right now.
For Tocqueville Asset Management’s Petrides, the traditional 60/40 portfolio is back. This sees investors put 60% of their portfolio in stocks, and 40% bonds.
“At current yields, the fixed income allocation of a portfolio can help contribute to expected rates of returns and help those looking to get yield from their portfolio to meet cash flow distributions a possibility,” he said.
Here’s a look at how Citi Global Wealth Investments has shifted its allocations, according to a Sept. 17 report:
Trump-linked Digital World Acquisition Corp shares are now around $16 after hitting $97 earlier this year
KEY POINTS
- Shares of Digital World Acquisition Corp. fell this week as the company missed a key deadline to hold on to about $1 billion in financing.
- DWAC, which is a special purpose acquisition company, or SPAC, has been set to be the vessel to take Trump Media and Technology Group public.
- At its 2022 peak, DWAC’s stock traded at $97. Now, its share price sits around $16.
Shares of Digital World Acquisition Corp. fell this week as the company missed a key deadline to hold on to about $1 billion in financing for its proposed merger with former President Donald Trump’s media company.
DWAC, which is a special purpose acquisition company, or SPAC, has been set to be the vessel to take Trump Media and Technology Group public. But the deal with Trump’s firm has run into several financial and legal obstacles.
At its 2022 peak, DWAC’s stock traded at $97. Now, its share price sits around $16 as markets slide, the appetite for SPACs dries up and Trump faces mounting legal peril. The stock fell about 3% Friday.
DWAC secured $1 billion in financing from private investors in public equity, also known as PIPE, which would fund Trump Media after the merger. However, Tuesday marked the expiration of these investors contractual obligations to the deal, allowing them to pull their funding.
Late Friday, DWAC disclosed in a regulatory filing that, between Monday and Friday, it received termination notices from PIPE investors representing about $138.5 million of the financing.
PIPE investors are given convertible preferred shares, which can be transferred into common stock at a discount. By converting and selling these shares, these investors also have the power to significantly dilute the holdings of other investors including former president Trump.
Trump Media, DWAC and the PIPE investors didn’t immediately return a request for comment.
Losing the $1 billion in financing is far from the only woe facing this deal and its involved parties. The merger is under investigation by the Securities and Exchange Commission for possible securities violations involving discussions about a deal prior to the merger announcement. The Justice Department is also probing the deal.
In addition, Trump himself is facing mounting legal pressures. A lawsuit alleging widespread fraud from New York Attorney General Letitia James is just another in an already sizable pile of legal actions against the former president. The former president is simultaneously under investigation for the removal of sensitive documents from the White House, his role in the Jan. 6, 2021, Capitol riot, and his push to overturn 2020 election results.
His Truth Social app, which was founded after the ex-president was banned from Twitter after the events of Jan. 6, is currently barred from the Google Play store for violating Google’s content moderation policies. Google and Truth Social said this week they were still working on a solution.
If the merger does go through, it would provide about $300 million to Trump’s media firm without the $1 billion in PIPE investments. But even to get that $300 million will require navigating several more hurdles.
DWAC needs to buy more time to get shareholders to approve delaying the merger by up to a year. DWAC CEO Patrick Orlando made a $2.8 million deposit to extend the merger deadline to December. A shareholder vote is required for the yearlong extension the company is aiming for, but DWAC has been unable to rally its many retail investors to approve the extension thus far. The next shareholder meeting is scheduled for Oct. 10.
Amid these mounting pressures, Trump Media issued a statement saying it would pursue legal action against the SEC for unduly obstructing the deal, blaming the “weaponization and politicization” of the Securities Exchange Commission.
“This inexcusable obstruction, which directly contradicts the SEC’s stated mission, is damaging investors and many others who are simply following the rules and trying to expand a successful business,” Trump Media said.
Feared stock market bottom retest is now underway
Michael Santoli@MICHAELSANTOLI
It has not paid to overthink the market situation this year, or to dismiss the time-faded book of Wall Street maxims.
“Don’t fight the Fed” is most of what an investor has needed to know to set properly grim expectations for stock and bond returns — especially with a Federal Reserve so pugnacious in attacking inflation while welcoming economic injury.
All the historical-pattern work ahead of time showed stocks suffer more in fast Fed tightening cycles than gradual ones, and this one has been the most rapid in decades, furnishing diversified investors with a 23% gut punch in the S&P 500 and negative 14% total return in the Barclays Aggregate Bond Index.
Other rules of thumb that have held up: Markets in downtrends under their 200-day moving average feature fleeting, failed rallies, and stocks’ typical weakness in September tends to occur in the second half of the month.
All these hostile conditions remain in place, reinforced by government-bond yields globally rushing to decade-plus highs, real inflation-adjusted yields crossing deep into restrictive territory for economic growth and risk-taking and the U.S. dollar rampaging skyward.
Still, even selling stampedes can overshoot and eventually exhaust themselves, at least for a while. Valuations eventually adjust to dimmer realities through a combination of lower prices and passing time. And investor attitudes can tilt too far toward pessimism, even if foul tempers are the only fair response to grueling investing conditions.
Guide to market retests
Which brings us to another weathered Wall Street playbook, the guide to retests of a previous market low, suddenly relevant after last week’s near-5% slide in the S&P 500 took it below its previous June 16 closing low midday Friday before a partial recovery left it slightly above.
It’s not exactly a scientific exercise, given that a successful retest in advance is pretty indistinguishable from the start of a fresh down leg, with only the strength and breadth of the next rally hinting at which it is.
By Friday the tape certainly was flashing some oversold extremes, shades of the “so bad, it’s good” setup that preceded the powerful but ultimately short-lived June-to-August rally. The McClellan Oscillator, a longstanding indicator tracking a running tally of advancing-vs.-declining stocks, hit lows only exceeded twice in the past five years, the last time during the early-2020 Covid crash. It suggests a good bounce, at least, isn’t far off in time.
Only about 17% of S&P 500 stocks are above their 200-day average, a fairly extreme reading seen only a few times in the past few years, though at the June index low this number got down to 10%.
At 23% off its record high, the S&P 500 is right at the average bear-market decline in times when no economic recession has occurred. Under recession scenarios, the typical drop has stretched to 30%, with obvious downside overshoots in times of global credit crisis (post-2007) or generational bubble implosion (2000).
Two years gone
For sure, the prospect of a recession of at least modest depth has become more rather than less likely with interest rates growing restrictive, the Conference Board Leading Economic Indicators rolling over, the housing market wheezing and the Fed apparently poised to “err on the side of erring” by tripping the economy into a retrenchment.
If the S&P 500 were to find itself within a few weeks in the vicinity of the year-to-date lows around 3650, down a percent from here, it would place the index at a level it first reached two years earlier. This is not a textbook indicator of any sort. But a fair number of downturns over the past dozen years have run their course around when the index had given up two years’ worth of gains, such as late 2018, early 2016 and in the fall of 2011.
Two years of nowhere
Truist Advisory Services co-chief investment officer Keith Lerner on Friday tempered his broadly cautious market stance a bit in noting the S&P had fallen around 15% in five weeks, suggesting “it doesn’t make sense to pile on to the negativity in the short term and become even more defensive after a large selloff has already occurred.” To remain or turn aggressively bearish for a trade here is to bet on some kind of financial accident or stress event – surely possible with the high-velocity asset-market moves but hard to handicap with any precision. Whatever one’s favorite bear-case downside target for the S&P 500 — 3400 and 3200 are pretty popular ones right now — it’s worth remembering the index tends not to spend a lot of time in the area of whatever the ultimate low ends up being, and the news will still be bad at the eventual bottom. In other words, the lack of any visible “all clear” moment right now isn’t itself some clinching argument for much deeper losses in stocks. Sentiment too negative? It’s an unscientific survey and a small sample size, but the number of bearish respondents to the American Association of Individual Investors weekly poll popped above 60% for the fifth time in its 35-year history. The four other times came in pairs, two in 1990 and two in the 2008-2009 bear-market climax phase. The first 60% reading was not at the decisive market low, though a year after each of them stocks were higher. For longer-term portfolio builders, lower prices mean better future returns – eventually. Lerner went back to track whether it has made sense in the past to buy the S&P 500 once it has dropped 20% from a record high.
Of the nine prior instances since 1950, the short-term results were quite mixed, with positive index returns six months later only 60% of the time and some big further losses in 2008. A three-year time horizon puts odds in a buyer’s favor after a 20% decline, up every time but once with an average total index gain of 29%.
Are equities still “too expensive” with bond yields here, the 10-year near 3.7%? The S&P index, maybe, at just under 16-times forecast profits, with some cross-asset models saying it should be perhaps two multiple points cheaper.
Yet it remains mostly the very largest handful of stocks inflating the aggregate P/E. Outside of the five largest S&P 500 names (Apple, Microsoft, Alphabet, Amazon and Tesla), the rest of the index is closer to a 14 multiple, with the equal-weighted S&P around 13.
I looked at a selection of blue-chip stocks’ forward price/earnings ratio last week compared to prior times in the past 20 years (in 2018, 2011, 2008, 2003) when the 10-year was at about today’s level. Names such as JP Morgan, Home Depot, UPS and Merck are all in line with, or lower than, their valuations from those earlier periods. The median stock in the market is in the region of fair value, even as the earnings path looks challenged — and granting that “fair” is not the same as “cheap.”
None of these observations amounts to a green light and flat open road ahead for investors. Monetary tightening is happening at warp speed and the global risk-free rate has radically repriced to lift the hurdle rate for all economic and investing endeavors. Corporate profit margins are stressed. The three-year S&P 500 total return is still 9% annualized, meaning the bear hasn’t yet really cut into muscle for longer-term investors.
Yet after this coming week, seasonal factors start to improve fast through Election Day, gasoline futures are at an eight-month low, the two-year Treasury yield looks overstretched and due for a pause, and “peak inflation” is a process deferred but not yet denied. We’ll see how this all plays into the feared market retest now underway.
Why are rents increasing? Rent surged in expensive housing market
By Katie McKellar, Deseret News | Posted – Sept. 24, 2022 at 8:47 p.m.
SALT LAKE CITY — Jennifer Fei, 48, has felt the pinch every year. But over the past couple of years, especially, the rental market’s stranglehold on her household budget has been tightening.
She moved into a quaint, two-bedroom duplex in the Sugar House neighborhood of Salt Lake City roughly seven years ago. At the time, her monthly rent was $1,300, which she said seemed like a pretty good deal.
“Over the years, there have always been increases — $100 here, $50 there,” Fei told the Deseret News. When she signed her lease for 2020 to 2021, it went up by $150.
Then, for 2022, it shot up $410, she said.
“Just within two years, I saw like a $550 increase in rent,” she said. “So it’s pretty significant.”
Now, Fei says her rent sits at just below $2,000 a month.
Meanwhile, her wages remain stagnant. As a sales representative, Fei said she earns about $60,000 a year. During the height of the COVID-19 pandemic, she said she made less as the pandemic took a toll on her commission, which she earns from selling products to retailers and restaurants.
As a single mother of two teenage children who makes what she considers a “decent” income, it’s frustrating that rent would be so expensive for a modest, two-bedroom home — especially considering wages haven’t kept nearly in pace with such rapid price growth.
Still, she feels trapped. Looking around her, in her same neighborhood, Fei has watched prices balloon. The typical two-bedroom apartment in her area “starts at $2,000 a month,” she said. “Most are $2,500 to $3,000 a month, especially in all these new apartments.”
“Who is affording this?” she questioned.
Utah’s median individual income was $31,855 in 2020, according to the U.S. Census Bureau. For households, it was $74,197.
Why are rent prices so high?
As housing prices in Utah and across the nation ramped up to record levels during the pandemic housing frenzy from mid-2020 until early 2022, it’s had an extraordinary impact on the rental market.
If renters — who faced steady, yearly rent hikes even before the pandemic stomped on the accelerator — were having a tough time before, the pressure is only mounting now as the housing market continues to reel from over 6% mortgage rates.
Even before the Federal Reserve’s fight with inflation, rents rose at faster rates over the last two years than they have in the past decade.
Between 2010 and 2020, asking rents ticked up by 2.6% annually. Fast forward to between 2020 and 2022, and rents rose 10.5% annually in that two-year window.
That’s according to a new report published this week by the University of Utah’s Kem C. Gardner Policy Institute, penned by Dejan Eskic, a senior research fellow a the institute and one of Utah’s leading housing experts.
By Eskic’s calculations, about 71% of Utah households were priced out of Utah’s median-priced home by the spring of 2022, which crossed the $500,000 mark in February. That figure was even higher in Salt Lake and Utah counties.
As more would-be buyers turn away from the market amid still record high home prices and mortgage rates not seen since 2008, that’s upping the pressure on the rental market.
“The narrowing path to homeownership has increased the demand for rental housing,” Eskic wrote. “Renter households across the Wasatch Front experienced as much rental price growth in two years (between 2020 and 2022) as they did in the prior 10 (between 2010 and 2020).”
As a result, renters trapped between rising rent prices and out-of-reach home prices are stuck, vulnerable to annual rate hikes and potential instability if they’re priced out of their current homes.
How much is rent in Utah?
Out of all four Wasatch Front counties, Salt Lake County saw the largest change in absolute growth in rent, according to the report.
- In Salt Lake County, the average asking rent grew from $1,213 in early 2020 to $1,534 in the second quarter of 2022, according to the report. That’s a $321 jump — an 11% increase each year, amounting to an over 26.4% hike in two years.
“The two-year increase is greater than the increase of $135 experienced between 2000 and 2010 and the $213 increase between 2010 and 2020,” Eskic wrote.
- Davis County comes next in line in terms of absolute growth in rent, with an average rent that increased by $294 from $1,158 in early 2020 to $1,452 in 2022. That’s an annual increase of 10.6%.
- Weber County ranked third in absolute rent growth, with an average rent that went up from $1,091 in early 2020 to $1,380 in 2020, a $289 increase at an annual rate of 11%.
- Utah County rents increased from $1,213 in 2020 to $1,475 in 2022, an annual rate of 9.1%.
Trapped
Fei wonders how long she can hang on to her current home, seeing downsizing as perhaps her only option at this pace.
“Next year, if my landlord decides to raise rent, I might have to move into a one-bedroom. That’s the reality of my finances,” she said. “If I’m not making more money, I can’t afford to stay here.”
She’s thought about owning, but as a single mother her age and prices being what they are, she doesn’t see that as an option.
“I’m at a point now where I think I am permanently priced out of the market,” Fei said. “I’m old enough, with teenage kids, don’t have enough savings … if I don’t have real estate at this point, at 48 years old, I’m not going to. I mean, to be very honest.”
She questioned how anyone is able to save for a home down payment these days, especially given how fast rent prices have climbed.
“I don’t know how you can save when rent is 40% to 50% of your monthly income,” she said. “If I were in a better financial situation, yeah I’d be looking. But at this point with interest rates and monthly payments, you’re looking at paying as much as rent these days.”
Fei also said her situation could be worse. She said while she’s facing downsizing, other Utahns and their families may be simply priced out of rentals everywhere in the Salt Lake area. It’s not just monthly rental costs, but also deposits — first and last month’s rent — that break the bank.
Fei said that as she was driving down the street the other day, she noticed someone who had a dining table and chairs on a dolly, along with a pile of his stuff next to him.
“These homeless people aren’t homeless because they have, you know, mental health issues or drug issues,” she said. “They’re homeless because they get to a point where they can’t afford where they live, and they have nowhere else to go.”
Tech stocks just had their worst two-week stretch since the start of the pandemic
KEY POINTS
- The Nasdaq Composite has dropped more than 5% in consecutive weeks, leaving the tech-heavy index in the red for the third quarter.
- Technology stocks rallied to start the quarter, but persistent inflation and cautionary commentary from the Federal Reserve dampened that enthusiasm.
- Tech companies that had experienced more than a decade of consistent growth are now signaling cutbacks.
What started off as a third-quarter rebound has turned into a flop for tech investors.
The Nasdaq Composite tumbled 5.1% this week after losing 5.5% the prior week. That marks the worst two-week stretch for the tech-heavy index since it plunged more than 20% in March 2020 at the start of the Covid-19 pandemic in the U.S.
With the third quarter set to wrap up next week, the Nasdaq is poised to notch losses for a third straight quarter unless it can erase what’s now a 1.5% decline over the final five trading days of the period.
Investors have been dumping tech stocks since late 2021, betting that rising inflation and higher interest rates would have an outsized impact on the companies that rallied the most during boom times. The Nasdaq now sits narrowly above its two-year low set in June.
Markets were hammered by continued rate raising by the Fed, which on Wednesday boosted benchmark interest rates by another three-quarters of a percentage point and indicated it will keep hiking well above the current level as it tries to bring down inflation from its highest levels since the early 1980s. The central bank took its federal funds rate up to a range of 3%-3.25%, the highest it’s been since early 2008, following the third consecutive 0.75 percentage point move.
Meanwhile, as rising rates have pushed the 10-year Treasury yield to its highest in 11 years, the dollar has been strengthening. That makes U.S. products more expensive in other countries, hurting tech companies that are heavy on exports.
“This is a one-two punch on tech,” Jack Ablin, Cresset Capital’s chief investment officer, told CNBC’s “TechCheck” on Friday. “The strong dollar doesn’t help tech. High 10-year Treasury yields don’t help tech.”
Among the group of mega-cap companies, Amazon had the worst week, dropping close to 8%. Google parent Alphabet and Facebook parent Meta each slid by about 4%. All three companies are in the midst of cost cuts or hiring freezes, as they reckon with some combination of weakening consumer demand, tepid ad spending and inflationary pressure on wages and products.
As CNBC reported on Friday, Alphabet CEO Sundar Pichai faced heated questions from employees at an all-hands meeting this week. Staffers expressed concern about cost cuts and recent comments from Pichai regarding the need to improve productivity by 20%.
Tech earnings season is about a month away, and growth expectations are muted. Alphabet is expected to report single-digit revenue expansion after growing more than 40% a year earlier, while Meta is looking at a second straight quarter of declining sales. Apple’s growth is expected to come in at just over 6%. Expectations for Amazon and Microsoft are higher, at about 10% and 16%, respectively.
The latest week was particularly rough for some companies in the sharing economy. Airbnb, Uber, Lyft and DoorDash all suffered drops of between 12% and 14%. In the cloud software market, which soared in recent years before plunging in 2022, some of the steepest declines were in shares of GitLab (-16%), Bill.com (-15%), Asana (-14%) and Confluent (-13%).
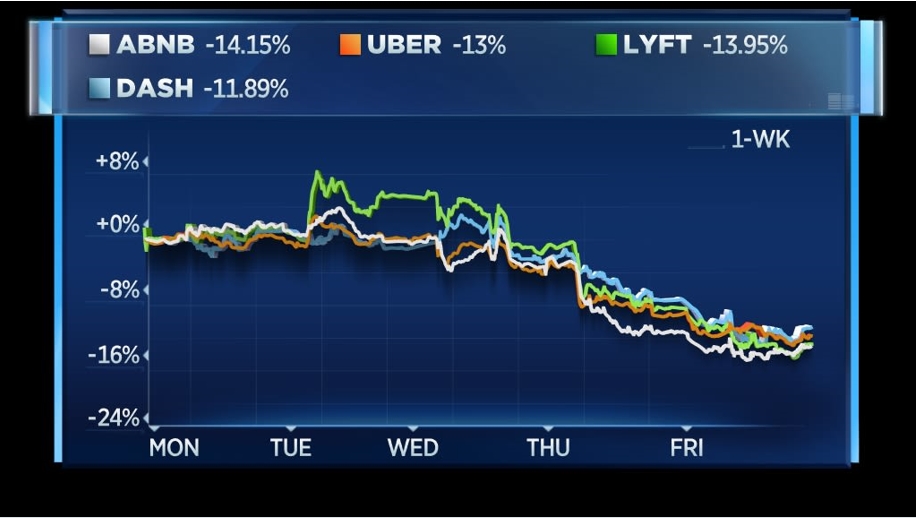
Sharing economy stocks this week
CNBC
Cloud giant Salesforce held its annual Dreamforce conference this week in San Francisco. During the portion of the conference targeted at financial metrics, the company announced a new long-range profitability goal that showed its determination to operate more efficiently.
Salesforce is aiming for a 25% adjusted operating margin, including future acquisitions, Chief Financial Officer Amy Weaver said. That’s up from the 20% target Salesforce announced a year ago for its 2023 fiscal year. The company is trying to push down sales and marketing as a percentage of revenue, in part through more self-serve efforts and through improving productivity for salespeople.
Salesforce shares fell 3% for the week and are down 42% for the year.
“There’s so many things happening in the market,” co-CEO Marc Benioff told CNBC’s Jim Cramer in an interview at Dreamforce. “Between currencies and the recession or the pandemic. All of these things that you’re kind of navigating many forces.”
There is a serious question as to why the Western press has been putting out nothing but one-sided propaganda. I have been warned that my sources in Russia are concerned that the hardliners behind the scene have been critical of Putin for NOT being more aggressive. Of course, there is the youth protesting over the war and the Western press has been happy to project only that image.
Today, for the very first time, the New York Times has actually reported what I have been reporting for weeks:
“Powerful, well positioned and ideologically committed, they want a much more aggressive war effort. “

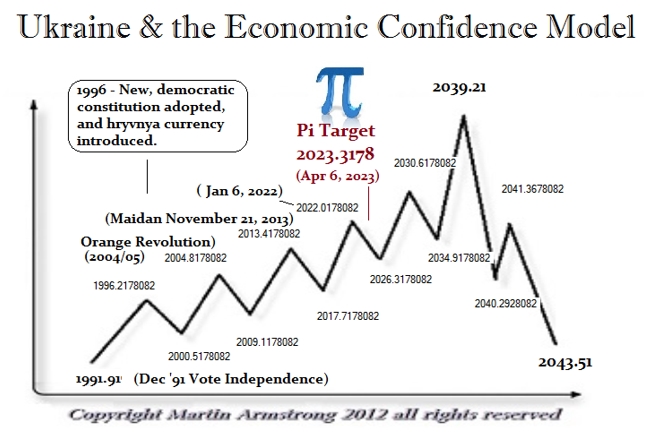
I am concerned that if Putin is overthrown, the propaganda of the Western press makes it sound like everything will be back to normal. That is so far from the truth, it is not even funny. The Pi Target from the fall of the Soviet Union will be April 6th, 2023. Zelensky stood up on February 23rd, 2022 and said he wanted to restore nukes in Ukraine in direct violation of all the agreements since 1991. The next day Putin invaded.

John McCain was there at Maidan promising US support to overthrow Yanukovich and to create a revolution against Russia. It was John McCain who was pushing to fund the proxy way against Putin in 2014. In December 2016 after Trump was elected, he traveled to Ukraine promising military support to wage war on Russia backing the neo-nazis. Trump rejected that and that is why McCain hated Trump. McCain has been pushing war with Russia all along. It was the US-installed “interim” government in 2014 that began the civil war attacking the Donbas and the Minsk Agreement was brokered by Germany and France to allow the Donbas to vote on their separation from Ukraine. Zelensky has refused to recognize that agreement.

Zelensky promised peace and the end of corruption. He has done the exact opposite. He rejected Henry Kissinger’s advice to let the Donbas vote. Zelensky would rather destroy his entire country than yield “one inch” to Russia.
I am deeply concerned that if Putin falls for any reason, we are looking at significant risk and our computer’s forecast back in 2013 that Ukraine will be the hot sport, is exactly on track. Russia has its hawks just as we have had to endure John McCain who has supported endless wars for his personal vendetta. Despite his death, other has taken up the agenda and are working hard for war with Russia and the Hawks are doing in Russia and China right now. The smartest play they can make is to attack Taiwan and go fully into Ukraine simultaneously. The West is economically too weak to support a war on two fronts simultaneously. I cannot believe our world leaders are this stupid.
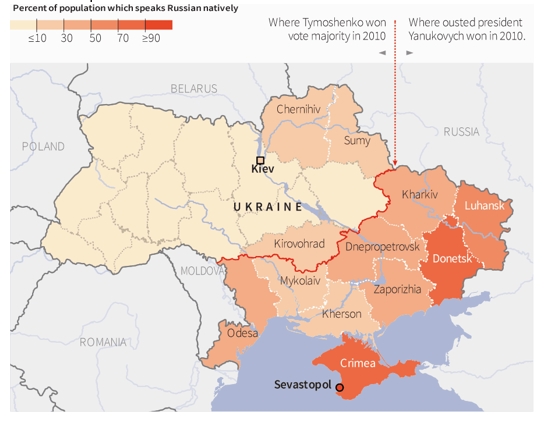
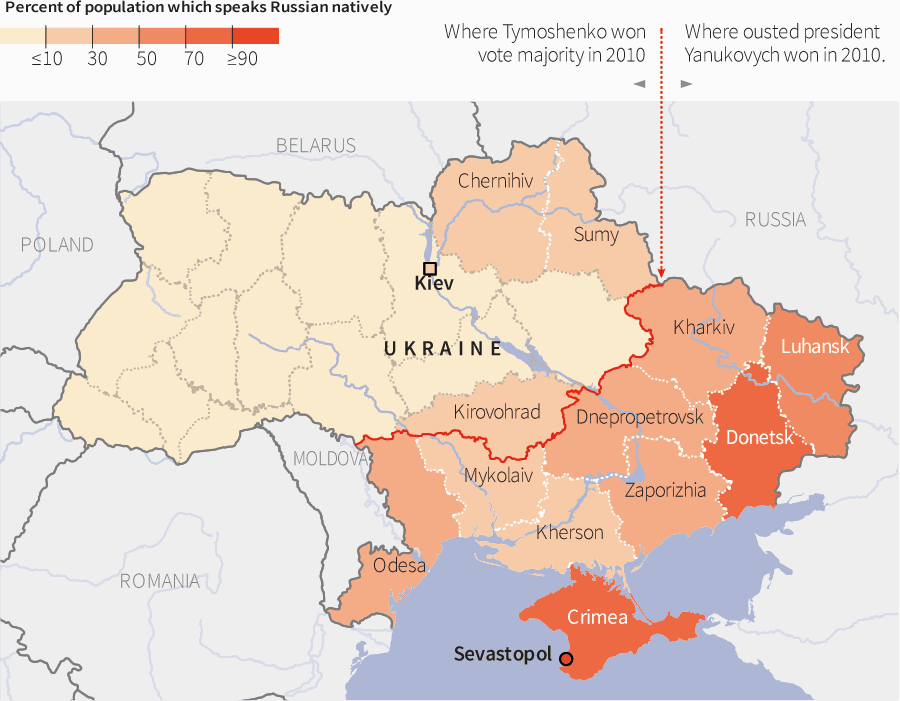
Allow the Donbas to vote and monitor it by independent observers from both sides. The people are predominantly Russia and they are Russian Orthodox, which Zelensky has also outlawed their religion. It will be hands down that they vote for their independence. The alternative is not something we really want to head into cheering for our own destruction on both sides.
HI Financial Services Mid-Week 06-24-2014