HI Market View Commentary 10-02-23
What are we looking at from September?
– Crappy down month as usual
– We did MUCH better than the market
– Enjoyed some nice profits on Puts
– Will this bearish trend in our market continue into October?
https://www.briefing.com/the-big-picture
There are certainly some "issues" out there to support the view that things should be
slowing down:
Student loan payments are set to resume October 1.
Oil prices are stubbornly high; and drivers continue to be saddled with high gas prices.
The U.S. government seemingly looks headed for a shutdown.
The disinflation momentum has slowed.
China's post-Covid economic recovery efforts have been sluggish and are being threatened
further by cracks in its property market.
The UAW is about to enter its third strike week against the Big Three automakers.
The Fed, ECB, Bank of England, and many other central banks all seem inclined to keep
rates higher for longer.
The lag effect of prior rate hikes has yet to show up in a meaningful way in a broad sense.
What It All Means
Alas, our intention this week is not to turn this piece into a discussion about economic
prospects. The intention is to turn it into a discussion about the stock market's
prospects.
Do we think the stock market is oversold on a short-term basis and due for a bounce?
Yes, we do.
Do we think the stock market can get back to its all-time highs in short order? No, we
do not. That is a big ask given the changing dynamics of the interest rate environment.
Higher rates don't necessarily have to be bad for the stock market, especially if they are
associated with stronger economic activity that is good for earnings prospects. Higher
rates become more problematic for the stock market, though, when they become the
basis for safety trades in an uncertain environment.
In other words, when there are risk-free, or nearly risk-free, alternatives offering
attractive income potential along with capital preservation, the willingness to step out
on the risk limbs of the stock market diminishes.
Why chase the possibility of a 5% rally in the stock market when you can stay parked in
a money-market fund, for instance, which yields 5.0%, or in a 3-month T-bill that yields
nearly 5.50%? The answer, we suppose, will come down to risk tolerances and
assumptions the stock market can do much better than that.
Truth be told, the stock market will do much better than that — in the long term. It's
the near term that is in question, and it is our expectation in this elevated period of
uncertainty about the near-term outlook that investors will seek more comforting
answers outside the stock market.
Why? Because they finally can again without feeling like they are getting nothing in real
return for playing it safe.
–Patrick J. O'Hare, Briefing.com
Earnings dates:
AAPL – 10/24 Est.
BA – 10/24 Est.
BAC – 10/17 Est.
BIDU – 11/20 Est.
CVS –
DIS – 11/6 Est.
F – 10/24 Est.
GE –
GOOGL – 10/23. Est.
JPM – 10/13 Est.
KO –
LMT –
LUV –
META- 10/24 Est.
SQ –
UAA – 11/1 Est.
V –
VZ –
MU-
Where will our markets end this week?
Lower to flat
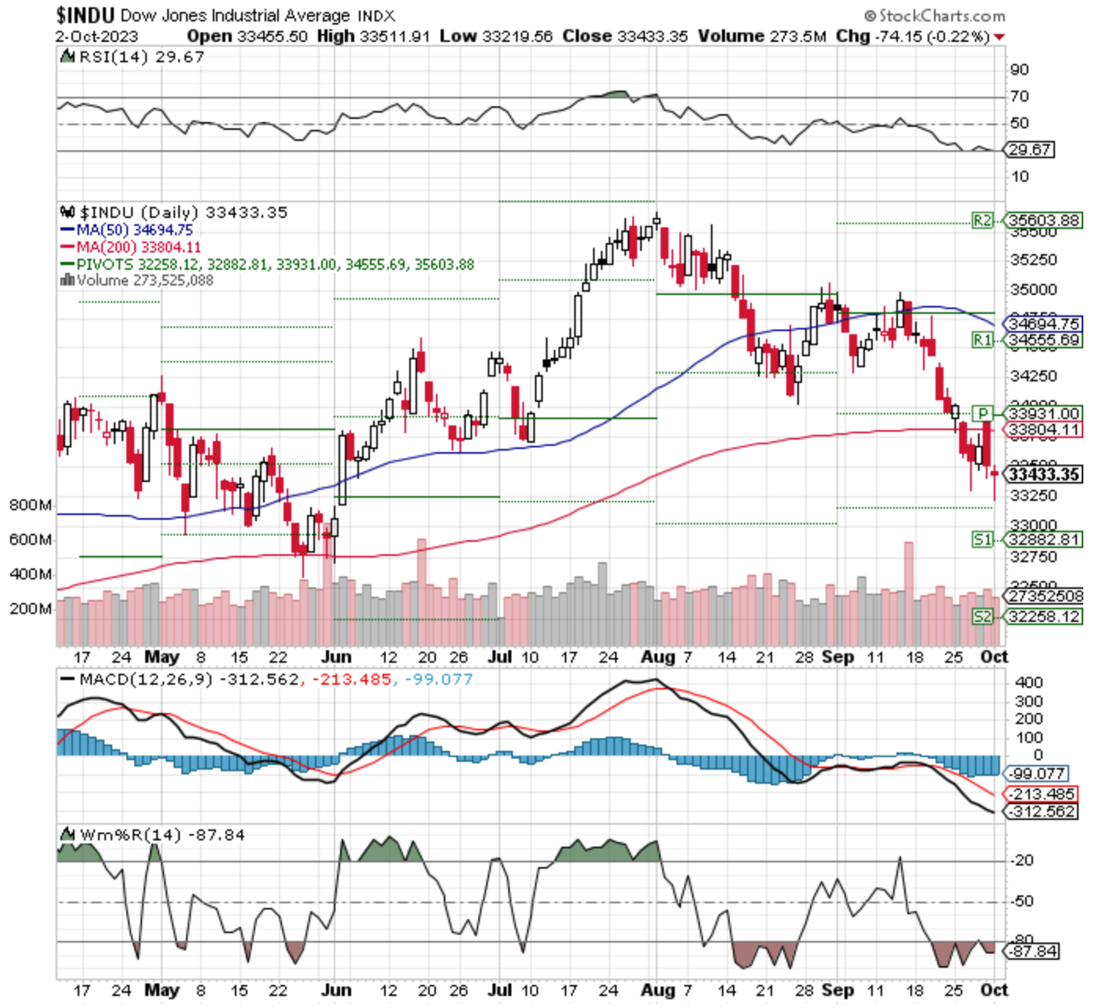
DJIA – Bearish
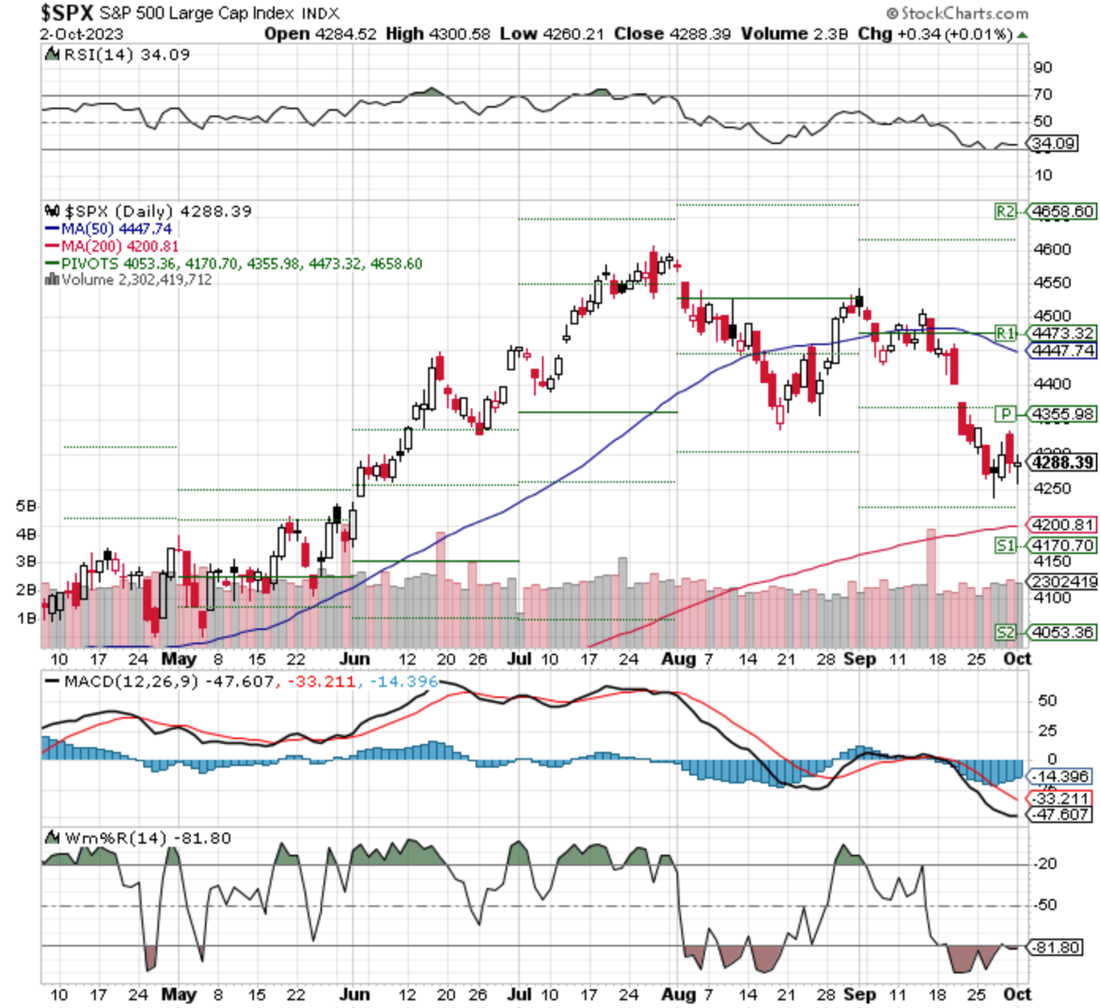
SPX –Bearish
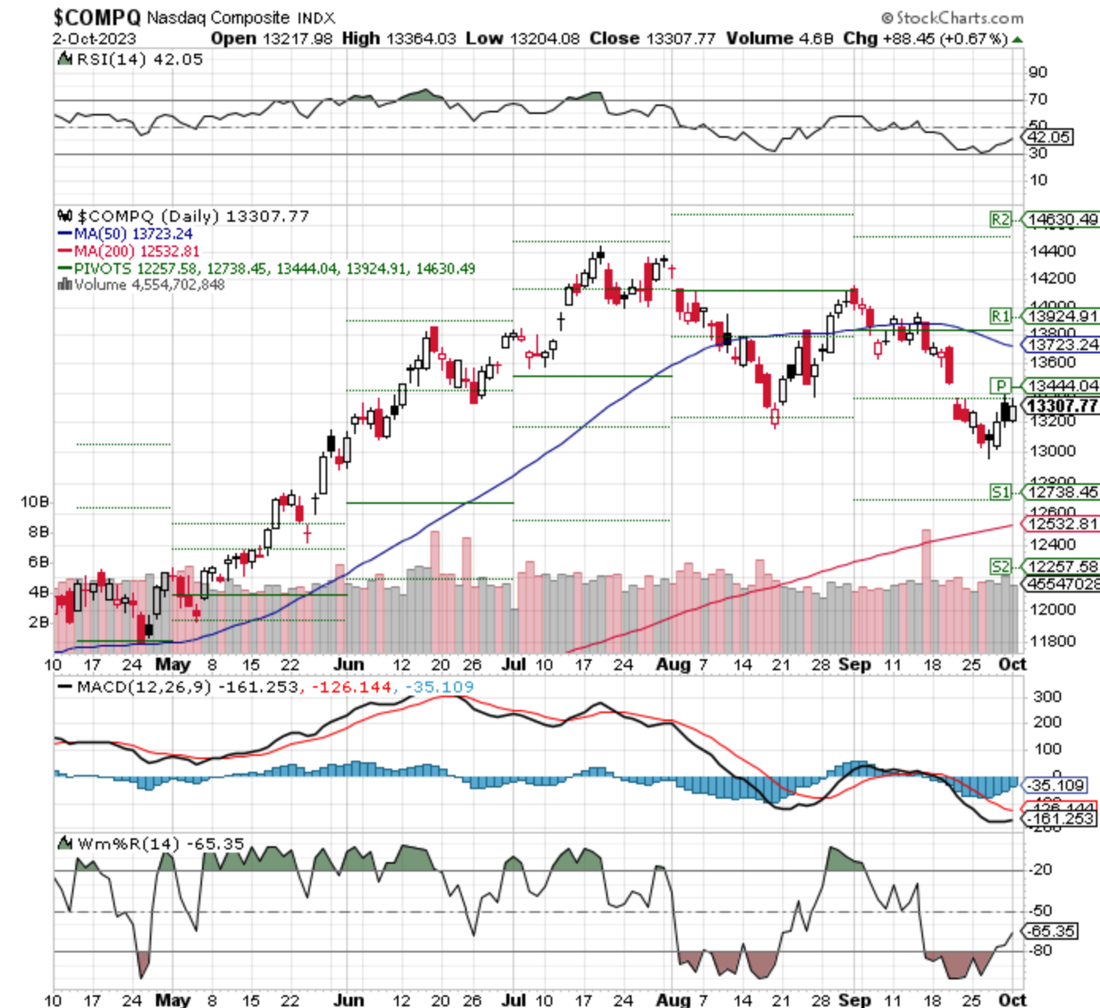
COMP – Bearish
Where Will the SPX end Oct. 2023?
10-10-2023 +1.0%
Earnings:
Mon:
Tues:
Wed:
Thur: LEVI
Fri:
Econ Reports:
Mon: ISM Manufacturing
Tue JOLTS
Wed: ISM Non-Manufacturing, EIA Crude Oil Inv.
Thur: Initial Claims, Continuing Claims
Fri: Payrolls, Unemployment, Ave. Workweek
How am I looking to trade?
Looking at individual stocks to decide where we can take some
profits on puts again.
www.myhurleyinvestment.com = Blogsite
info@hurleyinvestments.com = Email
Questions???
https://www.cnbc.com/2023/10/02/stock-markets-oversold-in-
september-bounce-in-october-
.html?__source=iosappshare%7Ccom.apple.UIKit.activity.Mess
age
What you need to know today
Bad quarter for markets
U.S. stocks were mixed Friday, with the Nasdaq Composite the only major
index to inch up. But all indexes fell for the quarter. Europe’s Stoxx 600
added0.38%, but likewise ended the quarter 2.9% lower — its worst quarterly
performance for a year. Meanwhile, euro zone inflation fell to 4.3% in
September, according to flash estimates. That’s the lowest annual figure since
October 2021.
PCE inched up
The personal consumption expenditure index for August rose 3.5% from a
year ago and 0.4% for the month. Stripping out food and energy, core PCE
increased an expected 3.9% and a lower-than-forecast 0.1% — the smallest
monthly increase since November 2020. The PCE is the Federal Reserve’s
preferred measure of inflation as it measures consumer behavior rather than
just prices.
Shutdown suspended
The U.S. Senate passed a last-minute spending bill Saturday, narrowly
avoiding a government shutdown. However, the bill merely allows the U.S.
government to stay open — and lawmakers to thrash out a more permanent
funding legislation — for 45 more days. The bill notably leaves out new
funding for Ukraine’s ongoing war with Russia.
Auto strikes expand
The United Auto Workers union expanded its strikes Friday, halting work at
another Ford plant and an additional GM Plant. That amounts to 6,900 more
autoworkers joining the roughly 18,300 already on strike. Stellantis was
spared from additional strikes, said UAW President Shawn Fain, because of
the company’s “significant progress” in negotiations with union members.
[PRO] Jobs week
This week’s all about the labor market. The Job Openings and Labor Turnover
Survey for August comes out Tuesday, giving an insight into how many
workers voluntarily left employment — a key indicator of employees’
confidence in finding a new job. And September’s jobs report will be released
Friday, showing if the jobs market is still tight, as recent data on jobless claims
have suggested.
The bottom line
Even a cooler-than-expected core PCE reading— an increase of just 0.1% for
the month! — couldn’t cheer investors.
Squeezed by September’s seasonality, stocks mostly fell Friday. The S&P
500 lost 0.27%, the Dow Jones Industrial Average fell 0.47%, but the Nasdaq
Composite climbed 0.14%.
All three indexes ended September in the red. The S&P was down 4.87% and
the Nasdaq fell 5.81% — both indexes’ worst monthly performance since
December. The Dow lost 3.5%, its worst showing since February.
When viewed on a quarterly basis, the numbers are actually better, indicating
how bad September was for stocks. The S&P retreated 3.65%, the Dow
declined 2.62% and the Nasdaq sank 4.12%, its biggest fall since the second
quarter of 2022.
A “deeply oversold condition is starting to develop,” Wolfe Research analyst
Rob Ginsberg said in a Thursday note. Just 15% of stocks are trading above
their 50-day moving average, said Ginsberg.
It’s an observation echoed by Adam Turnquist, chief technical strategist at
LPL Financial. Turnquist noted that the relative strength index of the S&P — a
measure of the momentum of stocks — slid to the lowest level in 12 months,
suggesting stocks reached oversold levels this week.
While being oversold doesn’t guarantee stocks will bounce, that condition
suggests stocks are cheap relative to their recent price range, making it
“easier for [stocks] to go higher,” Katie Stockton, founder and managing
partner at Fairlead Strategies, told CNBC. This might be a good time for
intrepid investors to wade into the waters.
After all, October’s historically a winning month for stocks, according to data
from the Stock Trader’s Almanac. Between 1950 and 2021, the S&P has
ended October 0.9% higher on average. Here’s hoping October brings some
relief to the scorching summer heat we’ve had to endure in markets.
https://tradethatswing.com/seasonal-patterns-of-the-stock-
market/
Best and Worst Months for the Stock Market –
Seasonal Patterns
September 28, 2023 Posted by Cory Mitchell, CMT Investing, Swing Trading Stocks
Info No Comments
See the best and worth months for stocks over the last 10 and 20 years.
Stock market seasonal patterns are the directional tendencies of stock indices based
on the time of the year. Certain times of the year tend to be more bullish (go up) for
stocks, while other times during the year are more bearish (go down). Seasonal patterns
are similar to trading chart patterns. Chart patterns are geometric shapes that form
within the price action and can be used to find favorable reward-to-risk trading
opportunities. Both chart patterns and seasonal price patterns are helpful tools that
traders can use to enhance their trading.
Seasonality is essentially an average, based on history, of how the stock market tends
to perform throughout the year. Averages are a guide, a tool, but don’t forecast with
accuracy what will happen this year. That said, some investors and traders may use
seasonal tendencies to build strategies or enhance existing ones.
For example, if we know September tends to be a poor month for stocks, a trader who
primarily takes long positions may opt to take this month off, or exit their positions
quicker than usual if they start to decline during the month of September. A trader could
buy stock index ETFs (such as SPY or IVV) during seasonally strong months if they start
rising. An investor may buy in and then sell out at certain times of the year (if feasible to
do so with commissions). Buy-and-hold investors may wish to invest during seasonally
weak months to take advantage of lower prices.
Seasonality can be used in many ways. Individual stocks, commodities,
and currencies also tend to have seasonal tendencies.
So let’s jump into the seasonal patterns of the stock market.
Seasonal Patterns – Best and Worst Months for the Stock Market, Summary Table
(20-year averages)
Up Months
Weak
Months Best 3 Months
Worst
Months
NYSE
Composite
March, April, May, July,
October, November, December
January,
February,
June,
August,
September April, July, November
January,
June
S&P 500
February March, April, May,
July, August, October,
November, December
January,
June,
September April, July, November January
Nasdaq 100
January, March, April, May,
July, August, October,
November, December
February,
June,
September April, July, October/November
June,
September
A full breakdown with monthly average gains and the percentage of time the month has
moved higher is provided below.
Stock Market Seasonal Patterns
This is how the stock market has performed in each of the months over the last 10 and
20 years.
The number at the top of the column is the percentage of time the stock index has
risen. If it says 70, that means the stock index went up in that month 14 years out of 20
(70%).
The number at the bottom of the column is the average percentage gain or loss in that
month over the 10 or 20 years.
To give you a better idea of the best and worst months of the year, we will look at three
major stock indices, the NYSE Composite, the S&P 500, and Nasdaq 100.
The NYSE Composite is all the stocks listed on the New York Stock Exchange so it’s a
very diverse stock index. The S&P 500 includes only the largest companies in the US,
and the Nasdaq 100 includes large companies that are primarily technology-based.
The Passive Stock Investing Using ETFs eBook shows how to invest using a buy-and-
hold strategy to compound money in the background—in good market conditions and
bad—with little effort, even while swing trading and day trading.
NYSE Composite Seasonal Patterns
Here is a summary of the NYSE Composite’s best and worst months over the last 20
years (2003-2022)
Best Months: April, July, October, November, and December
Worst Months: January, February, June, August, September
Seasonal charts courtesy of StockCharts.com.
The above chart looks at 20 years of data. If we only look at the last 10 years (below),
things change a little bit.
NYSE Composite best and worst months over the last 10 years (2013-2022)
Best Months: April, May, July, October, November, and December
Worst Months: January, February, June, August, and September remain
weaker periods.
S&P 500 Seasonal Patterns
Here is how the S&P 500 index has done. The SPDR S&P 500 ETF (SPY) was used to
generate the seasonality figures.
S&P 500 best and worst months over the last 20 years (2003-2022)
Best Months: February March, April, May, July, August, October, November,
and December
Worst Months: January, June, and September
Over a 10-year period, not much changes except that the market is pretty much strong
from February through to the end of August. September is weaker, and then the end of
the year tends to be strong.
S&P 500 best and worst months over the last 10 years (2013-2022)
Best Months: February, March, April, May, June, July, August, October,
November, December
Worst Months: January, September
For a different look, and to see how some actual years have played out, here are the
yearly charts of the S&P 500 (SPY) from 2013 to 2022. They are overlaid on top of each
other for each viewing.
Nasdaq 100 Seasonal Patterns
Here is how the Nasdaq 100 index has done. The Investco QQQ Trust (QQQ) was used
to generate the seasonality figures.
Nasdaq 100 best and worst months over the last 20 years (2003-2022)
Best Months: March, April, May, July, August, October, November, and
December
Worst Months: January, June, and September
This is the same as the S&P 500.
Below is what it looks like over the last 10 years. Not much changes.
Most months are pretty good.
Nasdaq 100 best and worst months over the last 10 years (2013-2022)
Best Months: January, March, April, May, July, August, October, November,
December
Worst Months: February, June, September
For a complete swing trading method, including scanning, stock selection, placing
trades, and taking profitable exits, see the Complete Method Stock Swing Trading
Course.
Stock Market Seasonality Considerations
Think of seasonality as a tool, not a crystal ball. It shows historical tendencies, not what
will happen this year.
If the market tends to rise 80% of the time in April, that means it went up in April 16
years of out the last 20, but it may not go up this year.
The average monthly return numbers can also be skewed by an extremely large fall or
rise in a particular year. So a 1% average return could be the result of a couple big drops
of 10% in certain years and big rallies of 10% in others. The average is near zero, but
investors should be aware that the average doesn’t tell the whole story.
Even during months that have a high probability of rising, stop losses and risk control
should be used, because if the price drops, we don’t know how far it will drop.
The US stock market has an overall upward bias over the long-term.
The S&P 500 has produced 10.5% yearly returns over the last 100 years.
The Nasdaq 100 has produced returns of 14.3% per year over the last 20 years.
Therefore, investors may consider using the weak months as entry points if looking to
take long-term positions.
Additional Stock Market Seasonal Patterns
There are a number of specific seasonal patterns in stocks that people have noticed
and tested. These tend to be shorter-term patterns.
Pre-Holiday Rally Pattern
It’s been noted that there’s a positive expectancy for buying stocks one to two days
before a long weekend/holidays and then selling one to two days after.
Trading volume tends to be lower heading into long weekends which may help explain
prices drifting up (there’s a long-term upward bias to the stock market). Or possibly
people are feeling good about a long weekend and buy some stock.
Short-term traders would buy one or two days prior to the holiday, and then sell one to
two days after the holiday. Longer-term traders can also take advantage and use the
one or two days prior to a holiday to pick up some stocks they were eyeing.
Actual testing reveals that most holidays don’t produce a big pop in stocks, but a few
are more reliable and tend to produce positive returns over time according
to QuantifiedStrategies :
July 4th
Thanksgiving
Christmas (discussed more below)
At least according to history, these are better holidays than others for deploying the pre-
holiday rally strategy.
Post-Holiday Rally Pattern
Buying on the close the day after the holiday and then selling on the next close has also
shown a steadily rising equity curve (according to QuantifiedStrategies).
Santa Claus Rally Pattern
This one is highly documented and generally quite profitable, yielding an average of
about 1.1% per trade in an index like the S&P 500. The strategy requires holding for the
last 4 to 5 days of the year and then selling two to three days into the new year. The
exact number of days can vary based on weekends and market closures. So utilize the
closest number of days you can.
According to Quantified Strategies, buying on the third Friday of December (before
options expiration) and selling on the close of the third trading day of January bumped
the average return up to 1.79% per trade.
Intraday Patterns
There are also intraday repeating patterns that play out, which are useful for short-term
traders and day traders.
Stock Market Seasonal Patterns Conclusion
Seasons patterns can be useful, but they can also be traps if we blindly follow them.
Risk management must always be used to control losses, yet that may also mean
getting out of some trades that would have otherwise been profitable if the favorable
seasonal statistics played out.