HI Market View Commentary 04-11-2022
This is a shorten week because…… Palm Friday, Good Friday
Expect a Wednesday or most likely Thursday sell off to not be in the market over the long weekend
Kevin on Monday you were bullish again and on a 0.97 market we were up 3.6%
On Wednesday We went to more protection on everything after adding some protection on Tuesday
IF I SAY something on Monday night TUESDAY morning might change the thought process
IF you still aren’t using simple level one of beginning trading knowledge you are just gambling in the market
Russian forces realigning and new general in charge = The Butcher of Syria
What is the problem if protection also is losing money on a down day on the stock?
Volatility Decrease, Greek catch-up,
Well Kevin IF you had some new money, all yours, where would you put it right now like Warren Buffett does?
Well Keve how much are you willing to lose before our bear market turns bullish again
Well Warren Buffett always puts his money to work
Earnings coming up:
AAPL 4/28 AMC
BA 4/27 BMO
BAC 4/18 BMO
BIDU 5/18 est
DIS 5/11 AMC
F 4/27 AMC
FB 4/27 AMC
JPM 4/13 BMO
KO 4/28 BMO
LMT 4/19 BMO
MU 6/30 est
SQ 5/05 AMC
TGT 5/18 BMO
UAA 5/03 BMO
USB 4/14 BMO
V 4/26 AMC
VZ 4/22 BMO
Kevin I’ve noticed that you always (RULE) roll your long puts to at the money (ATM) before earning even if the are deep in the money and will make up 90%+ on the way down
YES I want to make something IF the stock heads back up
https://www.briefing.com/the-big-picture
Last Updated: 08-Apr-22 15:35 ET | Archive
Don’t expect earnings estimate trend to remain the market’s friend
The forward 12-month P/E ratio for the S&P 500 is 19.2, but not really. It moves by the day based on the price (“P”) of the S&P 500 and revisions to earnings estimates (“E”). Hence, when you see this P/E ratio, consider it an approximate number.
Soon enough we will find out if investors think a market multiple of 19.2 is approximately too high, too low, or just right. Relative to the 5-yr average of 18.6 and the 10-yr average of 16.8, according to FactSet, it remains on the high side.
The tell will be the guidance coming out of the first quarter reporting period, which starts in the coming week with reports from Albertsons (ACI), CarMax (KMX), BlackRock (BLK), Delta Air Lines (DAL), Fastenal (FAST), Taiwan Semi (TSM), UnitedHealth (UNH), and a panoply of banks that includes JPMorgan Chase (JPM), Citigroup (C), Goldman Sachs (GS), Morgan Stanley (MS), PNC (PNC), U.S. Bancorp (USB), and Wells Fargo (WFC).
A Muddled Outlook
Thanks to the excellent work done by John Butters at FactSet, we know the following:
- The bottom-up EPS estimate for the first quarter has been cut to $51.73 from $52.21.
- The estimated earnings growth rate for the first quarter is 4.5% (versus 5.7% on December 31).
- Bottom-up EPS estimates have been increased for the second quarter (to $56.07 from $55.16), the third quarter (to $59.23 from $57.82), and the fourth quarter (to $60.59 from $58.31).
- Between December 31 and March 31, the CY22 EPS estimate has increased to $227.80 from $223.43.
- At the same time the bottom-up EPS estimate for CY22 has increased, so has the CY23 estimate (to $249.79 from $245.05).
In case you haven’t been following the market closely, the market is on recession watch, more so for 2023 than 2022, but nonetheless, a slowdown in 2022 is expected.
The basis for the slowdown is attributed primarily to rising interest rates, but there is a lot going on to muddle the growth outlook.
- Russia invaded Ukraine in late February, driving up costs for food, energy, and industrial metals, and in turn created a refugee crisis for Europe.
- China continues to pursue a draconian approach for containing COVID, leading to shutdowns of major Chinese cities that has further disrupted supply chain logistics.
- The Treasury yield curve has inverted with shorter-dated maturities yielding more than longer-dated maturities.
- Consumer confidence is slumping in the face of 40-year high inflation rates.
- Mortgage rates are rising (the 30-yr fixed rate topped 5.00% for the first time since 2011), which is reducing affordability for prospective buyers.
- Stock prices have dropped (sharply in many cases), eroding the wealth effect.
- Direct fiscal stimulus has been greatly reduced.
- The Federal Reserve has a median estimate for seven rate hikes this year, including the one it agreed to in March, and an emerging plan to start reducing the size of its balance sheet soon.
The fortunate news is that the labor market is still strong, nominal wages have risen appreciably (avg. hourly earnings were up 5.6% yr/yr in March), and there is still a lot of cash in savings accounts. Still, inflation-adjusted earnings are negative, and when talk of a possible recession swirls, consumers tend to become more reserved in terms of how they spend their cash.
In brief, there are more headwinds than tailwinds right now for the earnings outlook, which is why it is bewildering that CY22 and CY23 EPS estimates are still being revised higher.
Looking Energized
The energy sector deserves some credit for the upward revisions. We can see as much in the first quarter estimate.
The sector is expected to report a 252.7% yr/yr increase in earnings, which would compute to a contribution of 5.67 percentage points to first quarter earnings growth, according to FactSet.
In other words, the blended growth rate for the first quarter for the S&P 500 would be negative if the energy sector were excluded. Long-time readers of Briefing.com know we don’t like playing the exclusion game. With an index, it all counts.
It does go to show, however, how tough comparisons are factoring into this year’s mix of earnings estimates for the first quarter. In the same period a year ago, the blended earnings growth rate was 52.4% and the energy sector contributed just 0.75 percentage points to that growth.
For added perspective, the financial, consumer discretionary, communication services, and consumer staples sectors are expected to report year-over-year declines in first quarter earnings, meaning they will make a negative contribution to first quarter earnings growth. The first three sectors were some of the biggest contributors to earnings growth in the first quarter of 2021.
Margin Pressures Building
The financial sector will be front and center in the coming week. You won’t get much out of the banks in terms of specific earnings guidance (most likely, there will be none). You will hear the banks provide some direction on net interest margins and possibly loan growth.
Where the banks could grab the spotlight, though, is in their qualitative guidance about the economic outlook. That guidance could still tease some promise in the second quarter, yet we would expect it to sound more reserved as far as the outlook for the second half of the year is concerned.
If we’re right, that could set the tone for more guarded-sounding guidance in general this reporting period that shows on a more direct quantitative scale in the guidance that industrial, consumer discretionary, consumer staples, and information technology companies typically provide.
With everything going on in the world right now, and many central banks turning away from their ultra-accommodative policies to fight inflation, it’s a stretch to think most companies will be unabashedly optimistic about the full-year outlook.
To be sure, margin pressures are building with higher costs for labor, raw materials, packaging, and transportation.
Thus far, consumers have been fairly tolerant of price increases, yet the public narrative about high inflation is quite pronounced now, including the attention toward real earnings being negative. We think that will start to translate into more price resistance, meaning businesses will likely be seeing more of an impact on profit margins as many consumers, faced with elevated food, energy, and rent costs, look to avoid paying higher prices elsewhere.
What It All Means
Interest rates are headed higher, margin pressures are increasing, consumer confidence is flagging, the U.S. dollar is strengthening, and inflation pressures are all around. Somehow, though, that hasn’t equated to a decline in earnings estimates for the full year.
It would be a remarkable achievement indeed if S&P 500 companies kept earning their way through the building headwinds. Some will but we think more and more won’t — or at least not to the extent that is currently accounted for in aggregate earnings estimates.
It provides us some pause then to look at a market multiple that is above average when the number of earnings headwinds is also above average. The P/E ratio might have come down noticeably from where it was when the year began (21.3), but the “E” in the ratio for the next twelve months is at risk with a downside bias.
How that translates for the stock market will have a lot to do with just how much estimates come down and how that understanding impacts the “P.”
Prices typically follow the trend in earnings estimates, and at this juncture we don’t expect that trend to remain the stock market’s friend.
—Patrick J. O’Hare, Briefing.com
| https://go.ycharts.com/weekly-pulse |
| Market Recap |
| WEEK OF APR. 4 THROUGH APR. 8, 2022 |
| The S&P 500 index slipped 1.3% last week amid concerns about monetary tightening and upcoming Q1 earnings reports. The market benchmark ended Friday’s session at 4,488.28, down from last Friday’s closing level of 4,545.86. This puts the index in negative territory for the month of April to date after the S&P 500 just achieved its first monthly increase of 2022 in March. It is still down 5.8% for the year to date. Last week’s decline came amid jitters about the potential economic impact of the Federal Reserve’s Federal Open Market Committee undergoes a more aggressive monetary tightening plan than previously anticipated. Tuesday, Federal Reserve governor Lael Brainard said the central bank’s policy-setting committee will be “starting to reduce the balance sheet at a rapid pace as soon as our May meeting.” Wednesday, minutes released from the committee’s March meeting showed officials were considering raising rates by a half-point before they ultimately decided on a quarter-point increase. These were seen by investors as signs the Fed’s tightening plan may end up more aggressive than previously expected. The week’s drop also comes ahead of the start of US companies’ financial results for Q1, a tumultuous quarter that was dominated by headlines about COVID-19, Russia’s attacks on Ukraine, inflation and supply-chain issues. Many investors are trading cautiously ahead of the reports. By sector, the technology and consumer discretionary sectors had the largest percentage drops of the week, down 4% and 3.3%, respectively. Other sectors in the red included communication services, industrials, financials and materials. Still, the health care sector climbed 3.4%, followed by a 3.2% increase in energy, a 2.7% gain in consumer staples and a 1.9% boost in utilities. Also in the black, real estate edged up 0.8%. The technology sector’s decliners included Qualcomm (QCOM) as JPMorgan Chase cut its price target on the stock to $205 each from $240. Qualcomm’s shares fell 7% on the week. In consumer discretionary, shares of Ford Motor (F) fell 9.5% last week as the automaker said its US sales fell nearly 26% year-over-year in March amid persistent supply chain issues that contributed to a 17% drop in its Q1 US sales. On the upside, the health care sector’s gainers included AbbVie (ABBV), whose Allergan unit said a phase 3 trial evaluating two daily doses of its Vuity 1.25% eye drop in adults with presbyopia met its primary efficacy endpoint by “improving near vision without compromising distance vision” on day 14. Based on the results, the company is planning a supplemental new drug application submission to the Food & Drug Administration for an optional twice-daily administration of the eye drop in Q2; it has been FDA approved since October for once-daily use to treat presbyopia, or age-related blurry near vision, in adults. Shares climbed 7.5%. Next week, the US companies expected to release quarterly results include JPMorgan Chase (JPM), Delta Air Lines (DAL), Goldman Sachs (GS), Morgan Stanley (MS), Citigroup (C) and UnitedHealth Group (UNH). Economic data scheduled to be released next week include the March consumer and producer price indexes, March retail sales, and March industrial production. Provided by MT Newswires |
Where will our markets end this week?
Lower
DJIA – Bullish
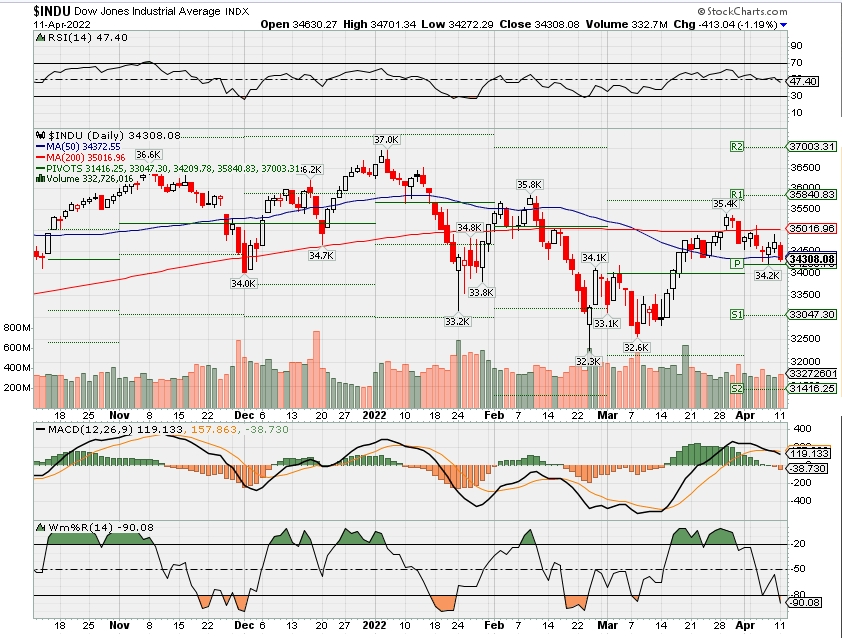
SPX – Bullish
COMP – Bullish

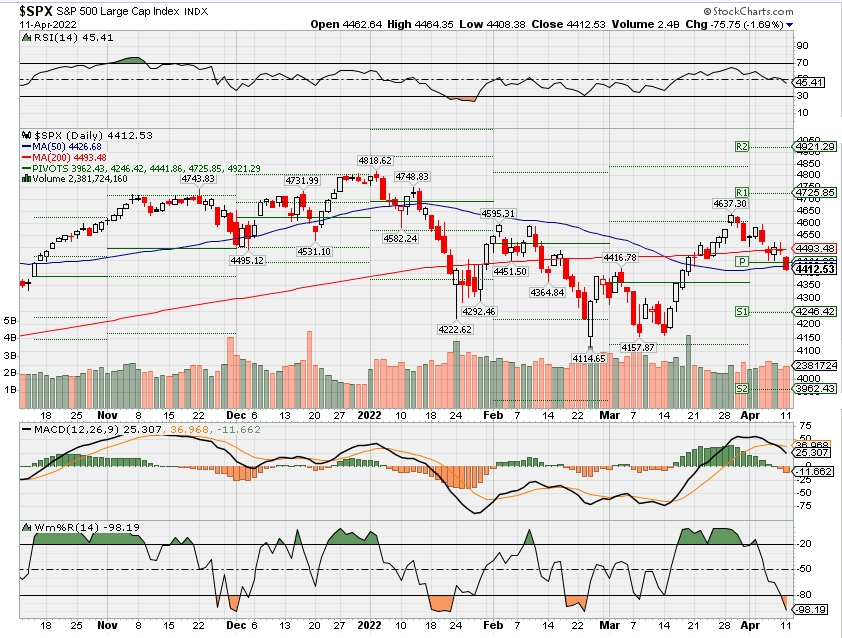
Where Will the SPX end April 2022?
04-11-2022 +2.0%
04-04-2022 +2.0%
03-28-2022 +2.0%
Earnings:
Mon:
Tues: KMX,
Wed: BBBY, BLK, DAL, FAST, JPM
Thur: C, GS, MS, USB, WFC, UNH
Fri:
Econ Reports:
Mon:
Tues: CPI, Core CPI, Treasury Budget
Wed: MBA, PPI, Core PPI
Thur: Initial Claims, Continuing Claims, Retail Sales, Retail Ex-auto, Business Inventories, Michigan Sentiment
Fri: Market Closed – Good Friday
How am I looking to trade?
Currently protection on all core holding and we started last Tuesday and finished last Wednesday
www.myhurleyinvestment.com = Blogsite
customerservice@hurleyinvestments.com = Email
Questions???
Fed officials plan to shrink the balance sheet by $95 billion a month, meeting minutes indicate
Jeff Cox@JEFF.COX.7528@JEFFCOXCNBCCOM
KEY POINTS
- Fed officials reached consensus at their March meeting that they would begin reducing the central bank balance sheet by $95 billion a month, likely beginning in May.
- There also were strong indications that half-percentage point, or 50 basis point, interest rate increases are ahead.
Federal Reserve officials discussed how they want to reduce their trillions in bond holdings at the March meeting, with a consensus around $95 billion a month, minutes released Wednesday showed.
Officials “generally agreed” that a maximum of $60 billion in Treasurys and $35 billion in mortgage-backed securities would be allowed to roll off, phased in over three months and likely starting in May. That total would be about double the rate of the last effort, from 2017-19, and represent part of a historic switch from ultra-easy monetary policy.
In addition to the balance sheet talk, officials also discussed the pace of interest rate hikes ahead, with members leaning toward more aggressive moves.
At the March 15-16 meeting, the Fed approved its first interest rate increase in more than three years. The 25 basis point rise— a quarter percentage point — lifted the benchmark short-term borrowing rate from the near-zero level where it had been since March 2020.
The minutes, though, pointed to potential rate hikes of 50 basis points at upcoming meetings, a level consistent with market pricing for the May vote. In fact, there was considerable sentiment to go higher last month. Uncertainty over the war in Ukraine deterred some officials from going with a 50 basis point move in March.
“Many participants noted that one or more 50 basis point increases in the target range could be appropriate at future meetings, particularly if inflation pressures remained elevated or intensified,” the minutes said.
Stocks fell following the Fed release while government bond yields held higher. However, the market came well off its lows as traders adjusted to the central bank’s new posture.
The minutes were “a warning to anyone who thinks that the Fed is going to be more dovish in their fight against inflation,” said Quincy Krosby, chief equity strategist at LPL Financial. “Their message is, ‘You’re wrong.’”
Indeed, policymakers in recent days have grown increasingly strident in their views about taming inflation.
Governor Lael Brainard said Tuesday that bringing prices down will require a combination of steady hikes plus aggressive balance sheet reduction. Markets expect the Fed to increase rates a total of 250 basis points this year. The minutes noted, that, “All participants indicated their strong commitment and determination to take the measures necessary to restore price stability.”
Krosby said the policymakers’ position thus shouldn’t have come as much of a surprise.
“The Fed orchestrated a concerted effort to warn the market, telling the market in no uncertain terms that this is serious, this is paramount, we are going to fight inflation,” she said. “What they have on their side is a still-healthy jobs market, and that’s important. What you don’t want is the Fed making a policy error.”
The central bank’s relative hawkishness extended to the balance sheet talk. Some members wanted no caps on the amount of the monthly runoff, while others said they were good with “relatively high” limits.
The balance sheet rundown will see the Fed allowing a capped level of proceeds from maturing securities to roll off each month while reinvesting the rest. Holdings of shorter-term Treasury bills would be targeted as they are “highly valued as safe and liquid assets by the private sector.”
While officials did not make any formal votes, the minutes indicated that members agreed the process could start in May.
Whether the runoff actually will hit $95 billion, however, is still in question. MBS demand is muted now with refinancing activity low and mortgage rates rising past 5% for a 30-year loan. Officials acknowledged that passive runoff of mortgages likely may not be sufficient, with outright sales to be considered “after balance sheet runoff was well under way.”
Also at the meeting, Fed officials sharply raised their inflation outlook and lowered their economic growth expectations. Surging inflation is the driving factor behind the central bank tightening.
Markets were looking to the minutes release for details about where monetary policy heads from here. Specifically, Fed Chairman Jerome Powell said at his post-meeting news conference that minutes would provide details on the thinking about balance sheet reduction.
The Fed expanded its holdings to about $9 trillion, or more than double, during monthly bond purchases in the wake of the pandemic crisis. Those purchases ended only a month ago, despite evidence of roaring inflation higher than anything the U.S. had seen since the early 1980s, a surge that then-Fed Chairman Paul Volcker quelled by dragging the economy into a recession.
China’s smartphone market could plunge 20% as Covid cases spike — but Apple may see growth
KEY POINTS
- China’s smartphone market could decline around 3% to 4% in the second quarter as a resurgence of covid cases could dampen consumer sentiment, analysts said.
- April and May could see a sharper plunge but the market could rebound in June if Covid cases subside.
- Android players such as Xiaomi could fare worse than Apple which continues to fill the gap left by Huawei in the premium segment of the market, analysts said.
China’s recent surge in Covid cases threatens to hurt sales of handsets in the world’s largest smartphone market if it’s not contained, but U.S. giant Apple could still hold up well, analysts told CNBC.
On Wednesday, China reported more than 20,000 Covid infections with the majority in the mega city of Shanghai. Authorities there have imposed strict lockdown measures in the city, threatening logistics and consumer spending.
Neil Mawston, executive director at Strategy Analytics, forecasts a 20% year-on-year decline in the second quarter for smartphone shipments.
Neil Shah, partner at Counterpoint Research told CNBC smartphone sales for April and May could fall 12% to 13% year-on-year.
Sales could pick up in June due to a huge discount shopping event and as Covid subsides. That could leave smartphone sales in China down 3% to 4%, Shah said. If the Covid situation continues, however, the market could drop as low as 12% year-on-year, he added.
The Android segment in China remains a brutal marketplace, with half-a-dozen brands (like Xiaomi) fighting fiercely on price for a piece of a shrinking Android pie.
Neil Mawston
EXECUTIVE DIRECTOR, STRATEGY ANALYTICS
Smartphone shipments could fall around 3.4% year-on-year in the second quarter, predicted Will Wong, research manager at IDC.
“The impact is expected to be mainly coming from the soft consumer demand and sentiment caused by the Covid outbreak and slower economic momentum,” Wong told CNBC. “The supply disruptions will be a less disturbing factor as the factory bubbles and the government’s experience in curbing the outbreak could help to mitigate the impact.”
In March, Apple iPhone assembler Foxconn briefly had to close one of its main factories in Shenzhen due to Covid. During Covid outbreaks, China has attempted to keep factories up and running as much as possible to reduce disruption.
Android players vulnerable
China’s smartphone shipment decline in the second quarter will be “mainly due to the weaker momentum of the Android market,” IDC’s Wong said.
Android is Google’s smartphone operating system. Chinese brands run a modified version of these. Android phone vendors include Chinese smartphone makers like Xiaomi, Oppo and Vivo.
“The Android segment in China remains a brutal marketplace, with half-a-dozen brands (like Xiaomi) fighting fiercely on price for a piece of a shrinking Android pie,” Strategy Analytics’ Mawston said.
However, Apple could fare quite well. Shah said that Apple could see a decline of around 4% to 5% in shipments in the second quarter, but that is partly seasonal as the effect of brand new product releases wears off. Apple released its newest products toward the end of last year.
Apple continues to take advantage of the decline of Huawei in the premium end of the market, according to both Shah and Wong. Huawei’s smartphone business has been crippled due to U.S. sanctions cutting off the tech giant from key components like cutting-edge chips.
Wong said Apple could actually see positive growth in the second quarter “amid the decline of Huawei and the lack of strong high-end competitors.”
Mawston said he expects Apple to actually grow its overall market share in China in 2022 “as its loyal, affluent fans upgrade to new or more affordable 5G models.”
5G refers to next-generation mobile internet which promises super-fast speeds. Apple launched the 2022 version of the cheaper iPhone SE in March which offers 5G.
Warren Buffett’s Preferred Equity Allocation Is 100%. Why the Berkshire CEO Hates Bonds.
2 Pehal News Team 0 Comments Acquisitions, Acquisitions/Mergers/Shareholdings, Asset allocation, Barron’s Take, Berkshire Hathaway, Bond Markets, Bonds, BRK.B, BRKA, business, Business/Consumer Services, C&E Exclusion Filter, C&E Industry News Filter, CB, Chubb, commentary, commodity, Commodity/Financial Market News, consumer services, Content Types, Corporate, Corporate Actions, Corporate/Industrial News, Debt, Debt/Bond Markets, Diversified Holding Companies, Earnings Report, Equity Markets, Factiva Filters, financial market news, financial news, Financial services, general news, government debt, Government Debt/Bond Markets, industrial news, insurance, IWE Filter, Mergers, municipal bonds, municipal debt, Municipal Debt/Bond Markets, Ownership Changes, personal finance, political, Political/General News, routine market, Routine Market/Financial News, shareholdings, SYND, Treasuries, treasury bond prices, Treasury Bond Prices/Commentary, Warren Buffett
Warren Buffett’s most popular fairness allocation is 100%, and he has adopted that technique each personally and at Berkshire Hathaway in a manner that’s radically completely different from different firms in the insurance coverage enterprise.
Buffett dislikes bonds, and that’s obvious in the tiny fixed-income weighting in the firm’s insurance coverage funding portfolio.
The Berkshire Hathaway (ticker: BRK.A, BRK.B) CEO wrote in his annual shareholder letter that his penchant for shares goes again a good distance. He made his first funding in March 1942 at age 11, buying $114.75 of Cities Services most popular inventory, which amounted to all his financial savings.
At the time, the Dow Jones Industrial Average closed at 99, “a fact that should scream at you. Never bet against America,” Buffett wrote. The Dow is now near 34,000.
“After my initial plunge, I always kept at least 80% of my net worth in equities. My favored status throughout that period was 100%—and still is,” Buffett wrote. He has famous in Berkshire’s “owner’s manual” that he has over 98% of his web value in Berkshire inventory.
Buffett wrote in the handbook that he’s comfy together with his “eggs-in-one-basket” funding in Berkshire “because Berkshire itself owns a wide variety of truly extraordinary businesses.”
“Indeed, we [he and Vice Chairman Charlie Munger] believe that Berkshire is close to being unique in the quality and diversity of the businesses in which it owns either a controlling interest or a minority interest of significance,” Buffett wrote.
His almost 100% fairness strategy is one thing that many monetary advisors would reject as too dangerous, notably for retirees. He doesn’t have to fret about counting on Social Security if he takes an enormous monetary hit, provided that his Berkshire holding is value over $100 billion and he has greater than $1 billion of different property.
Berkshire’s funding technique with its insurance coverage companies units it other than just about each different main insurer given its heavy fairness orientation.
In its 2021 10k report, Berkshire disclosed that its huge insurance coverage companies held $335 billion of shares, $95 billion of money and equivalents, and simply $16 billion of bonds at yr finish. Berkshire’s insurance coverage liabilities, or float, totaled $147 billion at year-end 2021.
Berkshire had a complete money place throughout all its companies of $147 billion and equities of $351 billion, with the insurance coverage operations representing the bulk of each.
Berkshire’s insurance coverage asset allocation is roughly 75% shares, 21% money, and 4% bonds. This is an attention-grabbing various to the normal 60/40 mixture of shares and bonds and quantities to a “barbell” technique of higher-risk shares and low-risk money.
It’s one thing for monetary advisors to contemplate given the danger in bonds given deeply destructive actual rates of interest and the prospect of upper money returns, assuming the Federal Reserve begins boosting rates of interest in the coming months. Cash may very well be yielding 2% a yr from now, from almost zero.
It’s notable that the bulk of Berkshire’s bondholdings are in overseas authorities debt—some $11 billion of the $16 billion. This signifies how little Buffett thinks of Treasuries as an funding.
Berkshire has little or no municipal bonds, not like most insurers. Individuals have lengthy favored munis. Berkshire does like Treasury payments, with the ultrasafe authorities short-term obligations representing the bulk of its money and equivalents. Buffett needs to have most liquidity if Berkshire ever wants it.
Buffett, nevertheless, is much less enamored of shares and has been so for greater than a yr. He wrote in his letter that there’s “little that excites us” in fairness markets. Berkshire was a web vendor of shares in 2020 and 2021
Buffett’s strategy has paid large dividends for Berkshire given the inventory market rally of the previous decade. He has seen bonds as a nasty wager given traditionally low yields. Berkshire’s fairness orientation has gotten extra excessive. Berkshire has lower its bond portfolio in half since 2010, whereas its fairness portfolio is up sixfold and money up greater than fourfold.
At CHUB (CB), certainly one of the largest property and casualty insurers, bonds made up about 90% of its funding portfolio at year-end 2021 and shares and money about 5% every. That asset allocation is frequent amongst insurers.
The typical property and casualty insurer has the huge portion of its invested property in bonds due to the larger volatility of shares and insurance policies of credit-rating companies that encourage bondholdings.
Berkshire is ready to carry such a heavy fairness weighting as a result of its insurance coverage operations are overcapitalized and Berkshire has important earnings outdoors its insurance coverage companies. Buffett has stated that one necessary advantage of Berkshire’s conglomerate construction is the means to have an equity-heavy asset combine at its insurance coverage operations.
Here’s what Buffett wrote in his 2020 annual letter about Berkshire’s insurance coverage funding strategy:
“Overall, the insurance fleet operates with far more capital than is deployed by any of its competitors worldwide. That financial strength, coupled with the huge flow of cash Berkshire annually receives from its non-insurance businesses, allows our insurance companies to safely follow an equity-heavy investment strategy not feasible for the overwhelming majority of insurers.
“Those competitors, for both regulatory and credit-rating reasons, must focus on bonds. And bonds are not the place to be these days. Can you believe that the income recently available from a 10-year U.S. Treasury bond—the yield was 0.93% at year-end—had fallen 94% from the 15.8% yield available in September 1981? In certain large and important countries, such as Germany and Japan, investors earn a negative return on trillions of dollars of sovereign debt. Fixed-income investors worldwide—whether pension funds, insurance companies or retirees—face a bleak future.”
Buffett was proper: The 10-year Treasury word now yields almost 2% and bond traders have had destructive returns in the previous yr.
Why Buffett’s 90/10 Allocation Drubs The 60-40 Portfolio – Especially With Rising Inflation
Nov. 16, 2021 4:19 PM
Summary
- The 60-40 portfolio no longer works, and in reality, never worked as advertised. Except briefly in the 1930s bonds were neither uncorrelated nor safe.
- Volatility may not be a good way to define risk. Buffett has always defined risk as permanent loss of capital. Inflation creates heavy pressure to define risk the right way.
- While the basic principle of diversification works, bonds are flawed diversifiers; the best bond returns align with very good years for stocks because the underlying driver is the same.
- Stocks incorporate inflation in their returns and benefit from internal compounding, while bonds offer only regular cash payments and are highly vulnerable to inflation.
- Buffett prefers 90% stocks and zero bonds, especially at the present moment; his cash is either necessary to Berkshire’s insurance businesses or belongs to its equity “bucket.”
“Stocks are probably still the best of all the poor alternatives in an era of inflation – at least they are if you buy in at appropriate prices.” Warren Buffett, 1977
For several decades academic research has touted the 60/40 portfolio and most other portfolios with a significant bond allocation. For quite a while this approach worked, or seemed to, though not exactly because of the premise on which it was based. Meanwhile, since 2013 and by implication much earlier, Warren Buffett has revealed an opposing view through his actions. His implicit premise would be pretty close to All Stocks All The Time. So it’s academia and Vanguard versus Buffett and street smarts. Borrowing the name of a once popular TV show, Who Do You Trust? (Or was it Whom?)
Our two goals as investors are safety and return. It’s that simple. You can make it as complicated as you want, but in the end, it comes back to those two factors – risk and return. That’s why the broad strategy we call the 60-40 portfolio succeeded as well as it did for as long as it did. Its great innovation was introducing risk as an important factor – or seeming to. Before the famous Harry Markowitz paper (“Portfolio Selection,” The Journal of Finance, March 1952) the now obvious fact that risk is a part of investing had never really occurred to anybody. It took a quantitative thinker to figure that out. He got a belated, but well-deserved Nobel Prize for it in 1990.
Before taking the 60-40 portfolio apart it should be pointed out it was never really a simple 60-40. The 60-40 allocation was just one of the points at which risk and return coincided as a point on the Markowitz curve for Efficient Frontier. What it provided was a comfortable middle ground among all possible asset mixes. What made it popular was the fact that it appeared to work perfectly for investors with a moderate willingness to accept risk. They could feel comfortable at times of stock volatility. The 60-40 version reflected a modest bias toward stocks – shifting 10% to the right side of the graph from 50-50. That makes intuitive sense because stock return is higher than bond return.
In an often-cited Jason Zweig interview (Money Magazine, January 1998) Markowitz alluded to his own personal asset allocation as being 50-50, saying the following:
I should have computed the historical co-variances of the asset classes and drawn an efficient frontier. Instead, I visualized my grief if the stock market went way up and I wasn’t in it-or if it went way down and I was completely in it. My intention was to minimize my future regret. So I split my contributions 50/50 between bonds and equities.”
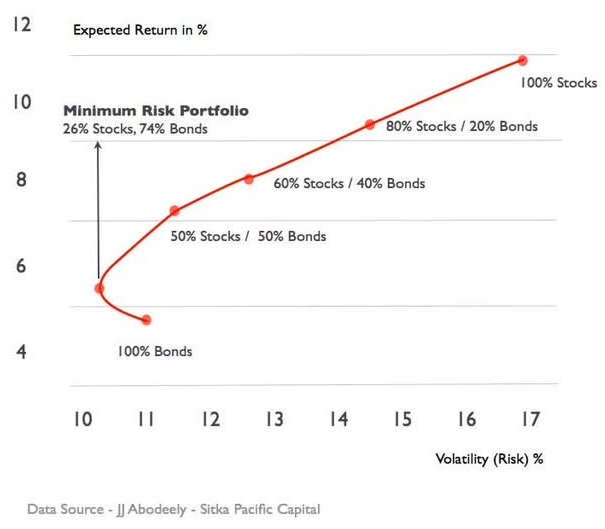
The Markowitz quote has become legendary. Zweig later explained that it was taken out of context. Markowitz explained years after the fact that the 50-50 allocation was what he had been using before doing the calculations required by his thesis. What stuck, however, was the behavioral element – investing to minimize “grief” when on the wrong side of the market. Let’s accept that Markowitz knew better, but his explanation contains a deep underlying truth. I suspect that a very large number of investors settle on an allocation which makes them feel safe. We should perhaps give Markowitz credit where it’s due. What makes us feel good may be the most underrated of life principles. Most people live their lives to minimize regret. Here’s a popular representation of the “efficient frontier” using the two major factors – stocks and bonds:
Two important questions sneak in under the radar:
- Bonds are in theory your safe asset with which you sacrifice a bit of return for greatly reduced risk. But look at the vertical line defining the Minimum Risk Portfolio as 26% stocks and 74% bonds. Additionally, and perhaps more important, you can increase return by 30-40% by ramping up the stock allocation by a similar amount with little or no increase in risk.
- And what is “risk” anyway? From an academic perspective “risk” is volatility, which is not surprising because volatility is easy to quantify. You can attach very specific numbers to the probability of various levels of volatility. But is volatility really a satisfactory proxy for “risk”? Unless your portfolio is vulnerable to sequence-of-return risk, as in retirement withdrawals or a fund which may be needed for hard-to-predict emergencies, volatility really has much less weight than the academic approach attaches to it. if you are down big for a year you can address that problem by posting a large note on the wall STOCKS WIN IN THE LONG RUN. Buffett’s approach focuses on the correct temperament for investors and his view of risk if grounded in street smarts: ACTUAL RISK IS PERMANENT LOSS OF CAPITAL.
Was The Underlying Academic Premise Sound?
Markowitz was clearly right about one thing. Owning two different and uncorrelated assets – for example, a farm or a cellar of fine wines versus a portfolio of financial assets – reduces the level of risk for either asset taken separately. They may correlate slightly because of sharing some sensitivity to economic conditions, but over long periods they probably rise and fall in value at different times. The main point of the Markowitz argument, however, had to do with bonds versus stocks, sometimes sliced into smaller elements such as large caps and small caps or growth and value. For practical purposes, however, it’s stocks versus bonds, period. That’s the basic juxtaposition used for decades by Vanguard in its list of possible portfolio allocations which were frequently represented by colorful pie charts. It’s also the underlying principle of Vanguard Target Retirement portfolios and similar Life Cycle offerings by other investment firms. All begin stock heavy and end up bond heavy at retirement.
The numbers for return and volatility reflect long-term averages starting in 1926. The reason is that earlier data wasn’t collected as rigorously as it was beginning in 1926 so that an effort to begin at an earlier time would be misleading. It’s the same reason that the famous and widely accepted Roger Ibbotson/Peng Chen study (“Stock Market Returns In The Long Run,” March 2002), begins with that date. Ibbotson and Peng studied risk premium and the composition of stock returns from 1926 through 2000, and their study was later extended in stages to 2020, by which year it covered 95 years of data.
The Vanguard presentation of particular points on the Efficient Frontier curve were presented with colorful pie charts and was labelled in clusters of ascending stock allocation for Income, Balanced, and Growth investors. Those categories are highly artificial and designed to assuage fears and help all investors feel good. For the sake of space and easy comparison I am presenting the same information in the form of the table below. It covers the years 1926 through 2020, using updated Ibbotson/Chen data. The numbers for best and worst annual returns are rounded to fit space limitations for the table:
| Allo-cation | 100% Bonds | 20/80 | 30/70 | 40/60 | 50/50 | 60/40 | 80/20 | 90/10 | 100% Stocks |
| Avg Return | 6.1% | 7.2% | 7.7% | 8.2% | 8.7% | 9.1% | 9.8% | 10.0% | 10.3%% |
| Best Year | 46%(1982) | 41%(1982) | 38%(1982) | 36%(1926) | 34% (1982) | 37%(1933) | 45%(1933) | 51%(1933) | 54%(1933) |
| Worst Year | -8%(1969) | -10%(1931) | -14%(1931) | -18%(2020) | -22.5 (1931) | -27%(1931) | -31%(1931) | -39%(1931) | -43%(1931) |
| Years Loss | 19 of 95 | 18 of 95 | 18 of 95 | 19 of 95 | 20 of 95 | 22 of 95 | 24 of 95 | 24 of 95 | 25 of 95 |
The above table was designed to convey the idea that an investor could reduce risk with relatively small reductions in average return. This is accomplished by turning the dial backward to increase the percentage of allocation to bonds. After all, bonds are the “risk-free” asset. They are supposedly uncorrelated to stocks. Adding bonds therefore produces a combined portfolio with reduced risk. It obviously works best in IRAs or other tax-advantaged accounts for which selling to rebalance has no tax cost. Subtracting the lower bond return from the annualized stock return gives you the magic number referred to as the “risk premium.”
The risk premium is the amount of surplus return investors require for stocks in order to justify their greater risk. It is important to remember that it is a number backed into after the fact and explained to account for other numbers. In the above table you calculate it simply by subtracting the long-term average bond return (6.1%) from the long-term average stock return (10.3%). The difference is the long-term risk premium of 4.2%. That is the amount of return sacrificed in order to avoid grief in the event of catastrophe or, by the alternative view, to enable you to sleep well at night. If that sounds a little like the later recanted explanation of Harry Markowitz for his 50-50 portfolio, well, it is.
What a bond allocation actually does is more or less assure lower returns. The one exception is in a severe deflationary period like the 1930s when owning bonds served to pay you about 3.5%. From 1930 to 1932, while stocks were being killed, the prices of most goods were also going down. The CPI fell at an annual average rate of roughly 10%. For those three years bonds were a great asset. Cash buried under a mattress was also a great asset, bank accounts not so much. Many banks failed. The collapse in prices meant that anything that held its value went up phenomenally – but briefly, and only that once. The extreme outperformance by bonds and cash waned by 1933 when stocks started to bounce back. That fact is visible in the prominence of 1933 on the line containing “Best Years” in the table above going all the way forward to the present day. Otherwise, bonds have been a loser and a drag on returns.
The major positive impact bonds have had on risk has been to provide negative leverage. This dampens “risk” defined as volatility – the nail-biter risk that Markowitz used his own case to define so accurately. It does not reduce risk for the long-term buy-and-hold stock investor who rarely looks at her portfolio. The pronoun used here is more than a nod toward being politically correct. Many studies show that women beat men as investors in part by not looking at their portfolios frequently and trading infrequently.
Damping down volatility is very different from actually reducing risk in the more down to earth sense. That’s true only during the rare phenomenon of intense and somewhat sustained deflation. The event during which bonds clearly stand out – in a very negative sense – is the flip side of deflation – sustained and intense inflation. Note that the only Worst Year in the above chart other than 1931 (when stocks were falling steeply and relentlessly), was the 100% bond allocation in 1969. Stocks weren’t having a particularly good year (down roughly 10%), but bonds – 100% bonds – were being crushed. The disaster had such a deep impact on the markets that people in the industry began to say that what bonds provided for your portfolio was not risk-free return, but “return-free risk.” They were sometimes called “certificates of confiscation.”
Why Stocks Are The Winners: Buffett’s View
The Ibbotson/Chen study which had so much impact on our way of looking at risk and return had a tremendous amount to say about stocks, but very little to say about bonds. What drove bonds was all too obvious, interest rates, which are themselves driven by inflation rates. Interest rates and inflation rates move from low to high and back again. Stocks trend upward in the long run with ups and downs around the trend. Stocks are negatively impacted by inflation rates, but they have other qualities that bear upon their returns. Those “other qualities” are the essence which makes stocks what Buffett called “equity bonds.” Stocks are in effect bonds which are perpetual and offer a rising coupon, while the main virtue of bonds is that Treasuries are totally safe and corporates are higher than stocks on the capital structure and thus less likely to fail to make payments or go to zero when times are tough. The bar chart below was the simplest of several by which Ibbotson and Chen laid out the drivers of long-term stock return. It deserves close attention.
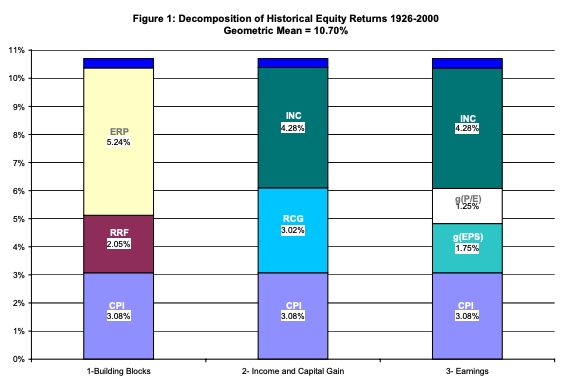
The three bars represent three ways of looking at the composition of stock returns. The first thing to note is that all three have the same base, inflation as represented by the CPI (Consumer Price Index). Stock returns are sometimes represented as real (inflation subtracted out) and sometimes as nominal (inflation included). Whether inflation hurts, helps, or is neutral to stock returns is controversial, even Warren Buffett himself is not perfectly clear and consistent on the subject, but the consensus tilts toward it helping at least to some degree. Historian Frederick Taylor’s book on hyperinflation in Germany in the early 1920s (The Downfall of Money) describes the way creditors and savers were absolutely killed while owners of farms, factories, and stocks kept up with rising prices and even profited. The Ibbotson/Chen bar charts take as an assumption that stocks in the aggregate have nominal returns incorporating the long term 3% average for inflation.
Stacked above inflation in the first bar is the real risk-free rate (RRG) which is average bond return less CPI, and the Equity Risk Premium (ERP), a number which is more or less backed into by subtracting CPI and RRG from Equity Return. The second bar looks directly at stock returns, stacking Real Capital Gains and Dividend Income above CPI. The third bar replaces Real Capital Gains with the element which generates them, growth in earnings per share and growth in P/E ratio per share. The small top line in all three cases supposedly represents “reinvestment” but actually seems mainly a corrective to rounding error in order to get to 100%.
The Vanguard table of the range of stock/bond allocations presents both stock and bond returns in nominal terms. To get real returns you would subtract 3% from both the 6.1% for bonds and the 10.3% for stocks. The bar charts above point up an important difference between stocks and bonds which should always be remembered. The nominal bond return is simply cash (including any capital gains/losses from selling before maturity). The inflation rate is simply the bondholder’s problem, something that must be endured in the lower purchasing power of cash returns. Stocks on the other hand contain internally a reflection of inflation rates – it’s right there at the bottom of the totem pole on all three bar charts. Stocks, to a far greater degree than bonds, have some control over their own destiny in terms of purchasing power provided. Only deflation catches them flat-footed with no good immediate answer as in the 1930s.
In his famous May 1977 Fortune article on this subject (How Inflation Swindles The Equity Investor), Buffett produces the greatest analysis of the internal workings of an American corporation that I personally know of. He chronicles the slow recognition of the power of internal compounding investors came to recognize in the 1950s, something I myself noticed as a boy in the gradually rising price earnings multiples. The fact that companies could do so well by reinvesting retained earnings led investors to triple the price-earnings (P/E) ratio of stocks in the aggregate between 1946 and 1966 and raise the price-to-book-value (P/B) from 1.33 to 2.20.
One thing that Buffett does not mention in the article, but which is very much consistent with his view of the 1950s, is that the dawning discovery of internal compounding literally reversed a major relationship between stocks and bonds. From the beginning of good records (1926) stocks had always had a higher cash yield than bonds. Stocks were thus both speculative vehicles, as they were depicted in Jesse Livermore’s Reminiscences of a Stock Operator, and income investments, also represented in Livermore’s frequent discussion of the importance of dividend increases or decreases.
All that ended in 1958 as the power of reinvested earnings became apparent and growth investing was popularized that same year by Phil Fisher’s Common Stocks And Uncommon Profits. The year 1958 is one of the least recognized major turning points in financial history. Stocks reduced or even eliminated dividend payouts in order to reinvest more of their cash flow. Stock dividend yields sank below bond yields for the first time ever. Many savants called it a fluke and predicted that it would quickly reverse itself. That reversal didn’t take place for 50 years, in the depths of the 2008 financial crisis when the Fed pushed interest rates down to zero. It has gone back and forth since. Here’s a chart of the reversal in 2008:
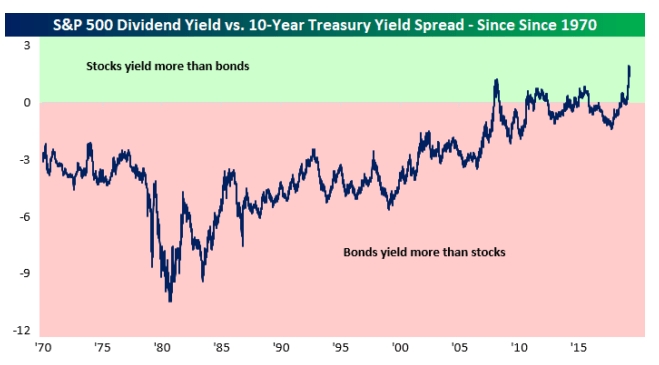
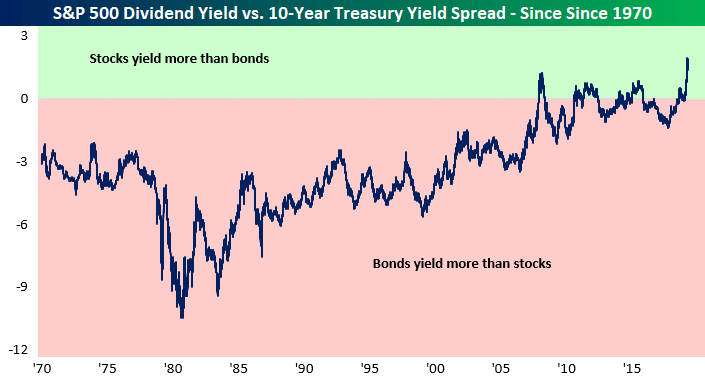
This power of internally generated growth is what led Buffett to his description of stocks as “equity bonds.” The “equity” part of it is represented by the several parts of the above bar charts which bonds do not possess. Writing in 1977, in the final stages of the huge inflation run-up of the 1970s, Buffett appears at times to underestimate or not fully recognize the adjustment many companies were able to make (unlike such industries as utilities which were caught flat-footed by heavy debt within a capital-intensive structure). His overall conclusion clearly supports the case that equities possess virtues which credit instruments (bonds) do not. Here’s the final paragraph of the Buffett bio provided at the end of the article, the last line of which speaks with clarity and force as we move toward a situation analogous in some ways to the later 1970s:
And why does a man who is gloomy about stocks own so much stock? “Partly, it’s habit,” he admits. “Partly, it’s just that stocks mean business, and owning businesses is much more interesting than owning gold or farmland. Besides, stocks are probably still the best of all the poor alternatives in an era of inflation – at least they are if you buy in at appropriate prices.”
What inflation does to harm stocks is mainly in the area of price-to-earnings (P/E) and price-to-book-value (P/B) compression. It is external – how stocks are priced – more than internal. During the 1970s the major elements of the 1950s ran in reverse, with P/E and P/B ratios declining sharply. By the end of the 1970s, stocks were almost as cheap as they had been in the early 1930s. Buffett chronicles this in the 1977 article but stops before attempting to provide a formal thesis. His actual answer was simple common sense – not so common, I suppose, because nobody else seemed to possess it. The late 1970s were a great time to load up on stocks and you had several years to do it.
Bonds And Stocks From 1982 To Now
The late summer of 1982 was another major turning point in financial market history. Henry Kaufman’s recent book, The Day The Markets Roared, documents the date (August 13, 1982), when Fed Chair Paul Volcker declared victory in the war on inflation, cut rates, and set off a huge bull market in both bonds and stocks which has continued to this day. The hero of Kaufman’s book was, not surprisingly, Henry Kaufman, but with a nod to Volcker. The bond bull market that followed, it should be said, was slightly less vigorous but smoother than the stock bull. Returns of the two asset class have been within a percentage point or two for almost 40 years. The leadership has switched back and forth as stocks have periodically experienced temporary catastrophes (1987, 2000, 2008) from which they recovered within reasonable periods. Taking the long view this does not look like non-correlation.
The prominence of the year 1982 as the top year for heavily bond weighted portfolios may be the single most important number on the Vanguard/Ibbotson table. Beginning that year, the performance of bonds supported a similar move in stocks. They were, in short, highly correlated. This runs counter to the usual view of their relationship. Stocks and bonds have both been great in the 40-year perspective, but as usual stocks have had much greater volatility. Dedicated buy-and-hold investors did extremely well with stocks and had no need for bonds.
Put another way, 1982 was the flip side of 1932. Looking back at economic and market history you can divide the experience of the past 90 years into two eras – the long rise of rates and inflation for 50 years starting in the 1930s and the long fall of rates and inflation from 1982 to the present. Bonds were terrible in the first era, excellent in the second. Taking the long view stocks did well in both eras. The key fact about 1982 is that stocks and bonds blasted off at the same time and continued to do so, more or less, for almost 40 years up to this moment.
The close correlation of stocks and bonds since 1982 makes bonds appear to have very substantial returns compared to stocks, despite impressive stability. It also suggests strongly that the primary force driving stocks and bonds was the same – persistently falling inflation and interest rates. Falling rates are a pure and simple matter of arithmetic for bonds, a simple positive which is not just the main thing but the whole thing. For stocks it’s a bit more complicated. A number of factors tied in with disinflationary forces aren’t positive for stocks, poor demographics and falling population growth being among them. Some factors, like advancing technology, combine elements of growth with a disinflationary drag.
The all-important denominator when summing the present value of all future stock returns is the main factor shared with bonds, taken directly from simple bond math. It’s the reason long-term growth stocks tend to do best followed by dividend and dividend growth stocks. It’s also the key to the fact that sooner or later the extremely powerful combined bond/stock mega-bull is going to run in reverse. Buffett clearly keeps a careful watch on this phenomenon. Here’s what he told Becky Quick in the course of the annual CNBC interview following the release of his 2017 Shareholder Letter:
Buffett: Well… I’ve been talking this way for quite a while, ever since the fall of 2008. I was a little early on that actually. But I don’t think you could time it. And we are not in a bubble territory or anything of the sort. Now, if interest rates were 7 or 8 percent, then these prices would look exceptionally high. But you have to measure, you know, you measure everything against – interest rates, basically, and interest rates act like gravity on valuation. So when interest rates were 15 percent in 1982 they’d pull down the value of any asset. So, what’s the sense of buying a farm on a 4 percent yield basis if you can get 15 percent in governments? But measured against interest rates, stocks actually are on the cheap side compared to historic valuations. But the risk always is, is that – that interest rates go up a lot, and that brings stocks down. But I would say this, if the ten-year stays at 230, and they would stay there for ten years, you would regret very much not having bought stocks now.”
What Buffett is saying, in a very common sense way, is that a dual mega-bull in stocks and bonds is a great thing as long as you are confident that it will continue for a while, but when it comes to an end, look out below. What do you want to be holding then? The only answer is the same one he gave in 1977: “stocks are probably still the best of all the poor alternatives in an era of inflation – at least they are if you buy in at appropriate prices.”
If you read carefully and read a bit more between the lines, you will have full understanding of Buffett’s actions and sometime inaction over recent years.
60/40 Is Clearly Broken, So Now What?
We live our lives forward rather than backward. The one true description of what back studies like the Ibbotson/Vanguard tables could do for you is if you could travel ninety-five years backward in time you would know exactly how to invest your money conservatively with decent return. At the present moment, however, there is a big problem with the basic premise of the 60/40 portfolio. The problem is in three parts: the 60 part, the 40 part, and the way the two parts are supposed to interact.
Return prospects from the present moment are miserable for both bonds and stocks at every allocation level. They may not remain miserable forever, but they are miserable right now. Just for the sake of argument I’m going to present the most recent 7-year projections by GMO for the return of various asset classes. They may seem draconic and extremely negative. GMO has a popular reputation for being either very early or very wrong, although its major market calls have been right often enough and soon enough to be worth paying attention to. In the present case, they are not as far removed from very mainstream opinions as they sometimes are. Bank of America brokerage, about as mainstream as it gets, recently came out with the view that ten-year returns could well be zero while Jeremy Siegel, author of Stocks For The Long Run and almost always a bull, recently forecasted a major market crack-up as a result of rapidly rising rates. Have a look at the September 30, 2021, seven-year real return estimates of GMO for several asset classes. Remember that inflation, which the numbers do not include, is expected by GMO to return to 2.2% within 15 years – somewhat longer than GMO has previously used. Which asset classes do you wish to own and in what proportion?

One thing I’m pretty sure of is that you don’t want to own a 60/40 allocation of stocks and bonds. If GMO should prove to be right, that would give you, let’s see, 0.6 times -7% (-4.2%) plus 0.4 times -4.4% (-1.76%) summing to -5.96%. Annualized. Before further subtracting. Cash actually looks better. In terms of cash returns, dividends and interest, there’s not a lot of difference between average S&P 500 stock dividends and the yield of the 10-Year T-Note.
Buffett’s Surprising Bequest
Buffett’s actions are often more powerful than his words. The following paragraph in Buffett’s 2013 Annual Shareholder Letter caused quite a stir:
What I advise here is essentially identical to certain instructions I’ve laid out in my will. One bequest provides that cash will be delivered to a trustee for my wife’s benefit. (I have to use cash for individual bequests, because all of my Berkshire shares will be fully distributed to certain philanthropic organizations over the ten years following the closing of my estate.) My advice to the trustee could not be more simple: Put 10% of the cash in short-term government bonds and 90% in a very low-cost S&P 500 index fund. (I suggest Vanguard’s.) I believe the trust’s long-term results from this policy will be superior to those attained by most investors – whether pension funds, institutions or individuals – who employ high-fee managers.
The above paragraph was presented in context of simple advice to ordinary Joe investors as a way to put aside and forget a diversified long-term investment. As I observed in an earlier article, the immediate response was surprise that Buffett chose the S&P 500 index rather than finding a way to leave the 90% for his wife in shares of his own Berkshire Hathaway (BRK.A) (BRK.B). The single sentence concerning his philanthropic commitments actually serves to explain that. The powerful statement contained in Buffett’s bequest is not the particular vehicle, but the choice of a diversified portfolio of proven large cap stocks over all other options. A 90% commitment to stocks is sometimes presented to young people just starting, but it is much less common as a suggestion for retirees who will presumably need to draw down their portfolios at a substantial and increasing rate. That raises the question of sequence-of-returns risk, having to withdraw a fixed amount when stock prices are down. That would be a real thing for Harry Markowitz to lose sleep over.
Buffett and his wife are different, of course. I won’t speculate about absolute numbers, but I am confident that she will not have to worry as to whether a 5% drawdown might be okay for a year or two. What I do have is an amusing mental image of Buffett with the attorney setting up his will jotting on the back of an envelope for about twenty seconds and saying, and oh, for my wife, let’s say 90% in the S&P 500 and 10% in T-Bills and maybe an annual rebalance. That may not be quite accurate but my guess is that it captures the spirit of it.
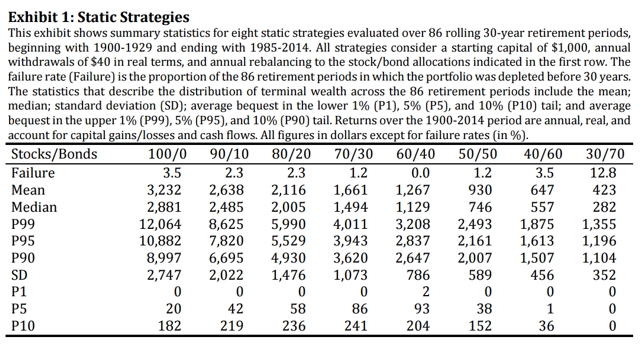
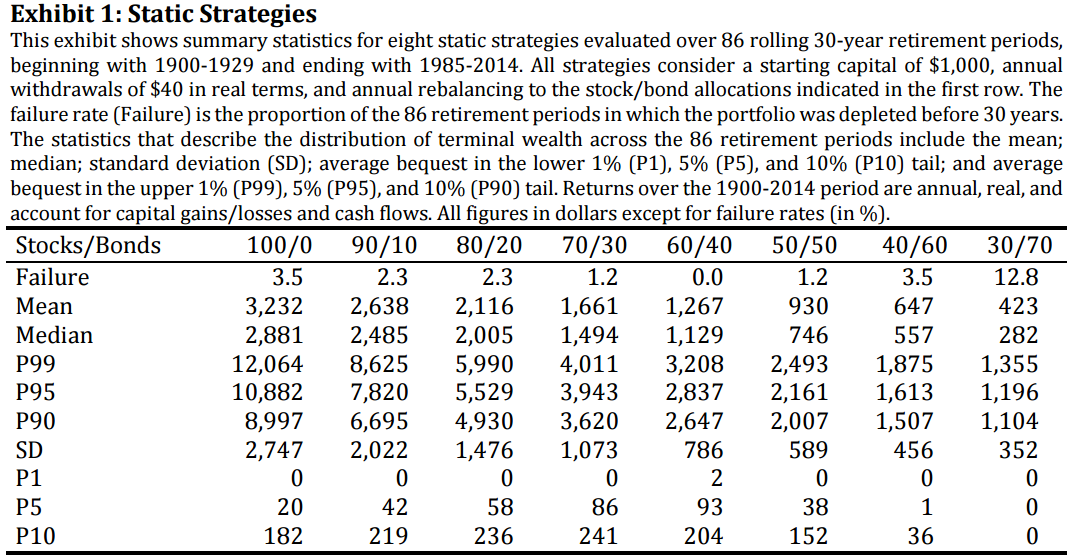
The amazing fact is that the 90/10 allocation strategy which Buffett chose for a bequest to his wife actually seems to work for retirees in more ordinary circumstances. Javier Estrada, a Professor at the prestigious IESE Business School at the University of Navarro, Spain (locations in Madrid and Barcelona), published a paper (“Buffett’s Asset Allocation Advice: Take It…With A Twist,” October 26, 2015) based on the series of 30-year periods from 1900 to 2014. It presumed a withdrawal rate of 4%. Failure is defined as running out of money within a 30-year period. Here’s a table showing the results:
Surprisingly the failure rate of Buffett’s 90/10 portfolio was only 2.3%. Even more surprisingly the 90/10 portfolio had a far lower failure rate than 40/60 and 30/70 portfolios. These are the equity allocations almost universally recommended for individuals nearing retirement or already retired. The allocation of Vanguard’s Target Retirement fund for those age 65 in 2015 is 40% equity/60% bonds.
Dropping the equity allocation to 80%, the equity level of Vanguard’s most aggressive Target Retirement fund, might appear to provide a bit more defense against “variance” than Buffett’s model. It doesn’t improve the statistical failure rate, however, and drops the mean return by 20%. In fact, only the 70/30 (1.2%), 60/40 (0.0%) and 50/50 (1.2%) portfolios had lower failure rates, and both mean and median returns fall off a cliff. A couple of simple rules for structuring withdrawals, Estrada’s “twists” – simply rebalance by drawing funds from stocks or bonds when one is the clear winner. Doing that improves the numbers significantly. With the “twist” elements added, the chance of running out of funds at a 4% withdrawal rate drops to zero.*(See footnote).
Under Estrada’s realistic assumptions, the Buffett 90-10 portfolio is therefore a better guide for retirees than any of the popular alternatives. At least that was the case in 2013. The small catch is that stocks are much more expensive today than they were in 2013. Forward PE of the S&P 500 was under 13 then and is roughly 75% higher now. Would Buffett’s recommendation continue to apply today?
Berkshire: 77% Equity, 23% Cash, Zero Bonds
The bequest to his wife is neither the first nor the most important evidence of Buffett’s preference for stock-heavy allocation. Berkshire Hathaway is itself about 77% equity, lumping publicly traded stocks and wholly owned companies into the equity category. About two-thirds of that 77% is the present market price of publicly traded companies without deducting future tax liability. What’s left is 23% cash.
It’s rare to find Buffett in the position of having been inconsistent, and the closer you look, the more apparent inconsistencies appear to melt away. Does Buffett’s 90-10 allocation apply within Berkshire itself? The more you think about it, the more you understand the right way to see that large cash position.
The most important element of the stock/bond debate revealed within Berkshire is the matter of insurance “float” – cash thrown off by Berkshire Hathaway’s insurance and reinsurance businesses. This insurance “float” is set aside to offset estimated future liabilities. It must also contain a margin of safety, a cushion for very large low probability events. For most insurance businesses it’s necessary to deploy this float in bonds, which have fixed rates and fixed maturities which can specifically offset estimated future liabilities. The reason is that their balance sheets couldn’t survive having to come up with outsize payouts during a bad stock market year. That’s sequence risk at the corporate level. It used to be relatively easy to offset future liabilities conservatively using bonds, but no more. Current minuscule rates have made the necessary returns had to find.
This is a problem which Berkshire doesn’t share because of the strength of its balance sheet. Berkshire is able to offset future insurance liabilities in large part by owning common stocks and whole companies. It’s impossible to overstate the competitive advantage Berkshire enjoys because of this ability to offset future liabilities with equity investments. It does, of course, put quite a bit of pressure on Buffett to deploy cash via acquisitions and/or stock purchases.
Berkshire’s recent Q3 earnings report brought forth the usual criticisms of Buffett’s failure to make a large acquisition, but in the process missed a few important things. For one thing, the markets as a whole, stocks and bonds, are highly likely on the simple basis of valuation alone to be approaching another turning point. The declining inflation and interest rates of the past 40 years seem to be at the brink of beginning to run in reverse. It’s hard to see stocks as anything but extremely expensive while bonds are even more expensive. In the long run growth in earnings will begin to help stocks. Nothing will help bonds. It’s simply not a moment to throw cash at assets readily available in the marketplace. Does this mean that Buffett has changed any part of his view on asset allocation?
The answer to this question involves an understanding of cash and share repurchases. Cash can be many things. It can be walking around money. It can be immediately available emergency money. It can also be funds in a pipeline waiting for the opportunity to invest. The cash set aside in the bequest for Buffett’s wife is probably the first use, walking around money, and maybe a bit of the second. Cash at Berkshire Hathaway serves the second and third purposes – money set aside for sudden insurance events and money held in a pipeline for buying equity assets. The amount set aside for insurance events is best understood as a cost of doing business in the insurance industry. It’s there because a large need for cash could appear at any time including times when it would be very inconvenient to sell stocks. It probably amounts to about a third of the current $150 billion of cash, possibly a little more.
The other $100 billion of Berkshire cash should be allocated to the ready-to-deploy “equity bucket”. In the last three years that cash has been deployed in part to repurchase a substantial number of Berkshire shares, over 5% of total shares last year (2020) and an amount on the way to being over 4% this year. That’s close to a regularly scheduled amount, something like a dollar-cost-averaging program for buying back stock. An action which reduces the denominator (total shares outstanding) is the same thing in effect as an increase in the numerator (adding publicly owned stocks and wholly owned subsidiaries). A cash cushion remains for opportunistic use in the event of a large decline in the market as a whole, a cheaper buyback price for Berkshire itself, or an unexpected opportunity to purchase a large asset. In any event, including cash intended for deployment in this fashion as part of the equity bucket raises the equity proportion of Berkshire Hathaway to 90% or more.
Conclusion
The notions that an allocation to bonds reduces risk is dubious at best. It is applicable only in cases where sequence-of-return risk make a stock-heavy portfolio susceptible to having to sell when the equity market is at a low. This is the only occasion which supports the idea that true risk derives from volatility.
At an extraordinary moment like the present, when both stocks and bonds are exceptionally expensive, bonds are much more vulnerable as market valuations of both revert to mean because their decline is driven by simple arithmetic. Stocks have in the long run the benefits that come from internal reinvestment and compounding. Being an owner always beats being a creditor in the long run. It is still prudent to keep a large stash of cash as part of one’s equity bucket. That’s Buffett’s practical advice, repeated here for the third time: “Partly, it’s just that stocks mean business, and owning businesses is much more interesting (Ed. Note: “profitable”) than owning gold or farmland. Besides, stocks are probably still the best of all the poor alternatives in an era of inflation – at least they are if you buy in at appropriate prices.”
Footnote:
*While rebalancing is of particular importance to retirees taking regular withdrawals, Estrada’s “twists” are also of interest simply from the standpoint of total expected returns. The first Estrada twist (T1) involves taking the annual withdrawal from stocks from stocks in years when equities have gone up and then rebalancing and taking the withdrawal from bonds when stocks have gone down and not rebalancing. The second twist (T2) uses relative performance of stocks and bonds. The table below shows the results.
The second change [T2] relates the annual withdrawal to the relative behavior of the stock and bond markets in the previous year. Just like adoption above, if stocks have gone up in the previous year, (more so than bonds) this change calls for the retiree to take the annual withdrawal from stocks and then rebalances. However, if the returns from bonds have exceeded those from stocks over the previous twelve months, the retiree takes the annual withdrawal from bonds but does not rebalance. Note that both twist versions have a zero-failure rate for retirees making regular withdrawals. In terms of total return, T1 slightly outperforms T2, both twists outperform the simple 90-10, and all crush the performance of the 60-40 portfolio
This article was written by
I am a retired professor, a retired investment adviser, and currently a private investor and full-time tennis pro. I bought my first stock in a custodial account in 1958. I am a student of history, particularly military and economic/market history. The intellectual passions of my retirement years have been markets, mathematics, and quantum theory. Recently I have found myself reading book after book on the thoughts and feelings of animals, and I believe they are subtly influencing some of my views. I have a cat I like a lot. I like to travel. I served in Vietnam.
Disclosure: I/we have a beneficial long position in the shares of BRK.B either through stock ownership, options, or other derivatives. I wrote this article myself, and it expresses my own opinions. I am not receiving compensation for it (other than from Seeking Alpha). I have no business relationship with any company whose stock is mentioned in this article.