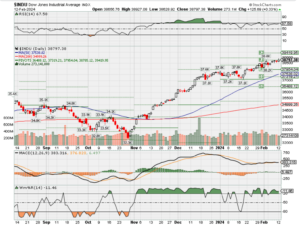
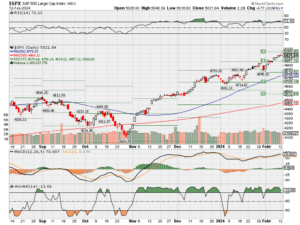
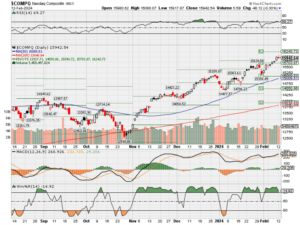
HI Market View Commentary 02-12-2024
Inflation conversation Gov’t is saying inflation is coming down
Up=Durable goods, Meat, Hotels and Travels, Rents, Medical, Professional Services
Down= Gas Price, Some food prices, Home Prices
Gov’t is reporting significantly lower inflation year over year
BUT remember we had 23% one year hike
How many years to get back to 2020ish pricing?= Probably never and yr/yr 3-3.5% for he next decade
META Chart
Core Holdings:
AAPL, BA, BAC, BIDU, DIS, GOOGL, JPM, META, MRO, MU, SQ, UAA
https://www.briefing.com/the-big-picture
The Big Picture
Last Updated: 09-Feb-24 15:14 ET | Archive
Where valuation and concentration risk collide
There is a lot being said about valuation these days. That conversation often revolves around the mega-cap stocks and how they keep stretching to the sky amid some seemingly incessant buying interest that, to be fair, has been catalyzed by some seemingly incessant, good fundamental news.
Their gains have carried the market, not only in terms of price and valuation, but also in terms of sentiment that has rubbed off on other growth stocks.
It is why you also often hear the term “concentration risk” these days, which is to say everyone owns the same names. If these stocks are sold en masse for whatever reason, the market — defined as the market-cap weighted S&P 500 — is going to have some big problems unless the rest of the market benefits at their expense.
There is room, too, for the rest of the market to benefit at their expense, assuming the fundamental news doesn’t turn against the entire market.
A Top-Heavy Market
At the moment, the market-cap weighted S&P 500 is trading at 20.4x forward 12-month earnings. That is a 16% premium to its 10-year average, which, as we have said in the past, has been established in a lower interest rate environment than the one seen today. The equal-weighted S&P 500, meanwhile, is trading at 16.4x forward 12-month earnings. That is in-line with its 10-year average, according to FactSet.
The right side of the first chart is the picture of a top-heavy market. Big gains in the biggest of stocks, which have exceeded the degree to which their earnings estimates have gone up, have translated into multiple expansion.
The second chart goes to show, though, that when the weight of S&P 500 stocks is evenly distributed, valuation is less of a risk factor than what is availing itself in the market-cap weighted S&P 500. That doesn’t mean the equal-weighted S&P 500 won’t go lower in a market correction, but it is apt to lose less ground than the market-cap weighted S&P 500 if the correction is being paced by the mega-cap stocks.
It’s Not 1999
Yet another popular refrain these days is that the market is acting like 1999 (i.e., the irrationally exuberant blow-off stretch that culminated in the start of the dot-com crash in March 2000). Well, the market isn’t in 1999, but some stocks arguably are. In any case, the chart below shows we are really nowhere close to the 1999 experience — certainly not in terms of valuation for the S&P 500 information technology sector.
- The sector trades at 28.4x forward 12-month earnings today. That isn’t cheap, as the chart also shows, but it’s not even half the peak multiple seen in 1999.
- The closer parallel in terms of valuation is 2022, which proved to be a very bad year for the tech sector, because of the Fed’s aggressive rate-hike campaign.
- Now, we are hearing from the Fed that it is likely at the peak of its tightening cycle and is eyeing the possibility of cutting rates later this year.
- Something else we didn’t hear much about in 2022 either is AI. The AI investment theme really got running in 2023 and has served as the rationale for many as to why the sector warrants a premium valuation.
- The market will continue to decide if that’s the case, but the general view is that returns on investment are generally lower when buying at a high valuation.
It Isn’t a Stretch
This leads us to the rest of the market — or the other ten sectors. The charts below offer a 10-year historical valuation view, unlike the one above which needed to be seen for the sake of argument. In the charts below, which are organized by market weight, it will be seen that valuations in most instances aren’t as stretched, relative to historical averages, as the valuation for “the market.”
- The financials sector is trading at 14.9x forward 12-month earnings.
- The health care sector is trading at 19.2x forward twelve-month earnings.
- The consumer discretionary sector is trading at 25.6x forward twelve-month earnings.
- The communication services sector is trading at 18.5x forward twelve-month earnings.
- The S&P 500 industrials sector is trading at 20.4x forward twelve-month earnings.
- The consumer staples sector is trading at 19.7x forward twelve-month earnings.
- The S&P 500 is trading at 11.7x forward twelve-month earnings.
- The S&P 500 real estate sector is trading at 17.1x forward twelve-month earnings.
- The S&P 500 materials sector is trading at 19.3x forward twelve-month earnings.
- The S&P 500 utilities sector is trading at 15.0x forward twelve-month earnings.
What It All Means
It is a big market out there, but the performance of the market’s biggest stocks has skewed “the market’s” valuation. Therefore, the market isn’t necessarily overvalued like the market-cap weighted S&P 500 is.
Why market participants have been slow to embrace the equal-weighted S&P 500 is anyone’s guess. Returns on investment are generally higher when buying at a low valuation.
Everyone loves a winner, though, and the mega-cap stocks, in general, have kept winning. Accordingly, they are attracting fundamental investors just as readily as they are attracting technical investors, quantitative investors, passive investors, active investors, systematic investors, income investors, momentum investors, and so on.
It seems the only investor they aren’t attracting is a fixed-income investor because, well, they are stocks.
The point here is that they are crowd pleasers, which is why it can be a real problem if the crowd turns against them and doesn’t find anywhere else to turn. That is the risk that confronts this remarkable “market” sporting a premium valuation.
—Patrick J. O’Hare, Briefing.com
Earnings dates:
BIDU 2/28
COST 3/07
KO 2/13 BMO
MRO 2/21 est
MU 3/30 est
SQ 2/22
TGT 2/26 est
Where will our markets end this week?
Higher
DJIA – Bullish
SPX –Bullish & Overbought
COMP – Bullish & Overbought
Where Will the SPX end Feb 2024?
01-12-2024 +1.0%
02-06-2024 +1.0%
Earnings:
Mon: WM,
Tues: MAR, TAP, HAS, AKAM, MGM, KO
Wed: CME, KHC, LAD, TWLO, OC
Thur: DASH, ARCH, CROX, DE, SHAK, DKNG, ROKU, YELP
Fri: CNK, PPL
Econ Reports:
Mon: Treasury Budget
Tue CPI, Core CPI, NFIB Small Business Index
Wed: MBA,
Thur: Initial Claims, Continuing Claims, Retail Sales, Retail ex-auto, Capacity Utilization, Industrial Production, NAHB Housing Market Index,
Fri: PPI, Core PPI, Housing Starts, Building Permits, Michigan Sentiment
How am I looking to trade?
Preparing for earning and may run current long put protection OTM
www.myhurleyinvestment.com = Blogsite
info@hurleyinvestments.com = Email
Questions???
China may be making more advanced chips despite U.S. sanctions — but it still faces big problems
PUBLISHED SUN, FEB 11 20246:31 PM EST
KEY POINTS
- China’s biggest chipmaker SMIC seems to have been manufacturing advanced chips in the last few months — defying U.S. sanctions designed to slow down Beijing’s progress.
- But there are still some major challenges to China’s bid to become more self-sufficient in the semiconductor industry, with questions swirling around the long-term viability of its latest advancements.
China’s biggest chipmaker SMIC seems to have been manufacturing advanced chips in the last few months — defying U.S. sanctions designed to slow down Beijing’s progress.
But there are still some major challenges to China’s bid to become more self-sufficient in the semiconductor industry, with questions swirling around the long-term viability of its latest advancements.
What’s the latest?
Last year, U.S.-sanctioned Chinese tech giant Huawei launched the Mate 60, a smartphone with 5G connectivity and a chip, manufactured by Semiconductor Manufacturing International Co., using a 7 nanometer process.
SMIC is China’s biggest contract semiconductor manufacturer. The nanometer figure refers to the size of each individual transistor on a chip. The smaller the transistor, the more of them can be packed onto a single semiconductor. Typically, a reduction in nanometer size can yield more powerful and efficient chips.
The 7 nanometer process is seen as highly advanced in the world of semiconductors, even though it isn’t the latest technology.
It was a big deal at the time. But last week, the Financial Times reported that SMIC is setting up new production lines to make 5 nanometer chips for Huawei. That would signal even further advancement for China’s biggest chipmaker.
The chips in Apple’s latest high-end iPhones are made on a 3 nanometer process.
Why is this a big deal?
U.S. sanctions have been designed to slow China’s ability to make the world’s most advanced chips as technological competition between the two nations continues to heat up.
The company was put on a U.S. trade blacklist called the Entity List in 2020, which has cut SMIC off from key foreign technology that would allow it to make more advanced chips.
In October last year, the U.S. tightened restrictions to prevent the sale of artificial intelligence chips and semiconductor tools to China.
And the U.S. has pressured other countries to impose similar restrictions. One of the biggest moves was from the Netherlands last year to formally introduce export restrictions on “advanced” semiconductor manufacturing equipment.
The Netherlands is home to ASML, a company that makes a so-called extreme ultraviolet (EUV) lithography machines, a tool critical in making the most advanced chips at scale and cost-effectively.
But the Dutch restrictions went further by restricting export of some less advanced lithography machines.
How is SMIC doing this?
Without EUV tools, experts thought, SMIC would find it difficult to make 7 nanometer and smaller chips, or would at least find it expensive to do so.
So when the Huawei Mate 60 came out last year with a 7 nanometer chip, that raised a lot of eyebrows.
One expert told CNBC at the time that SMIC is likely using older chipmaking tools to make more advanced chips.
The FT reported something similar last week. The newspaper, citing two people with knowledge of the plans, reported that SMIC is aiming to use its existing stock of U.S.- and Dutch-made semiconductor equipment to produce 5 nanometer chips, an advancement on the 7 nanometer.
“SMIC is working very closely now with both domestic tool makers, leveraging its existing base of advanced lithography gear, and drawing on other outside expertise, such as from Huawei, to constantly improve yields on advanced node processes,” Paul Triolo, an associate partner at consulting firm Albright Stonebridge, told CNBC via email.
“So for now it is possible for SMIC to continue to improve capabilities and yields at 7 and soon 5 nm, for a small number of customers, mostly Huawei.”
China’s challenges
Using older equipment to make more advanced chips poses two major challenges.
The first is that it’s more expensive to produce the semiconductors than if more advanced tools and machinery were used. The second is an issue around yield — the number of usable chips that are produced and can be sold to customers. With older equipment, the yield is also lower.
The FT also reported, citing three people close to Chinese chip companies, that SMIC had to charge 40% to 50% more for products from its 5 nanometer and 7 nanometer production processes than TSMC does at the same nodes.
TSMC, or Taiwan Semiconductor Manufacturing Company, is the world’s largest and most advanced contract chip manufacturer. TSMC makes semiconductors for companies from Apple to Nvidia.
Pranay Kotasthane, chairperson of the high tech geopolitics program at the Takshashila Institution, told CNBC that SMIC and China could keep throwing money at the process, but ultimately, costs will continue to rise with each more advanced generation of chips — unless the company can get its hands on an ASML EUV machine.
“SMIC might overcome current yield issues by investing more money. This investment might even come from governments as this has become an issue of national prestige,” Kotasthane said via email.
“But the extent of underwriting higher costs will only increase with every subsequent generation of chips. The costs will keep compounding unless China finds a major alternative for EUVs.”
Jeff Bezos sells nearly 12 million Amazon shares worth at least $2 billion, with more to come
PUBLISHED SUN, FEB 11 20241:04 PM ESTUPDATED SUN, FEB 11 20241:04 PM EST
Jeff Bezos filed a statement with federal regulators indicating his sale of nearly 12 million shares of Amazon stock worth more than $2 billion.
The Amazon executive chairman notified the U.S. Securities and Exchange Commission of the sale of 11,997,698 shares of common stock on Feb. 7 and Feb. 8.
The collective value of the shares of Amazon, which is based in Seattle where he founded the company in a garage about three decades ago, was more than $2.04 billion, according to the listed price totals.
The stocks were grouped in five blocks between 1 million and more than 3.2 million.
In a separate SEC filing, Bezos listed the proposed sale of 50 million Amazon shares around Feb. 7 with an estimated market value of $8.4 billion.
Bezos stepped down as Amazon’s CEO in 2021 to spend more time on his other projects, including the rocket company, Blue Origin, and his philanthropy. His address on the stock filings is listed as Seattle, although he reportedly.


HI Financial Services Mid-Week 06-24-2014