
HI Market View Commentary 02-06-2024
What do you want out of your life???? Want are you going to do to EARN IT ??
What it takes to trade like Warren Buffett ??? Hours of weekly study, weeks of working the numbers, patience above all
Lesson #6 Putting in the work for Economic and Earnings Events
What’s Happening and why
![]()
META
AAPL, BIDU, DIS, META, MU, UAA
https://www.briefing.com/the-big-picture
The Big Picture
Last Updated: 02-Feb-24 15:31 ET | Archive
Market operating under mostly sunny skies
It is hard to recall a week that had as much market-moving news in it as the past week. We don’t typically do weekly reviews in this column, but the past week has warranted an exception.
Briefing.com’s Page One column provides an analysis of the news and data driving the market. It is written daily and is published before the stock market opens. On Monday, we wondered in that column if it would be rain or shine for the market on the other side of all the news.
Well, now that we are on the other side of the news, we would say that there were some grey clouds at times but, by and large, it was shine for the market.
Supply Lines
It was an overcast day for a good portion of Monday’s trading session, but the Treasury Department provided some sunshine late in the day with a first quarter borrowing estimate of $760 billion in privately-held net marketable debt that was $55 billion less than what it announced in October 2023.
That news was pleasing based on the idea of there being a better supply-demand dynamic. That is, there would be less supply coming to the market than had been thought. The demand side is yet to be determined, but with inflation falling, there was an optimistic sense that the demand will be there when the supply comes to the market.
The Treasury Department followed up on Wednesday with some guidelines in its quarterly refunding announcement for February to April, saying it plans to increase the auction sizes of the 2- and 5-year by $3 billion per month, the 3-year by $2 billion per month, and the 7-year by $1 billion per month. As a result, the auction sizes of the 2-, 3-, 5-, and 7-year will increase by $9 billion, $6 billion, $9 billion, and $3 billion, respectively, by the end of April 2024.
Treasury plans to increase both the new issue and the reopening auction size of the 10-year note by $2 billion and the 30-year bond by $1 billion.
The good news for the Treasury market is that, based on current projected borrowing needs, Treasury does not anticipate needing to make any further increases in nominal coupon or FRN auction sizes, beyond those that were announced on Wednesday, for at least the next several quarters.
Treasury yields reacted favorably to both announcements, moving down across the curve and sending the 10-yr note yield below 4.00% again (until the stronger-than-expected employment report on Friday).
NYCB Creates a Storm
There was a separate development on Wednesday that also helped drive yields lower. We don’t mean the FOMC decision either, although we will get to that in a bit.
The development we are referencing here is the earnings report from New York Community Bank (NYCB). That report didn’t take the market by storm. Rather, it created a storm for the bank stocks and fostered some safe-haven interest in Treasuries.
The issue was exposed in NYCB’s announcement that its provision for credit losses in the fourth quarter totaled $552 million compared to a $62 million provision for the three months ended September 30, 2023. The increase, it said, was primarily attributable to higher net charge-offs, as well as, to address weakness in the office sector, potential repricing risk in the multi-family portfolio, and an increase in classified assets.
The added thunder came in the company’s declaration that it would be cutting its dividend by 70% to $0.05 per common share to build capital.
Instantly, selling efforts rained down on NYCB and other banks, particularly regional banks, as investors worried more banks would be feeling the adverse effects in their loan books of “weakness in the office sector” that would necessitate capital building.
There is more to be flushed out of this story perhaps, but the anxiousness was real with the SPDR S&P Regional Banking ETF (KRE) and the SPDR S&P Bank ETF (KBE) falling as much as 10.7% and 7.8%, respectively, to their worst levels of the week.
Fed Likely to March Past March
Now, about the FOMC meeting on Wednesday… it went pretty much as expected. The FOMC voted unanimously to leave the target range for the fed funds rate unchanged at 5.25-5.50%. It did so with a new rotation of Fed presidents voting in 2024: Bostic (Atlanta), Barkin (Richmond), Daly (San Francisco), and Mester (Cleveland).
Notwithstanding the new representation, there was nothing surprising in that vote, and, we would argue, in a directive that implied the Fed isn’t ready to cut rates just yet.
There was some hope that the directive might be more explicit in signaling a near-term, rate-cut move, but it wasn’t. Instead, the directive declared that, “The Committee does not expect it will be appropriate to reduce the target range until it has gained greater confidence that inflation is moving sustainably toward 2 percent.”
What this implies is that the Fed isn’t predisposed at this point to cut rates in March, and it may not be predisposed to cut rates in May. It needs to see more data to determine if there is going to be a change in policy course.
Sure enough, Fed Chair Powell said almost exactly that in his press conference, noting, “Based on the meeting today, I would tell you that I don’t think it is likely that the Committee will reach a level of confidence by the time of the March meeting to identify March as the time to do that (cut rates), but that is to be seen. So, I wouldn’t call it, you know — when you ask me about in the near term, I am hearing that as March. I would say, I don’t think that is — it is probably not the most likely case, or what we would call the base case.”
This revelation brought some rain to the stock market, but we would posit that this revelation was in the forecast. After all, several Fed officials had indicated in recent weeks that they thought the Fed could proceed carefully with policy decisions; moreover, the probability of a 25-basis points rate cut at the March FOMC meeting had been reduced nearly to a coin toss in the fed funds futures market versus an 88.5% probability seen a month ago.
A “coin toss,” though, suggests the indication from Fed Chair Powell was a genuine disappointment at least to some people, so that disappointment manifested itself in some late day selling on Wednesday.
Over the Hump
Wednesday was some Hump Day for the market. There was the quarterly refunding announcement, a softer-than-expected ADP Employment Change Report for January, a lower-than-expected increase in the Q4 Employment Cost Index, New York Community Bank’s issues, the FOMC meeting and press conference, and the response to the earnings reports from Microsoft (MSFT) and Alphabet (GOOG), which were announced after Tuesday’s close.
Microsoft closed Tuesday at 408.59. It closed Wednesday at 397.58, and as of this writing on Friday, it was trading at 412.21. The translation in that price movement is that the initial reaction to a very good report, which featured 26.3% year-over-year growth in adjusted EPS and a 30% increase in its Azure and other cloud services business, is that it was a sell-the-news response.
Microsoft had risen 9% in January leading up to its report and 25% since its low on October 26. The good news had been priced in, so to speak, but the enduring fundamental strength of its business is what had investors coming back quickly to buy on the weakness.
Alphabet wasn’t as fortunate — at least not yet. It closed on Tuesday at 153.05. It closed Wednesday at 141.80, and as of this writing on Friday, it was trading at 141.99. The knock on Alphabet reportedly is that its ad revenue disappointed and it is budgeting for a large increase in capex spending in 2024 versus 2023 as it continues to invest heavily in AI.
Like Microsoft, Alphabet had also registered some sizable gains ahead of its report, jumping 8.6% in January and 26% from its October 27 low. It, too, was ripe for a sell-the-news response and it got one, although the stock is still holding above its 50-day moving average (140.82).
Some Mega Concentration
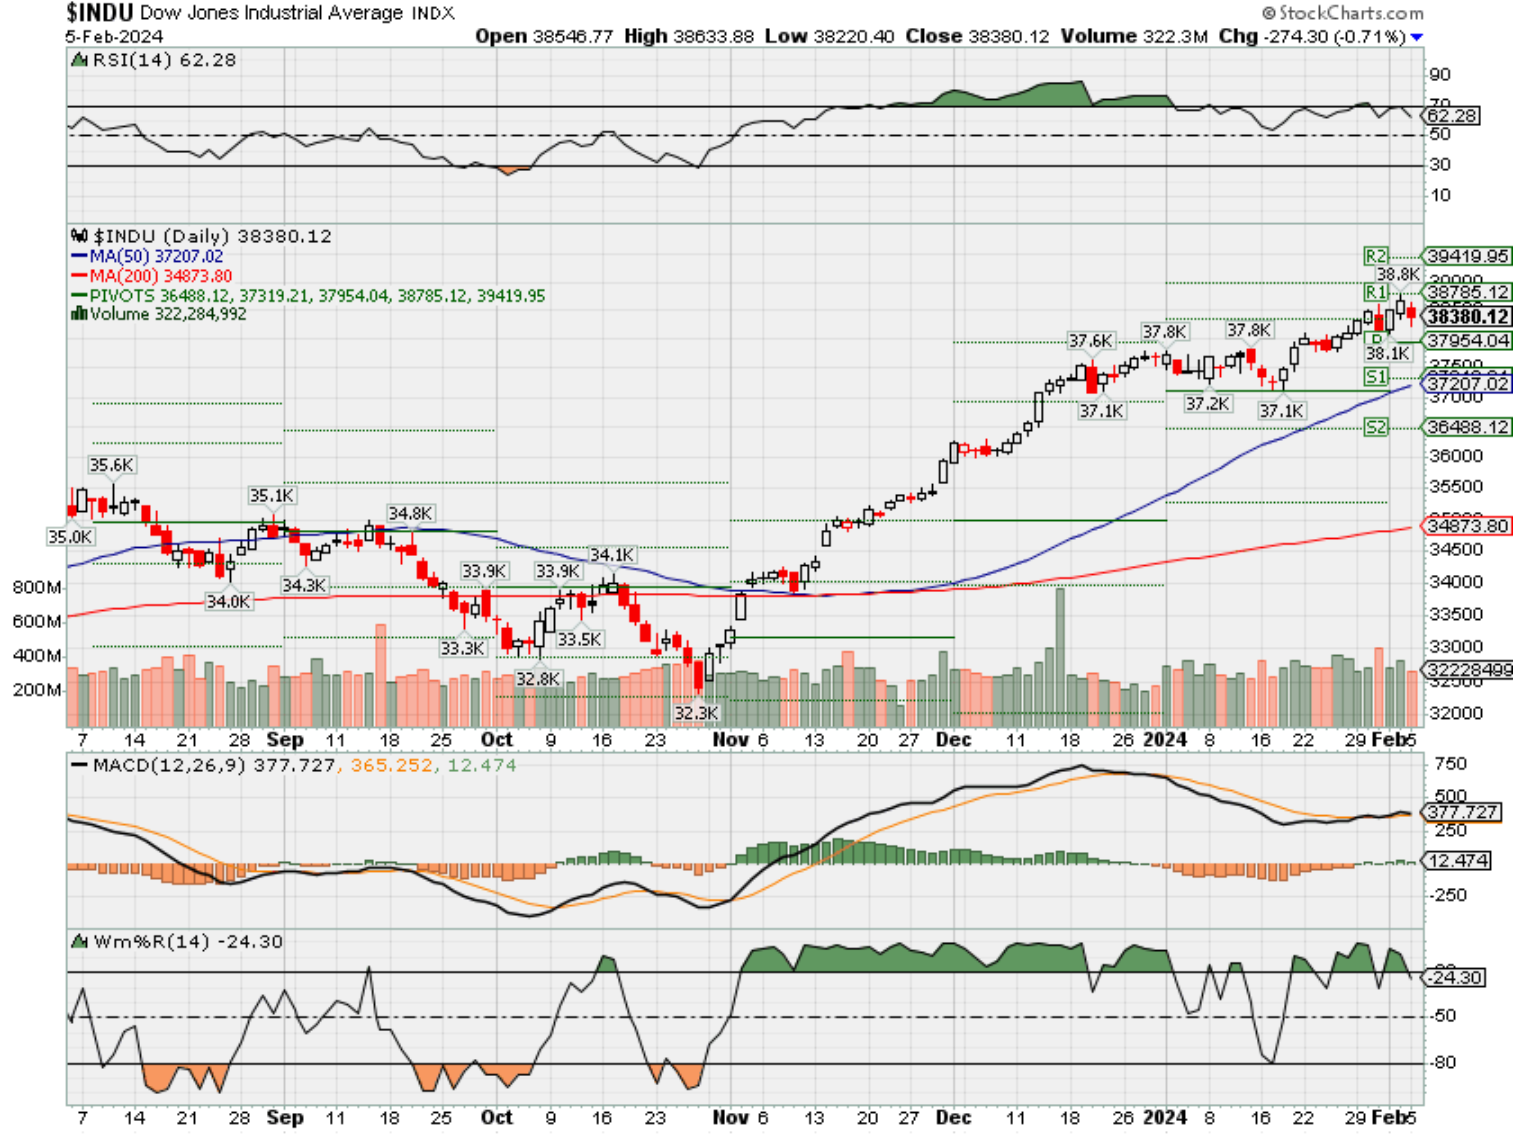
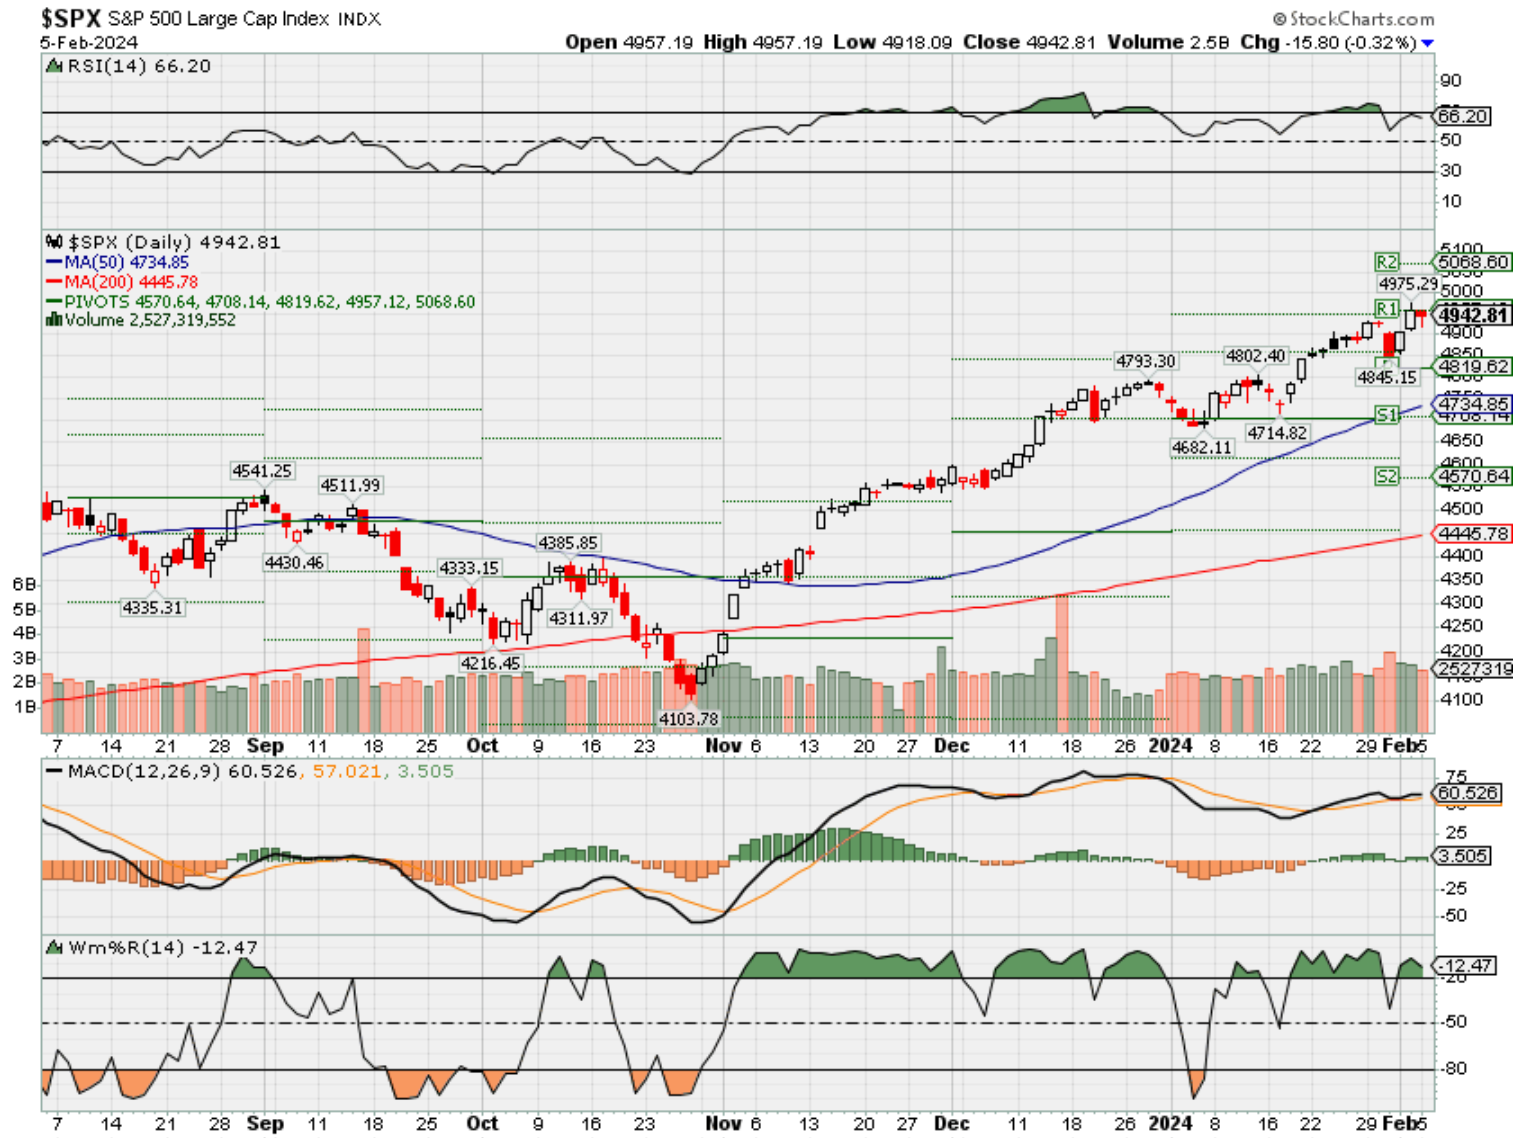
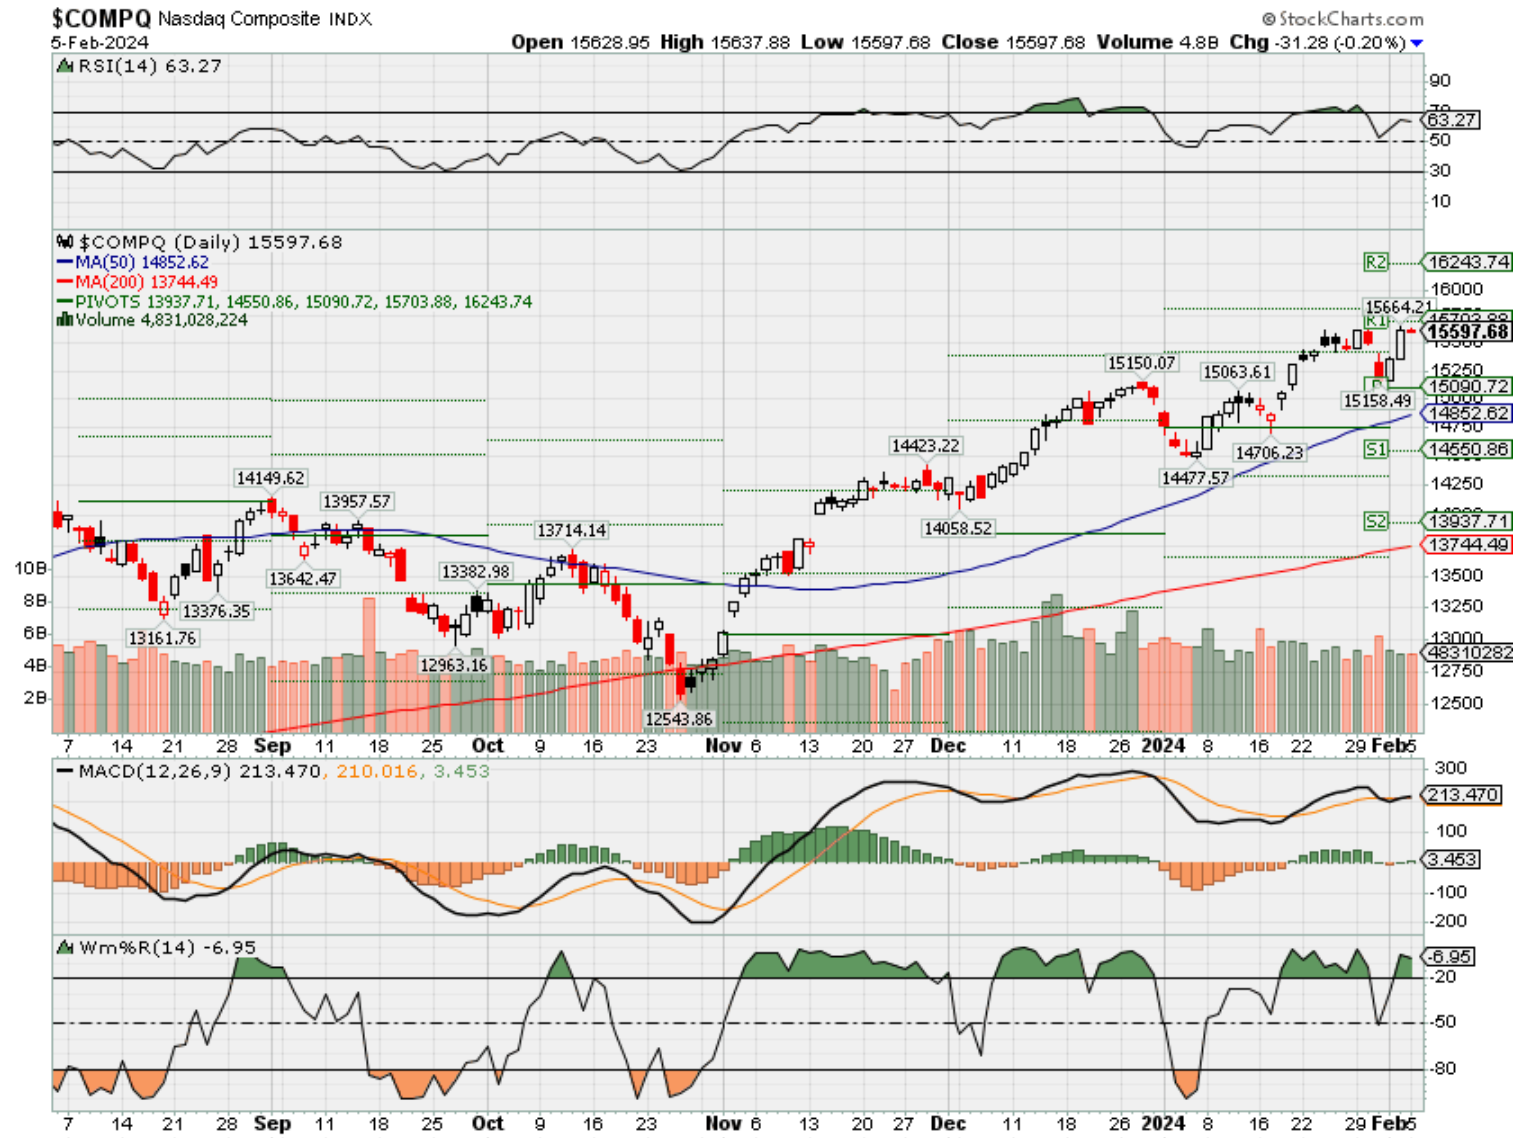
We mentioned that there was some disappointment over Fed Chair Powell’s interest rate view, but that disappointment didn’t last long. The Dow Jones Industrial Average fell 317 points on Wednesday while the S&P 500 dropped 79 points and the Nasdaq Composite declined 346 points.
The Dow Jones Industrial Average gained 369 points on Thursday, the S&P 500 added 60 points, and the Nasdaq Composite reclaimed 197 points. By Friday, though, everything had been recouped and then some, courtesy of some astounding earnings results from Meta Platforms (META) and some impressive results from Amazon.com (AMZN) that offset some okay results from Apple (AAPL).
META was up as much as 23.1%; AMZN was up as much as 8.3%; and AAPL was down as much as 4.1% but had recovered most of that loss as of this writing.
In aggregate, the earnings growth delivered by the five mega-cap companies that reported their results in the past week underscored why there is such concentration in these names. That doesn’t change the fact that there is concentration risk in these names, and that the fallout would be extreme if there ever was a true disappointment (see Tesla), but evidently, that time isn’t now.
The relative — and absolute — strength of these mega-cap leaders, along with NVIDIA (NVDA), continues to leave them in a command position for the market-cap weighted S&P 500, which is up 4.3% in 2024 versus a 0.7% gain for the equal-weighted S&P 500.
Data Recon
Finally, this week’s key economic data tilted very much in a soft landing/no landing way.
- The Consumer Confidence Index was stronger than expected and at its highest level since December 2021.
- The number of job openings seen in the JOLTS Report for December increased to 9.026 million from 8.925 million in November.
- The Q4 Employment Cost Index was up only 0.9%, versus 1.1% in the third quarter, marking its smallest gain since the second quarter of 2021.
- Initial jobless claims increased by 9,000 to 224,000, but that level is still comfortably below claims levels seen in a recession.
- Q4 Productivity increased a solid 3.2% while unit labor costs rose just 0.5%.
- The ISM Manufacturing Index for January increased to 49.1% from 47.1% in December. A number below 50.0% is still indicative of contraction, but the January reading indicates the contraction occurred at a slower pace than the previous month.
- The January Employment Situation Report showed there was a 353,000 increase in nonfarm payrolls. Upward revisions to December and November combined left nonfarm payroll employment 126,000 higher than previously reported.
There has been an increase in layoff announcements, but overall, the labor market continues to provide good signals for the economy that, by one model estimate, isn’t coming in for a landing. The Atlanta Fed GDPNow model estimate for real GDP growth in the first quarter was 4.2% on February 1.
What It All Means
In some respects, the news of the past week suggested that the more things change, the more they stay the same.
- The Treasury Department calmed the market’s supply nerves, as it did in October.
- The disappointment from New York Community Bank served as a reminder that it isn’t a perfect economic environment.
- The Fed’s decision to sit tight with its monetary policy and to wait for more data before making a move is what it has done since last September.
- Most mega-cap companies continue to show with their earnings results why they are investing favorites accorded premium valuations.
- The economic data, on balance, continues to refute recession calls and continues to show welcome inflation trends.
It is still a mega-cap “market,” but it all counts for an index investor no matter how you get there. For the time being, this is a market that continues to operate under mostly sunny skies, which is why everyone is on close watch for rain in the forecast.
—Patrick J. O’Hare, Briefing.com
It is still a market for large cap companies to significantly beat market expectations!!!!
Earnings dates:
BABA 2/21 est
BIDU 2/20 est
COST 3/07
CVS 2/07 AMC
DIS 2/07 AMC
F 2/06 AMC
KO 2/13 BMO
MRO 2/18 est
MU 3/30 est
NVDA 2/21 AMC
PYPL 2/07 AMC
SQ 2/21 est
TGT 2/26 est
TSLA 1/24 AMC
UAA 2/06 est
XOM 2/02 BMO
Where will our markets end this week?
Higher
DJIA – Bullish
SPX –Bullish
COMP – Bullish
Where Will the SPX end Feb 2024?
02-06-2024 +1.0%
Earnings:
Mon: EL, MCD, RMBS
Tues: BP, CMI, LLY, GEHC, HTZ, AMGN, CMG, GILD, SNAP, VFC, YUMC, F
Wed: HLT, YUM, MAT, CVS, PYPL, DIS
Thur: DUK, HSY, HOG, RL, UAA
Fri: PEP
Econ Reports:
Mon: ISM Services,
Tue
Wed: MBA, Trade Balance, Consumer Credit
Thur: Initial Claims, Continuing Claims,
Fri:
How am I looking to trade?
Preparing for earning and may run current long put protection OTM
www.myhurleyinvestment.com = Blogsite
info@hurleyinvestments.com = Email
Questions???
Why didn’t we put protection on Friday for META
“Theory Of Reflexivity” And Does It Matter?
By Lance Roberts | January 30, 2024
Share
I received an email this past week concerning George Soros’ “Theory Of Reflexivity.”
“I am not a fan of Soros, but this market has the look and feel of the dot com bust of 2000. In a few short words, the AI investment phenomenon is feeding on itself just as the internet and fiber did in 1999.”
It’s an interesting question, and I have previously written about the “Theory of Reflexivity.” Notably, this theory begins to resurface whenever markets become exuberant. However, concerning the email, there seems to be a similarity between the current “A.I.” driven speculation and what was seen in the late 90s.
There is, of course, a significant difference between the companies surging higher today versus those in the late 90s. That difference is that those companies involved in the “A.I.” race have revenues and earnings versus many Dot.com darlings that didn’t. Nonetheless, the valuations paid for many companies today, in terms of price-to-sales, are certainly not justifiable. The table below shows all the companies in the S&P 500 index with a price-to-sales ratio above 10x. Do you recognize any you own?
I picked 10x price-to-sales because of what Scott McNeely, then CEO of Sun Microsystems, said in a circa 1999 interview.
“At 10 times revenues, to give you a 10-year payback, I have to pay you 100% of revenues for 10 straight years in dividends. That assumes I can get that by my shareholders. It assumes I have zero cost of goods sold, which is very hard for a computer company. That assumes zero expenses, which is really hard with 39,000 employees. That assumes I pay no taxes, which is very hard. And that assumes you pay no taxes on your dividends, which is kind of illegal. And that assumes with zero R&D for the next 10 years, I can maintain the current revenue run rate. Now, having done that, would any of you like to buy my stock at $64? Do you realize how ridiculous those basic assumptions are?”
This is an important point. At a Price-to-Sales ratio of TWO (2), a company needs to grow sales by roughly 20% annually. That growth rate will only maintain a normalized price appreciation required to maintain that ratio. At 10x sales, the sales growth rate needed to maintain that valuation is astronomical.
While 41 companies in the S&P 500 are trading above 10x price-to-sales, 131 companies (26% of the S&P) trade above 5x sales and must grow sales by more than 100% yearly to maintain that valuation. The problem is that some companies, like Apple (AAPL), have declining revenue growth rates.
While it is believed that “A.I.” is a game changer, this is not the first time we have seen such a “revolution” in the markets.
As shown, there is an end to these cycles, as valuations ultimately matter.
So, what does this have to do with the “Theory of Reflexivity.”
The “Theory Of Reflexivity” – A Rudimentary Theory Of Bubbles
For investors, in the “heat of the moment,” silly notions like “valuations,” “equity risk premiums,” and “revenue growth” matter very little. Such is because, in the very short term, all that matters is momentum. However, over extended periods, valuations are a direct determinant of returns.
Despite one selloff after another leading to increased volatility, the markets are currently hitting all-time highs as the speculative chase for return heats up. However, the current market mentality reminds me much of what Alan Greenspan said about this behavior.
Thus, this vast increase in the market value of asset claims is, in part, the indirect result of investors accepting lower compensation for risk. Market participants too often view such an increase in market value as structural and permanent. To some extent, those higher values may be reflecting the increased flexibility and resilience of our economy. But what they perceive as newly abundant liquidity can readily disappear. Any onset of increased investor caution elevates risk premiums and, as a consequence, lowers asset values and promotes the liquidation of the debt that supported higher asset prices. This is the reason that history has not dealt kindly with the aftermath of protracted periods of low-risk premiums.
Alan Greenspan, August 25th, 2005.
A decline in perceived risk is often self-reinforcing in that it encourages presumptions of prolonged stability and thus a willingness to reach over an ever-more extended time period. But, because people are inherently risk averse, risk premiums cannot decline indefinitely. Whatever the reason for narrowing credit spreads, and they differ from episode to episode, history caution’s that extended periods of low concern about credit risk have invariably been followed by reversal, with an attendant fall in the prices of risky assets. Such developments apparently reflect not only market dynamics but also the all-too-evident alternating and infectious bouts of human euphoria and distress and the instability they engender.
Alan Greenspan, September 27th, 2005.
Once again, investors accept a low equity risk premium for market exposure. (Data courtesy of Aswath Damodaran, Stern University)
Such brings us to George Soros’ “Theory Of Reflexivity.”
“First, financial markets, far from accurately reflecting all the available knowledge, always provide a distorted view of reality. The degree of distortion may vary from time to time. Sometimes it’s quite insignificant, at other times, it is quite pronounced. When there is a significant divergence between market prices and the underlying reality, there is a lack of equilibrium conditions.
I have developed a rudimentary theory of bubbles along these lines. Every bubble has two components: an underlying trend that prevails in reality and a misconception relating to that trend. When a positive feedback develops between the trend and the misconception, a boom-bust process is set in motion. The process is liable to be tested by negative feedback along the way, and if it is strong enough to survive these tests, both the trend and the misconception will be reinforced. Eventually, market expectations become so far removed from reality that people are forced to recognize that a misconception is involved. A twilight period ensues during which doubts grow and more and more people lose faith, but the prevailing trend is sustained by inertia. As Chuck Prince, former head of Citigroup, said, ‘As long as the music is playing, you’ve got to get up and dance. We are still dancing.’ Eventually, a tipping point is reached when the trend is reversed; it then becomes self-reinforcing in the opposite direction.
Typically bubbles have an asymmetric shape. The boom is long and slow to start. It accelerates gradually until it flattens out again during the twilight period. The bust is short and steep because it involves the forced liquidation of unsound positions.”
The chart below is an example of asymmetric bubbles.
Soros’ view on the pattern of bubbles is interesting because it changes the argument from a fundamental to a technical view. Let me explain.
Bubbles And Exuberance
Prices reflect the psychology of the market, which can create a feedback loop between the markets and fundamentals. As Soros stated:
“Financial markets do not play a purely passive role; they can also affect the so-called fundamentals they are supposed to reflect. These two functions, that financial markets perform, work in opposite directions. In the passive or cognitive function, the fundamentals are supposed to determine market prices. In the active or manipulative function market, prices find ways of influencing the fundamentals. When both functions operate at the same time, they interfere with each other. The supposedly independent variable of one function is the dependent variable of the other, so that neither function has a truly independent variable. As a result, neither market prices nor the underlying reality is fully determined. Both suffer from an element of uncertainty that cannot be quantified.”
The chart below utilizes Dr. Robert Shiller’s stock market data going back to 1900 on an inflation-adjusted basis. I then looked at the markets before each significant market correction and overlaid the asymmetrical bubble shape, as discussed by George Soros.
Of course, what each of those previous periods had in common were three things:
- High valuation levels (chart 1)
- Large deviations from the long-term exponential growth trend of the market. (chart 2)
- High levels of investor exuberance which drive chart 1 and 2.
The S&P 500 trades in the upper 90% of its historical valuation levels.
However, since stock market “bubbles” reflect speculation, greed, and emotional biases, valuations only reflect those emotions. As such, price becomes more reflective of psychology. From a “price perspective,” the level of “greed” is on full display as the S&P 500 trades at one of the most significant deviations on record from its long-term exponential trend. (Such is hard to reconcile, given a 35% correction in March 2020 and a 20% decline in 2022.)
Historically, all market crashes have resulted from things unrelated to valuation levels. Issues such as liquidity, government actions, monetary policy mistakes, recessions, or inflationary spikes are the culprits that trigger the “reversion in sentiment.”
Notably, the “bubbles” and “busts” are never the same.
Comparing the current market to any previous period is rather pointless. Is the current market like 1995, 1999, or 2007? No. Valuations, economics, drivers, etc., all differ from one cycle to the next.
Critically, the financial markets adapt to the cause of the previous “fatal crashes.” However, that adaptation won’t prevent the next one.
Conclusion
There is currently much debate about the health of financial markets. Can prices remain detached from the fundamentals long enough for the economic/earnings recession to catch up with prices?
Maybe. It has just never happened.
The speculative appetite for “yield,” fostered by the Fed’s ongoing interventions and suppressed interest rates, remains a powerful force in the short term. Furthermore, investors have now been successfully “trained” by the markets to “stay invested” for “fear of missing out.”
The speculative risks and excess leverage increase leave the markets vulnerable to a sizable correction. The only missing ingredient for such a correction is the catalyst that starts the “panic for the exit.”
It is all reminiscent of the 1929 market peak when Dr. Irving Fisher uttered his famous words: “Stocks have now reached a permanently high plateau.” The clamoring of voices proclaiming the bull market still has plenty of room to run tells the same story. History is replete with market crashes that occurred just as the mainstream belief made heretics out of anyone who dared to contradict the bullish bias.
When will Soros’ “Theory of Reflexivity” affect the market? No one knows with any certainty. But what we do know with certainty is that markets are affected by gravity. Eventually, for whatever reason, what goes up will come down.
Make sure to manage your portfolio risk accordingly.
Lance Roberts is a Chief Portfolio Strategist/Economist for RIA Advisors. He is also the host of “The Lance Roberts Podcast” and Chief Editor of the “Real Investment Advice” website and author of “Real Investment Daily” blog and “Real Investment Report“. Follow Lance on Facebook, Twitter, Linked-In and YouTube
Fed Chief Jerome Powell says a March rate cut is not likely
PUBLISHED WED, JAN 31 20243:05 PM ESTUPDATED WED, JAN 31 20243:59 PM EST
Jesse Pound@/IN/JESSE-POUND@JESSERPOUND
KEY POINTS
- “I don’t think it’s likely that the committee will reach a level of confidence by the time of the March meeting” to cut rates, Powell said.
- The Fed Chair said earlier in a press conference that rate cuts would likely begin at some point this year.
- Stocks fell to their session lows as the Fed chief dashed hopes of traders who want the central bank to slash rates sooner, before there’s a recession.
Fed Chairman Jerome Powell said Wednesday that the central bank would likely not be comfortable enough with the path of inflation by its next meeting in March to cut interest rates.
“Based on the meeting today, I would tell you that I don’t think it’s likely that the committee will reach a level of confidence by the time of the March meeting to identify March as the time to do that. But that’s to be seen,” Powell said.
The statement came in a news conference after the Fed’s January meeting, where the central bank left its benchmark interest rate unchanged. Powell did say earlier in the news conference that rate cuts would likely begin at some point this year.
Stocks fell to their session lows as the Fed chief dashed hopes of traders who want the central bank to slash rates sooner, before there’s a recession. The Dow Jones Industrial Average lost 300 points at one point.
The Fed’s policy statement released earlier Wednesday included several tweaks that suggested the central bank was taking further rate hikes off the table but not yet ready to cut. Powell’s comments appeared to clarify for traders that the stance would continue for at least one more meeting.
“The Fed was badly burned in late 2021 and 2022 when they thought high inflation would be transitory, then got caught by surprise when it was higher and more persistent than expected. They want to avoid making the same mistake twice,” Comerica Bank’s chief economist, Bill Adams, said in a note Wednesday afternoon.
“The Fed will wait to pull the trigger on rate cuts until they see the whites of 2% inflation’s eyes,” Adams added.
Powell also declined to commit to a series of rate cuts once the Fed makes its first move, saying that it “would depend on the data.”
The central bank’s next two policy decision dates are scheduled for March 20 and May 1. In recent months, traders and Wall Street strategists have focused on those two meetings as likely candidates for the first rate cut, as inflation continues to fall and job growth slows.
The Fed’s preferred inflation gauge, the personal consumption expenditures price index, is updated near the end of each month. There will likely be only one more PCE reading before the Fed’s March meeting, but three more before May.
There will also be three more federal jobs reports released before the May meeting, with the January report due out on Friday.
Meta is paying first-ever dividend, authorizes $50 billion buyback
PUBLISHED THU, FEB 1 20244:06 PM ESTUPDATED 4 HOURS AGO
Rohan Goswami@IN/ROHANGOSWAMICNBC/@ROGOSWAMI
KEY POINTS
- Meta will pay a 50 cent dividend, its first ever, and has authorized a $50 billion share buyback.
- The expanded buyback is equivalent to roughly 5% of outstanding shares, based on Meta’s $1 trillion market cap.
- Meta will pay the cash dividend on a quarterly basis, the company said.
Meta announced on Thursday that it will pay a quarterly dividend for the first time, and said it authorized an expanded $50 billion share buyback program.
The company will pay a per share dividend of 50 cents, joining peers Apple, Microsoft and Oracle, which all have regular payouts. The board intends to issue a cash dividend on a quarterly basis, “subject to market conditions.”
Meta announced the news alongside its fourth-quarter financials, which topped estimates on the top and bottom lines.
“Introducing a dividend just gives us a more balanced capital return program and some added flexibility in how we return capital in the future,” Chief Financial Officer Susan Li told analysts on the company’s earnings call.
Shares rose more than 14% in extended trading. The dividend will be paid in March to all shareholders of record as of Feb. 22.
The after-market rally continues a boom in Meta’s stock after the company’s market cap almost tripled in 2023. The stock eclipsed its 2021 record last month.
With a current market capitalization of $1 trillion, the expanded authorization is equal to about 5% of shares outstanding. The company had $30.9 billion available for share repurchases as of December.
Neither Amazon nor Alphabet have ever paid a dividend. Microsoft issued its first dividend in 2003, while Oracle’s was initiated in 2009.
The uphill battle for American workers and the push for the Retirement Savings for Americans Act
By Emma Pitts, Deseret News | Posted – Feb. 4, 2024 at 7:03 p.m.
The amount of savings Americans think they need to retire comfortably rises each year, with the latest amount being $1.8 million. (Adobe.com)
SALT LAKE CITY — Having enough savings to be capable of retiring someday may be turning into a pipe dream for many Americans. The amount of savings Americans think they need to retire comfortably rises each year, with the latest amount being $1.8 million, according to a Charles Schwab survey.
“While this amount hasn’t shifted drastically, only 37% of workers think it’s very likely they’ll achieve this target, down by 10% from last year at $1.7 million,” the survey said.
The U.S. retirement system places a significant emphasis on individual responsibility for retirement savings. The adequacy of retirement income often depends on personal savings habits, investment choices and the types of retirement plans available through employment.
Data from the Economic Innovation Group found that in 2021, “69 million — or 55.5% — of workers lacked any kind of employer-provided retirement plan, a group made up disproportionately of low-income earners.”
The data also found that states had different access to retirement plans provided by employers.
Idaho was the best state, with 47% of the state’s low-income workforce having access to an employer-provided retirement plan, while Florida was the worst state at 23%.
Utah had a 30% share of low-income workers with access to an employer-provided retirement plan, but only 16% participated, and 260,134 low-income workers do not have access at all.
“Roughly 40 million Americans lack access to an employer-sponsored retirement plan, which represents a significant roadblock to achieving financial security for their retirement,” Sen. Thom Tillis, R-N.C., said in a press release.
Thillis, along with Sen. John Hickenlooper, D-Colo., and Reps, Lloyd Smucker, R-Pa., and Terri Sewell, D-Ala., introduced the Retirement Savings for Americans Act to Congress for the second time last year after first introducing it to the Senate in 2022.
What is RSAA?
The Retirement Savings for Americans Act is a bipartisan bill introduced to improve retirement security and financial well-being for low- and middle-income American workers.
Key provisions of this act include the following:
- Eligibility and auto enrollment: The act targets full- and part-time workers who do not have access to an employer-sponsored retirement plan. These workers would be eligible for an account and automatically enrolled, with contributions set at 3% of their income. They have the option to adjust this contribution rate or opt out entirely, and independent workers, such as gig workers, are also included in this eligibility.
- Federal contribution: To support low- and moderate-income workers, the act proposes a 1% automatic contribution and up to a 4% matching contribution via a refundable federal tax credit. This benefit starts to decrease at median income levels.
- Portability: One key benefit of the program is the portability of the accounts. They remain with the workers throughout their careers, allowing them to stop and start contributions as needed.
- Private assets: The accounts are the property of the worker, and the assets can be passed down to future generations, aiding in wealth and financial security building.
- Investment options: The act provides a range of investment options similar to those in the current Thrift Savings Plan. These include low-fee investment choices like lifecycle funds, which are aligned with the worker’s estimated retirement date, and index funds composed of stocks and bonds.
“Americans who work hard their entire lives deserve to retire with dignity,” Hickenlooper said, per 401K Specialist. “This bill helps low-income workers enjoy a secure retirement and fulfill their American dream.”
RSAA has received big-name endorsements
The act has garnered support from various sectors and organizations, reflecting a bipartisan interest in improving the U.S. retirement savings system.
In October, American multinational financial services company Charles Schwab offered its strong support for the act.
“Creating this kind of program meets an obligation we all share to help every working American build financial security and well-being in retirement. I also know it will offset future support we surely would have to provide if we don’t help more people begin to build that security today,” founder and co-chairman Charles Schwab said in his support letter.
“And in true American spirit, it isn’t a giveaway, but an incentive for working individuals to begin helping themselves and their families,” he added.
A prominent nonprofit and nonpartisan organization, the American Association of Retired Persons, is the latest company to fully endorse the Retirement Savings for Americans Act.
“Nearly 1 out of 4 Americans has no retirement savings, and more than half of all Americans report they are concerned they will not achieve financial security in retirement. We know that Americans are much more likely to save when they have access to retirement savings options at work. Today, nearly half of all private-sector employees do not have access to an employer-sponsored retirement savings program,” Bill Sweeney, senior vice president of government affairs at AARP, said in the RSAA endorsement letter.