
HI Market View Commentary 02-27-2023
What is the durables good economic report?= Big ticket items, things you only buy once in a blue moon
Durable goods -4.5 vs est -3.9
Durable goods ex-trans +0.7 vs est +0.1
Today the S&P ranged between +1.22 down to +0.19 finishing up 0.31
We don’t have good news into the future 3/22 FOMC rate hike 25%
What if the FOMC raises the rate by 50 basis points?
Our market is set for a big 10% run or more, IF the FOMC says that are pausing rate hike for a period of time
How much damage will be done between now and then ? Put protection on EVERYTHING
Right now we are protected through all of February/Earnings and will be protected for Mar 22nd rate hike
Earnings dates:
MU – 3/29
https://www.briefing.com/the-big-picture
The Big Picture
Last Updated: 24-Feb-23 13:47 ET | Archive
Inflation is sticky business
First, the relatively good news: core-CPI, which excludes food and energy, moderated to 5.6% year-over-year in January from 5.7% in December. That was the smallest 12-month increase since December 2021 and down from the peak rate of 6.6% seen in September 2022.
Second, the relatively bad news: the core-PCE Price Index, which excludes food and energy and is the Fed’s preferred inflation gauge, increased to 4.7% year-over-year in January from 4.6% in December.
Third, the bad news: services inflation, seen in the CPI report, is still rising, up 7.6% year-over-year and sitting at its highest level since August 1982.
That’s a problem and the Fed knows it because services inflation can be sticky. It is a principal reason why the Fed is keen on seeing wage growth moderate more since higher wages often drive higher prices as companies aim to protect profit margins.
That worry is also a principal reason why the Fed has been sticking it to the market with rate hikes.
At Your Service(s)
The stock market is anxious to see the Fed pause its rate hikes. The Fed, however, isn’t making any promises. The only implied promise now from the Fed is that it will raise rates again at its March FOMC meeting.
There also seems to be an implied promise from the Fed that it won’t be cutting rates anytime soon. The chart below is the Fed’s sticking point on that front.
The inflation rates for total services, services less rent of shelter, and services less energy services are all north of 7.0%. The Fed’s overall inflation target is 2.0%, so when inflation in the services sector, which comprises the largest swath of the U.S. economy, is north of 7.0%, it is little wonder that the Fed isn’t communicating an inclination to cut rates anytime soon.
The Treasury market was a lot quicker than the stock market to process that position following the much stronger-than-expected January employment report, which was followed by a stronger than expected ISM Services PMI, and January CPI, PPI, and PCE Price Index data that exuded signs of stickiness on the inflation front.
The 2-yr note yield, sitting at 4.10% in front of the employment report, is at 4.80% today, up 38 basis points for the year.
The stock market finally looks to be falling in-line with this reality. The S&P 500 is down 3.0% in February, recognizing that it got ahead of itself with a January rally that was predicated on the Fed pausing its rate hikes soon and then cutting rates once, if not twice, before the end of the year.
Eye on Wages
One Fed official after another has conceded that inflation is still too high, that more work needs to be done to get it back down to the 2.0% target, and that the Fed is committed to doing that.
An area that is being watched closely is wage growth. There has been some moderation in wages but not enough yet in Fed Chair Powell’s view that would be consistent with a 2.0% inflation rate. He hasn’t specifically quantified the wage growth he would like to see, but if the chart below were any guide, we would venture to guess it is in the neighborhood of average hourly earnings growth being up 2-3% year-over-year. In January, average hourly earnings were up 4.4% year-over-year.
The sticking point in this desire is that, when the core-PCE Price Index was stuck between being up 1.0-2.0% year-over-year, there was also globalization, more immigration, and more workers in the workforce.
Now, there is a trend of de-globalization, tighter restrictions on immigration, and fewer workers in the workforce given retiring baby boomers, COVID complications, and the opioid crisis. Hence, there is a huge number of job openings and a seeming scarcity of workers to fill those jobs, which threatens to keep wage growth sticking at higher levels for longer as employers compete to fill those openings.
What It All Means
Consumers and businesses are stuck with inflation. Granted overall inflation pressures aren’t as pronounced as they were last year, but services inflation is and then some.
That’s a sticking point on the road to the Fed’s 2.0% target, which is a road we expect the Fed to drive in a committed manner knowing it allowed inflation to go off road by waiting too long to remove its policy accommodation. The Fed doesn’t want to make another driving mistake, which in its mind means doing too little right now rather than doing too much.
This approach is going to create some bumps for the stock market and bond market alike. It already has. There are likely more bumps ahead, though, because the Fed is not done sticking it to the market with rate hikes. Furthermore, with services inflation as high as it still is, the market looks poised to be stuck with higher rates for longer than it previously expected.
—Patrick J. O’Hare, Briefing.com
https://go.ycharts.com/weekly-pulse
| Market Recap |
| WEEK OF FEB. 20 THROUGH FEB. 24, 2023 |
| The S&P 500 extended its losing streak to a third consecutive week as heightened concerns surrounding the Federal Reserve’s campaign against inflation and its effect on the economy weighed on Wall Street.
The benchmark index closed 2.7% lower at 3,970.04 from last week’s close of 4,079.09 with all but the energy sector ending the week in the red. This was the first time since December the index has closed lower for three straight weeks. The holiday-shortened week kicked off with a sales warning from Home Depot (HD) in which the home improvement retailer said comparable sales growth would be flat in 2023. The stock sold off sharply, dragging down the consumer discretionary sector. Weighed down further by disappointing Q4 sales from Domino’s Pizza (DPZ) and production issues with General Motors (GM), the consumer discretionary sector was down 4.44% last week, making it the worst-performing sector within the S&P. Financial stocks continued to face headwinds as lingering concerns of a Fed-fueled recession coupled with the likelihood that the interest rate premium for banking stocks from higher interest rates is already priced in drove the entire sector down 2% for the week. Led by losses in Boeing (BA) and Southwest Airlines (LUV), industrials were down 2.7% for the week, while the utility sector closed the week with a loss of 2.8% as a consequence of the sector’s sensitivity to higher borrowing costs. Fueled by growth in its data center business, shares of Nvidia (NVDA) rallied 14% on Thursday and closed the week with an 8.9% gain. That wasn’t enough to offset losses in shares of Intel (INTC) after the chipmaker cut its dividend and Keysight Technologies (KEYS) which spooked investors with its lackluster Q2 revenue guidance. Accordingly, the technology sector was down 2.7% from the prior week’s close. Better-than-expected earnings from Coterra Energy (CTRA) and Diamondback Energy (FANG) helped prop up the energy sector, which finished out the week up 0.2%, and the only sector to close in positive territory. Last week’s economic data was eclipsed by the minutes from the February Federal Open Market Committee meeting that showed the committee remained committed to higher interest rates to curb inflation. Wall Street is expecting another 25-basis-point rate hike in March, May and June, which would push the terminal rate as high as 5.5%. Next week’s heavy economic calendar includes pending home sales Monday, home prices and consumer confidence Tuesday, the purchasing manager’s and ISM manufacturing indices Wednesday, non-farm productivity on Thursday, and the services sector PMIs Friday. On the earnings front, focus shifts to the retail sector with results from AutoZone (AZO), Advance Auto (AAP), Target (TGT), Urban Outfitters (URBN), Lowe’s (LOW), Kohl’s (KSS), Best Buy (BBY) and Macy’s (M). Tech heavy-hitters Salesforce (CRM), Dell (DELL) and Broadcom (AVGO) also report next week. Provided by MT Newswires |
Where will our markets end this week?
Lower
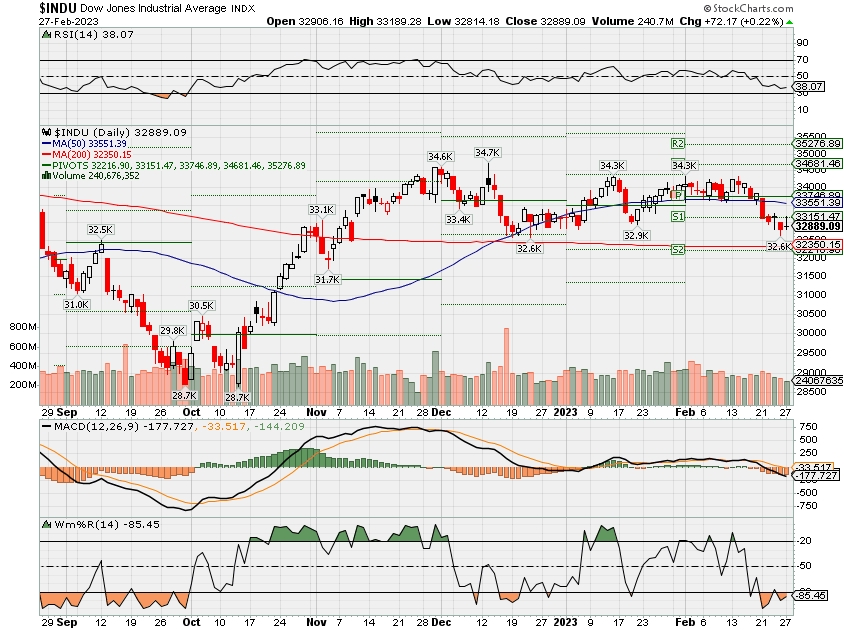
DJIA – Bearish
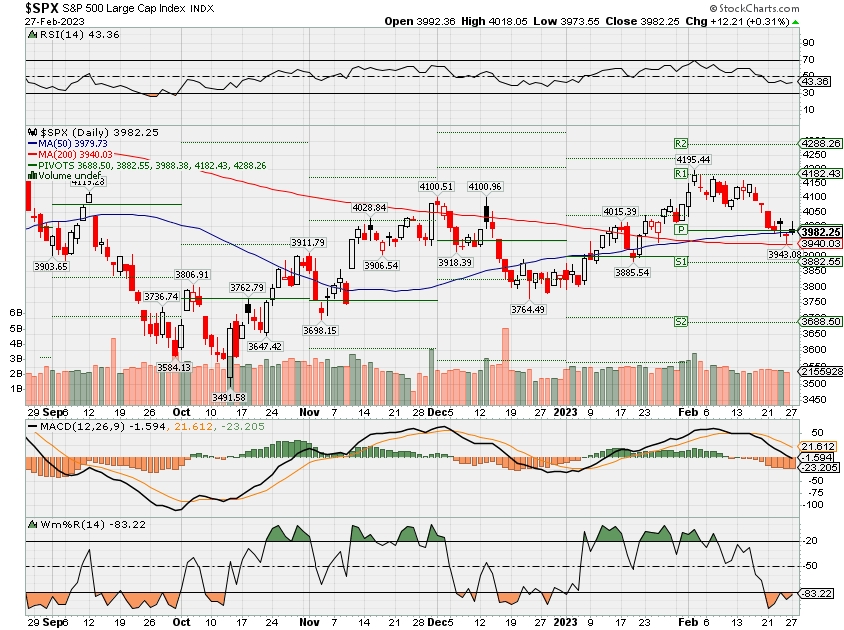
SPX –Bearish
Golden Cross vs. Death Cross: What’s the Difference?
By
Updated August 25, 2022
Reviewed by
Fact checked by
Golden Cross vs. Death Cross: An Overview
The use of statistical analysis to make trading decisions is the core of technical analysis. Technical analysts use a ton of data, often in the form of charts, to analyze stocks and markets. At times, the trend lines on these charts curve and cross in ways that form shapes, often given funny names like “cup with handle,” “head and shoulders,” and “double top.” Technical traders learn to recognize these common patterns and what they might portend for the future performance of a stock or market.
A golden cross and a death cross are exact opposites. A golden cross indicates a long-term bull market going forward, while a death cross signals a long-term bear market. Both refer to the solid confirmation of a long-term trend by the occurrence of a short-term moving average crossing over a major long-term moving average.
KEY TAKEAWAYS
- A golden cross suggests a long-term bull market going forward, while a death cross suggests a long-term bear market.
- Either crossover is considered more significant when accompanied by high trading volume.
- Once the crossover occurs, the long-term moving average is considered a major support level (in the case of the golden cross) or resistance level (in the instance of the death cross) for the market from that point forward.
- Either cross may occur as a signal of a trend change, but they more frequently occur as a strong confirmation of a change in trend that has already taken place.
- Traders use both death crosses and golden crosses to help determine when to enter and exit an asset.
Golden Cross
The golden cross occurs when a short-term moving average crosses over a major long-term moving average to the upside and is interpreted by analysts and traders as signaling a definitive upward turn in a market. Basically, the short-term average trends up faster than the long-term average, until they cross.
There are three stages to a golden cross:
- A downtrend that eventually ends as selling is depleted
- A second stage where the shorter moving average crosses up through the longer moving average
- Finally, the continuing uptrend, hopefully leading to higher prices
Death Cross
Conversely, a similar downside moving average crossover constitutes the death cross and is understood to signal a decisive downturn in a market. The death cross occurs when the short-term average trends down and crosses the long-term average, basically going in the opposite direction of the golden cross.
Special Considerations
There is some variation of opinion as to precisely what constitutes this meaningful moving average crossover. Some analysts define it as a crossover of the 100-day moving average by the 50-day moving average; others define it as the crossover of the 200-day average by the 50-day average.
Analysts also watch for the crossover occurring on lower time frame charts as confirmation of a strong, ongoing trend. Regardless of variations in the precise definition or the time frame applied, the term always refers to a short-term moving average crossing over a major long-term moving average.
How Do You Calculate a Golden Cross?
A golden cross occurs on a stock chart when the 50-day moving average moves up towards the 200-day moving average and crosses it. This is noted as a bullish scenario and indicates a buy signal with the expectation that the upward trend will continue.
Is a Death Cross a Good Time to Buy?
A death cross signals a bearish market or asset and can be a good time to buy. Many investors purchase assets when the value of those assets has dropped, but with the expectation that the value will go up again in the future, based on their analysis. There can be many reasons why an asset drops in price, however, that doesn’t necessarily signal a weak asset, but possibly a weak environment. Once the environment corrects, an asset can go up in value. If you manage to buy it on a dip, then you may see a return on your investment.
What Timeframe Is Best for a Golden Cross?
Golden crosses can be analyzed under many different time frames depending on the trader and what is being analyzed. Day traders typically use smaller time frames, such as five minutes or 10 minutes, whereas swing traders use longer time frames, such as five hours or 10 hours.
The Bottom Line
Golden crosses and death crosses are used in trading and are a form of technical analysis. A golden cross signals a bull market and a death cross signals a bear market. Both of these are determined by the confirmation of a long-term trend from the occurrence of a short-term moving average crossing over a major long-term moving average. Both crosses help traders in making investment decisions, particularly knowing when to enter and exit a trade.
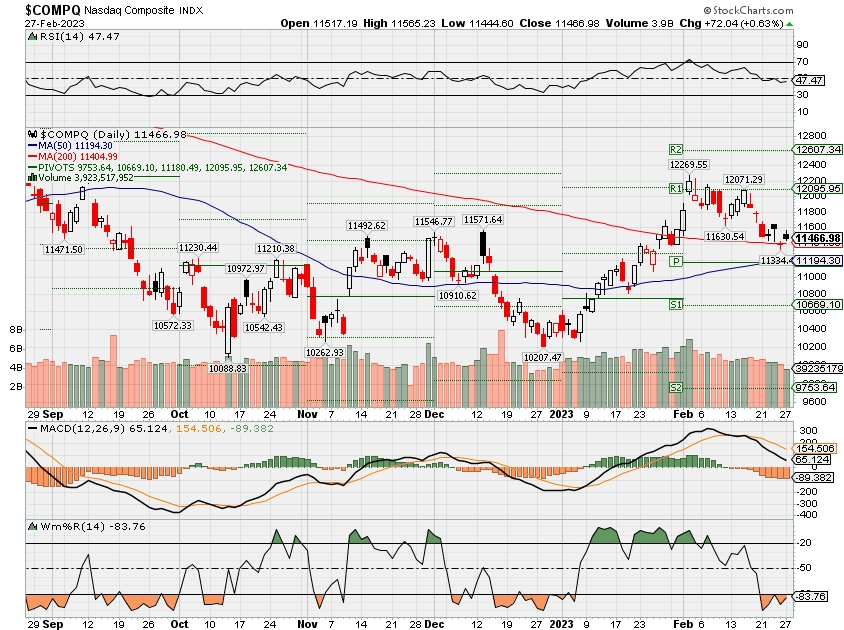
COMP – Bearish
Where Will the SPX end March 2023?
02-27-2023 -2.0
Earnings:
Mon: GRPN, ZM
Tues: AZO, TGT, DDD, AMC, FSLR, HPQ, MNST, ROST, URBN
Wed: ANF, DLTR, KSS, LOW, WEN, CRM
Thur: BBY, BIG, BURL, KR, M, AVGO, DELL, MRVL, JWN, VMW, AUY, COST
Fri:
Econ Reports:
Mon: Durable Goods, Durable ex-trans, Pending Home Sales
Tue Chicago PMI, FHFA Housing Price Index, S&P Case Shiller, Consumer Confidence
Wed: MBA, ISM Manufacturing, Construction Spending
Thur: Initial Claims, Continuing Claims, Productivity, Unit Labor Costs
Fri:
How am I looking to trade?
Currently running mostly stocks with protection
www.myhurleyinvestment.com = Blogsite
info@hurleyinvestments.com = Email
Questions???
These researchers have studied 123 years of market data and say this is what to expect from stocks and bonds over the next two decades
Last Updated: Feb. 23, 2023 at 8:36 a.m. ETFirst Published: Feb. 23, 2023 at 6:55 a.m. ET
By
Steve Goldstein
Critical information for the U.S. trading day
Well, the worst day of the year for the stock market was followed by, basically nothing. Neither day had much in the way of new fundamental information, and on Thursday stock futures are higher. Animal spirits are as important as hard logic sometimes.
Thursday also saw the release of the Credit Suisse Global Investment Returns yearbook, produced by financial historians Elroy Dimson, Paul Marsh and Mike Staunton. It has the record of returns from equities, bonds, cash and currencies for 35 countries, stretching back to 1900. There is also data covering a total of 90 countries, including the most recent addition, Bosnia and Herzegovina, with data going back to 2011.
First, to the numbers: Over the last 123 years, global equities have returned an annualized return, adjusted for inflation, of 5%; that’s better than the 1.7% real return for bonds, and the 0.4% return for Treasury bills. The best country for inflation-adjusted annualized stock-market returns in U.S. dollar terms since 1900 has been Australia, with a return of 6.43%, though the U.S. is just behind at 6.38%. Equities have outperformed bonds, bills and inflation in all 35 countries where the researchers have data for 123 years.
DIMSON/MARSH/STAUNTON
On the day’s subject du jour, they said that once inflation goes above 8%, it takes multiple years to return to target, citing recent research. Equities do not provide a hedge against inflation, as they found and as 2022 returns showed. And historically, the returns on stocks and bonds have been much lower during hiking cycles than easing cycles.
The researchers also studied commodities: commodities have had a low correlation with equities and a negative correlation with bonds, and provided a hedge against inflation, but they note the investable market size is quite small, making large allocation increases difficult.
DIMSON/MARSH/STAUNTON
Onto the future — they estimate the equity risk premium to bills will be around 3.5%, which is lower than the historical figure of 4.6%. But that still means equity investors should double their money relative to short-term government bills in 20 years. They note that in thinking about future returns, real returns tend to be better in times of higher interest rates than lower rates, citing data over an impressive 2,487 country-years .
DIMSON/MARSH/STAUNTON
They project that for Generation Z will see roughly the same return in stocks as millennials have, but much worse bond returns. Baby boomers, Marsh told a journalist on a call, “just got lucky. I don’t think we will ever return to that.”
https://www.cnbc.com/2023/02/25/warren-buffett-annual-letter-berkshire-hathaway-stock-buybacks.html
Warren Buffett calls stock buyback critics ‘economic illiterate’ in Berkshire Hathaway annual letter
PUBLISHED SAT, FEB 25 20239:02 AM ESTUPDATED 3 HOURS AGO
KEY POINTS
- Warren Buffett pushed back on buyback critics, saying they are “either an economic illiterate or a silver-tongued demagogue.”
- The 92-year-old investor released Berkshire Hathaway’s much-anticipated letter Saturday.
- Buffett believes buybacks are beneficial to shareholders as they provide a lift to per-share intrinsic value.
Warren Buffett defended stock buybacks in Berkshire Hathaway’s annual letter, pushing back on those railing against the practice he believes to be beneficial to all shareholders.
“When you are told that all repurchases are harmful to shareholders or to the country, or particularly beneficial to CEOs, you are listening to either an economic illiterate or a silver-tongued demagogue (characters that are not mutually exclusive),” the 92-year-old investor said in the much-anticipated letter released Saturday.
The “Oracle of Omaha” initiated a buyback program in 2011 and relied on repurchases in recent years during a competitive deal-making environment and an expensive stock market. The conglomerate spent a record $27 billion in buybacks in 2021 as Buffett found few opportunities externally.
Repurchase activities slowed down this year to about $8 billion as the billionaire investor went on a buying spree with stocks selling off. Berkshire also took over insurance company Alleghany for $11.6 billion, Buffett’s biggest deal since 2016.
Stock buybacks have drawn criticism from politicians who believe Corporate America should use their cash in other ways to boost growth in the long term, such as employee benefits and capital expenditures. Many say buybacks often provide an incremental boost to earnings per share growth, and when companies stop doing that, accomplishing that goal becomes more challenging.
Buffett believes buybacks are beneficial to shareholders as they provide a lift to per-share intrinsic value.
“The math isn’t complicated: When the share count goes down, your interest in our many businesses goes up. Every small bit helps if repurchases are made at value-accretive prices,” Buffett said. “Gains from value-accretive repurchases, it should be emphasized, benefit all owners – in every respect.”
The legendary investor highlighted Apple and American Express, two of his biggest equity holdings that have similar strategies. Buffett in the past has said he is a fan of CEO Tim Cook’s stock repurchase program, and how it gives the conglomerate increased ownership of each dollar of the iPhone maker’s earnings without the investor having to lift a finger.
“At Berkshire, we directly increased your interest in our unique collection of businesses by repurchasing 1.2% of the company’s outstanding shares,” Buffett said.
The Inflation Reduction Act provision imposing a 1% excise tax on buybacks became effective this year.
‘American tailwind’
Buffett’s widely read shareholder letter is released with Berkshire’s annual report and usually sets the tone before the conglomerate’s big annual meeting in May in Omaha, Nebraska, nicknamed “Woodstock for Capitalists.”
The letter touched on a few other themes, including praise for his longtime partner, Charlie Munger, 99, as well as how Berkshire was glad to pay a large amount of taxes because of the benefit it’s received over the years from the “American tailwind.”
“I have been investing for 80 years – more than one-third of our country’s lifetime,” Buffett said. “I have yet to see a time when it made sense to make a long-term bet against America. And I doubt very much that any reader of this letter will have a different experience in the future.”
The much admired investor said Berkshire will always hold a boatload of cash and U.S. Treasury bills along with a wide array of businesses for the future. Its cash pile stood at nearly $130 billion at the end of 2022.
Buffett also revealed that Berkshire’s future CEOs will have a significant part of their net worth in the conglomerate’s shares, bought with their own money. Greg Abel, Buffett’s likely successor and Berkshire’s vice chairman of non-insurance businesses, spent more than $68 million on Berkshire’s shares last year.
“At Berkshire, there will be no finish line,” Buffett said.
Ant-Man’ crawls to another movie lead – but has to hold off a ‘Cocaine Bear’
Feb. 27, 2023 2:52 PM ETThe Walt Disney Company (DIS), CMCSA, AMCLGF.A, IMAX, MCS, WBD, NCMI, CNK, RDI, CPXGF, CNWGQ, LGF.B, CNNWQ, CGX:CABy: Jason Aycock, SA News Editor7 Comments
Disney’s (NYSE:DIS) latest Marvel splash held the No. 1 spot at the box office over the weekend – but not until after a now-typical second-weekend fall-off, and it was pressed by a movie focused sharply on a drug-addled bear.
Ant-Man and the Wasp: Quantumania (DIS) topped the weekend in its sophomore outing with $32.2M, though that represented a near-70% drop-off from an opening-weekend $106.1M (three-day total), a record decline for a Marvel opening.
And that has been the story of Disney’s box-office dominance: The part attributable to Marvel Studios means movies that need to open big because of quick drop-offs. (Sibling film Avatar: The Way of Water, by contrast, opened to a good-sized $134.1M but has been a far more consistent money-maker over the longer term.)
Pressing Ant-Man for dominance over the weekend was another part of the animal kingdom. Cocaine Bear (NASDAQ:CMCSA) – a comedy/horror film that describes its star in an uncomplicated title – grossed $23.1M, good enough for an easy second place, and perhaps making a play for No. 1 next weekend.
Reviews are mixed for the film, about a bear who embarks on a cocaine-fueled murder rampage, but it’s tracking toward profit on a relatively low budget of $35M.
In third place was Jesus Revolution (LGF.A) (LGF.B), a 1970s story of the revitalization of a California church, which drew some very strong audience word-of-mouth and a debut of $15.5M.
Rounding out the top six were the Avatar sequel (DIS), with $4.7M; Puss in Boots: The Last Wish (CMCSA), with $4.1M; and Magic Mike’s Last Dance (WBD), with $1.9M.
Avatar: The Way of Water’s moves on the all-time chart may be slowing to a close. The film is No. 9 all-time domestically with $665.4M (Titanic is at No. 8 with $673.8M), and No. 3 all-time worldwide (with $2.267B behind Avengers: Endgame’s $2.799M).