
Trade Findings and Adjustments 04-16-2019
Fiduciary Responsibilities – To put your clients interest above your own
DON’T Ever pay for a Financial Plan !!!
From the straight shooter, don’t ever pay for a financial plan! I know that goes against the “typical” wall street advise but let me give you three reasons to never pay for a financial plan. What are those reasons? Let me list them for you:
1st They never work due to a simple “linear” flaw in the program,
2nd They are the excuse to churn your portfolio every two to three years for commissions,
3rd They are an expensive gimmick that has no predictive understanding of future market conditions.
Let me give you and explanation of my first point I’ve listed for you.
As a financial planner I charge you a fee (sometimes $2500 to $5000) to gather information and place that information into a computer program. The program spits me out 60 to 100 pages, all pretty, to bind and give to you. I decide on information like % Yearly Return on Investment, the diversification percentages to allocate to different asset classes, and capital reinvestment. Most financial planners start with the historical average (Post 1951) S&P 500 Average of 7.75%. Here is a chart since 2000 with a 7.75% average return on the S&P 500 for a net return of 147.25% over this 19 year period. You should be extremely happy as a client!
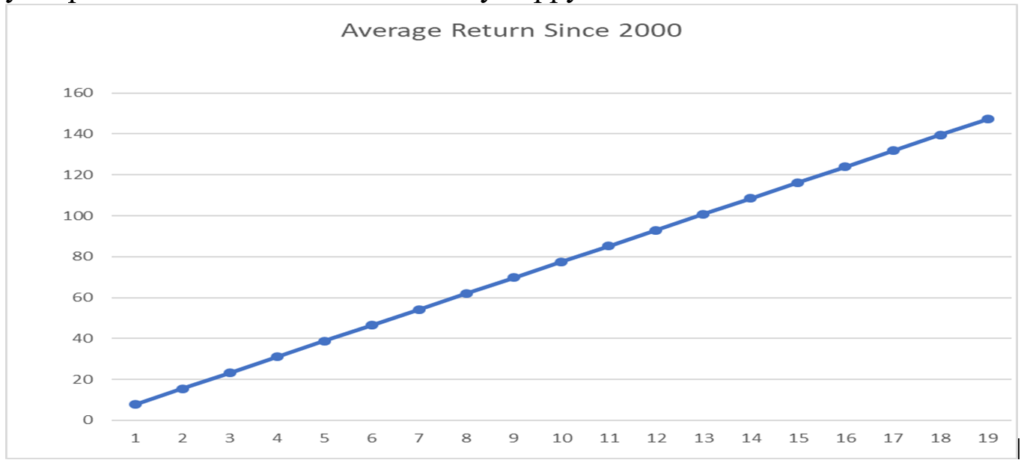
The understanding is your yearly average of 7.75% will grow in a linear fashion. Your money will make the number the planner deemed you need with this growth of 147.25% over the last 19 years. What if the money doesn’t grow in this compounding interest, linear fashion? What if the “real” growth over these 19 years was only 82.42%? What if it grows in real life looking like this:
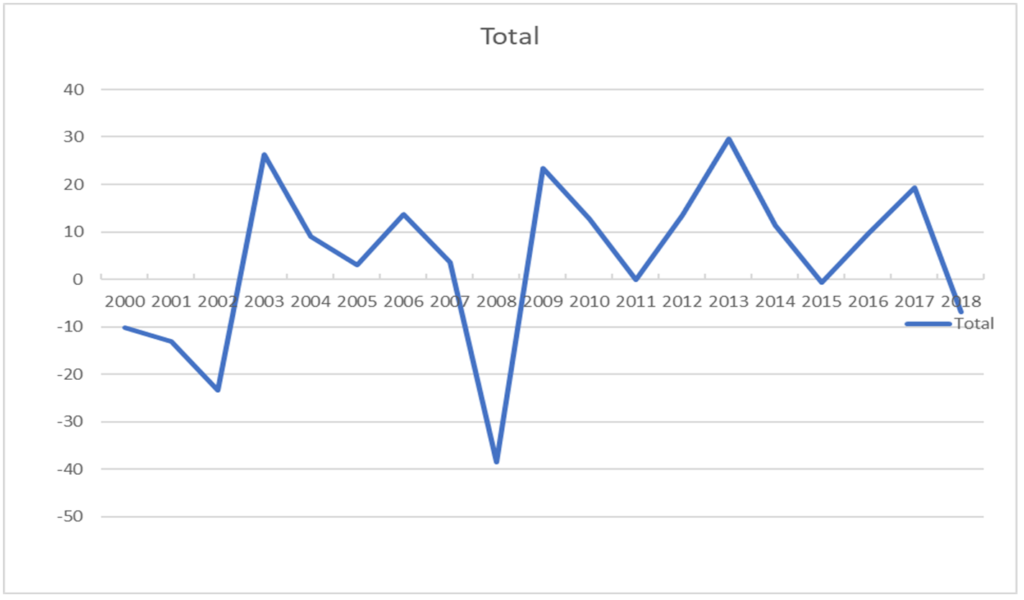
Obviously, the returns in the market are never linear yet EVERY financial plan has a linear growth model to justify the growth. It can’t and never will mathematically work! It can never work unless the market never has a down year during your investment period. And of course it has to have some big up years to replace the small growth years below the 7.75% average return
So a certain percentage return has to be in your plan for the typical 30 to 35 year investment cycle. The typical 7.75% should be in your plan, unless that doesn’t give them a big enough “average growth”. What am I talking about? Asset allocation usually means you have some fixed income part of your portfolio (40%) that makes between 4-5% annually. So, what about the other 60% in the stock market at only a 7.75% annual average return? Does the plan now give the fixed income portion a fixed linear rate of return that is less than the 7.75% historical return? I’ve seen some plans with as much as a 13% average return if they use emerging market, metals, and other asset plan averages. Yes, justified to create a higher return but very inaccurate. There is no way mathematically that a linear return will work in an variable market return that is real life.
So here are my pet peeves. “A financial plan is like a flight plan. If the plan or plane goes off course you correct.” So you are charging me, making a plan that is guaranteed to not work, putting me in a plane that definitely going to go off course? Or are you knowingly giving yourself a opportunity to churn me into other funds giving you commissions when the plan doesn’t work? Nobody knows the future but a linear, asset allocation has no predictive protection for the typical 4.5 year correction (-20%). The market crashes, dips, spikes and has recessions that affect the average return every single year.
Being a straight shooter, DON’T spend money on a broken financial plan. Don’t agree with an asset allocation plan that puts you into funds, diversification or low fixed income that can’t achieve your goals. Don’t blindly follow advise without first verifying the information. Find someone like Hurley Investments that has a plan for the uncertainties. Review and go over the ideas behind really achieving the results you need for the volatile markets we are in since 2000. Find a plan that works under any market conditions and forces your advisor to look at your portfolio daily. I mean, what are you playing them for, right?
My Biggest Mistake: Getting caught behind a soaring stock with a short call
NVDA price I got called out on $42 with an $18 covered call credit that only had maybe $2.50 of profit in it
Long Puts – The Right to Sell a stock at a certain Price (strike) for a certain period of time
Debit trade=risk= potential return of strike price down to zero
Example Right AAPL Trading 199.25
I would purchase the May-31-19 $200 Strike long puts for $7.75
Total cost basis IF I was to enter the trade today
$199.25 + LP cost 7.75 = $207
Risk in the trade? 207-200= $7 or 7/200 3.5% of total invested capital
Trades for the Earnings season –
FCX @ 400 share BTO $14.16
BTO 14 LP May31-19 for $0.71
Total cost basis per share = 14.16 +0.71=14.87
Total risk in trade = 14.87 – 14 = $0.87 or 5.8% risk in total invested capital
Net net = $5,948 with net risk of $348
www.hurleyinvestments.com www.myhurleyinvestment.com www.KevinMhurley.com