HI Market View Commentary 05-16-2022
SO here we have Michael Burry – Big Short 206,000 * 146.01 = 30, 078,060 doing exactly what we are doing
What is the most common you think I am getting right now?
#1 Question – How long will the bear market last? I DON’T KNOW but the more you make on the way down the more you make exponentially on the way up
Keve and I are ready to rip protection off for a very short time until be hit the pervious short term rally highs
#2 Why aren’t you doing a better job of protection the long calls with long puts?
Leap Long Call strategy is a stock replacement strategy that mathematically it is easier, simpler and more profitable to dollar cost average then use puts
#3 So if the stock replacement strategy doesn’t always work what do you do? = We condense and roll farther out in time to allow the markets to come back
The stock market is like an adolescent teenager = doesn’t do what it is supposed to, won’t follow directions and thinks it knows it all already
The secret to your success ? Patience – IT’S DAMN HARD in a bearish moving market, it’s really stupid sometimes, patience hurts, patience sucks when your wife asks “How are we doing in the market?”
Hardest part of Patience is not giving up when everything goes on sale
Rich – It comes back fast when it comes around
Mad – I remember when I first started I did not make any money for a couple of years…. Patience….I did not bug you let you do your thing and it really paid off !!!
Babu – Make money in both directions and that is particularly true in collar trades
Justin – Collar trading is the only way to not lose everything and when it comes full circle you make a killing (400% in 7 years)
Looking forward Keve and I are getting ready for a “dead cat bounce” to the protection off for as little as a couple of days and then put it right back on to protect again = Target 3000 and a return to break even for the year with an election stimulus
Michael Burry of ‘The Big Short’ reveals a bet against Apple
“The Big Short” investor Michael Burry had a bet against tech giant Apple in the first quarter, a regulatory filing showed.
Burry, one of the first investors to call and profit from the subprime mortgage crisis, owned 2,060 put contracts of Apple at the end of the first quarter, according to the filing.
Each options contract is tied to 100 shares of stock, so Burry’s bet was tied to 206,000 shares of Apple stock, which had a notional value of $36 million at the end of March.
A put options contract gives the owner the right to sell a security at certain time for a certain price and so it increases in value if the stock declines below the so-called strike price.
If Burry held these put options through the current quarter, the bet would be profitable as Apple has dropped 15% in the second quarter so far.
To be sure, Burry is a very active trader and he could have exited this position by now. The investor had previously owned put options against Tesla and he told CNBC that it was “just a trade.”
Burry didn’t immediately respond to CNBC’s request for comment.
Other than the Apple bet, the founder of Scion Asset Management added a slew of long positions in the first quarter across different sectors, including Booking Holdings, Alphabet, Cigna, energy name Ovintiv and Nexstar Media Group.
Earnings coming up:
BIDU 5/18 est
MU 6/30 est
TGT 5/18 BMO
The next three weeks of earning are retail companies VERY IMPORTANT because?= It will give us an idea on the strength of the consumer = GDP and recession
CORE HODLING = AAPL, BAC, BIDU, COST, DIS, F, FB, GOOGL, GM, IBB, JPM, KO, MU, SBUX, SQ, V, TGT, UAA, VZ
https://www.briefing.com/the-big-picture
The Big Picture
Last Updated: 13-May-22 15:20 ET | Archive
Consumer strength called into question by the stock market
If we had a dollar for every time we heard a talking head remind us that the “U.S. consumer is in good shape,” we would have a lot of dollars. Those people are not wrong.
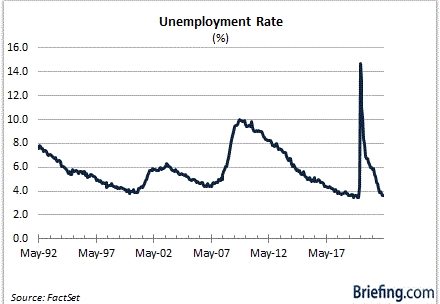
- The unemployment rate of 3.6% is close to the lowest on record.
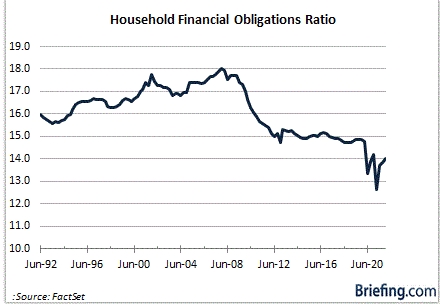
- The ratio of household debt payments to total disposable income is close to the lowest on record at 14.0.
- The year-over-year growth in wages and salaries is close to the highest on record.
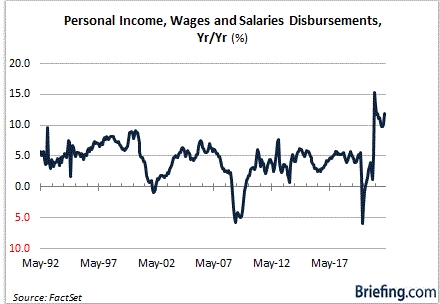
The U.S. consumer is in good shape. The stock market, however, does not think that will remain the case.
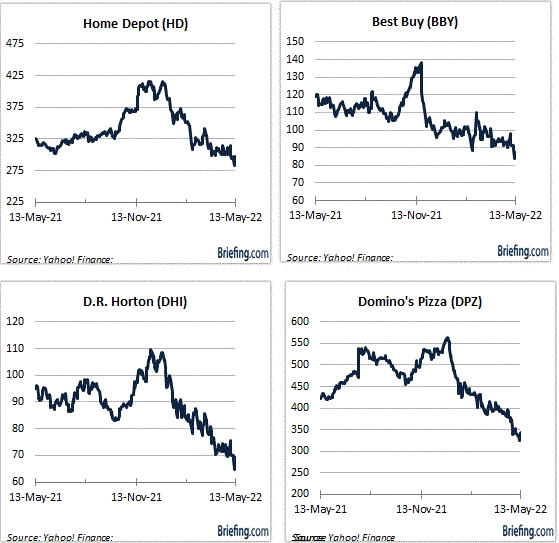
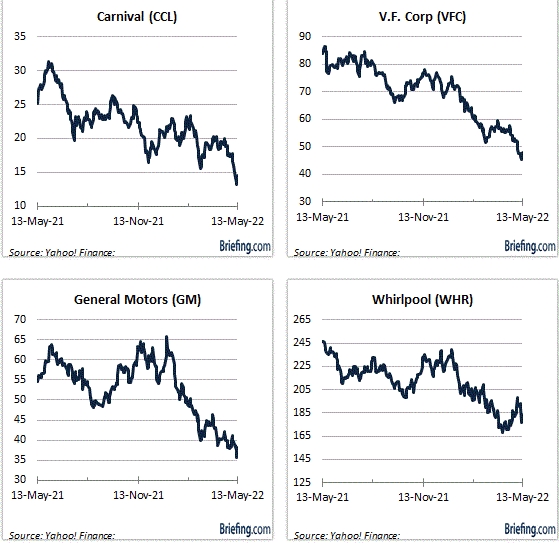
Just as you can see the current strength of the consumer in the charts above, you can see the worries about a weakening consumer in the charts below.
Charting a Course
We will begin with an overview of the consumer discretionary sector, which is the worst-performing sector (-26.4%) year-to-date. Granted this sector is driven principally by moves in Amazon.com (AMZN) and Tesla (TSLA), which are down 33% and 27%, respectively, this year. Subsequent stock charts will demonstrate, however, that the weakness in this sector goes well beyond the losses in AMZN and TSLA.

Not much has been immune from the selling pressure. Industry leaders have been on the defensive along with the industry followers. Some stocks have been hit harder than others, but the downtrend seen in stocks across consumer discretionary industry groups does not match the prevailing narrative about the U.S. consumer.
Pricing in Cutbacks
The performance of the consumer discretionary stocks fits more closely with a view that the consumer is going to be pulling back on discretionary spending in coming months.
That view has a lot to do with the inflation pressures consumers are feeling at the gas pump, in the grocery aisle, and when apartment/home leases come up for renewal. The reduced wealth effect from falling stock, bond, and cryptocurrency prices is part of the concerning mix as well.
Rising interest rates, and expectations that those rising rates will hurt demand, have played a large role, too. In fact, Fed Chair Powell has acknowledged that the Fed has a “job to do on demand,” meaning the Fed will use higher interest rates to weaken demand, which it expects to weaken inflation pressures.
Higher policy rates will transmit to higher mortgage rates, higher borrowing rates, and “things like that,” the Fed Chair said. He also said that “It is not going to be pleasant, either.”
Well, there has been nothing pleasant about the stock market’s performance so far this year, partly because market participants have recognized that higher interest rates are going to lead to slower growth and possibly a recession. Consequently, earnings growth is likely to weaken, too, only analysts have been slow to cut their earnings estimates.
Judging by the performance of the consumer discretionary stocks, however, investors are out ahead of those cuts. Prices are being marked down because there isn’t faith in the idea that consumers are going to keep spending as freely as they have been.
The anticipated cutbacks are being priced into stocks today. Ironically, then, the consumer discretionary stocks might do better when the earnings estimate cuts actually happen, assuming investors believe the estimates have been cut appropriately.
What It All Means
There is a message in the market, but one has to read between the lines to understand it. The U.S. consumer is currently in good shape, yet many of the consumer discretionary stocks are currently in awful shape. The move in those stock prices seemingly belies the strength of the consumer, but in essence it conveys the forward-looking stock market’s concerns about the consumer.
The stock market is not alone with its concerns.
Perhaps the most telling component of this past week’s market action is that the stock market traded lower as Treasury yields moved lower, the euro continued to sink, copper futures dropped more than 5.0% at one point, and the Dow Jones Transportation Average traded down as much as 6.3% for the week at its low on Thursday.
Those performances are consistent with a market worried about global growth prospects. In the same vein, the underperformance of the consumer discretionary sector, which was down as much as 8.0% this past week, is consistent with a market worried about a downshift in consumer spending and earnings estimates for the companies that thrive on discretionary spending.
That doesn’t mean the consumer discretionary stocks can’t enjoy a tactical rally off their depressed bases, but it does mean those rallies are apt to run into resistance predicated on worries about the consumer’s strength in the back half of the year and earnings estimates that weaken along with the consumer.
—Patrick J. O’Hare, Briefing.com
| https://go.ycharts.com/weekly-pulse |
| Market Recap WEEK OF MAY. 9 THROUGH MAY. 13, 2022 The S&P 500 index fell 2.4% last week on concerns about inflation and monetary tightening. The market benchmark ended the week at 4,023.89, down from last Friday’s closing level of 4,123.34. It has fallen 2.6% in May so far and has declined nearly 16% in the year to date. Last week’s slide came as data on consumer and producer prices added to investor worries about inflation. The data showed consumer prices rose 8.3% on an annual basis in April, down slightly from March’s 8.5% annual rate, but high enough to concern investors. The core consumer price index, which excludes food and energy due to their volatility, was up 6.2% on an annual basis. Producer prices, meanwhile, jumped 11% year over year in April, with core PPI up 8.8%, the Bureau of Labor Statistics said. Amid concerns about how the US economy may be impacted by the monetary tightening being done in an effort to tamp down on rising prices, the inflation data sent almost every sector into the red. Real estate had the largest percentage drop of the week, down 3.9%, followed by a 3.6% slide in financials, a 3.5% drop in technology and a 3.4% slip in consumer discretionary. Just one sector managed to avoid ending the week in the red: consumer staples, which eked out a 0.3% increase. In real estate, shares of Prologis (PLD) declined 8.9% as Duke Realty (DRE) said the logistics real estate company’s $23.71 billion takeover bid was “insufficient.” Prologis had said a day earlier that it would offer 0.466 share of its stock for each Duke common share, representing $61.68 per share, or a 29% premium to Duke’s closing price on Monday. The financial sector’s decliners included shares of Capital One Financial (COF), American Express (AXP), Discover Financial Services (DFS) and Synchrony Financial (SYF) as all four received investment rating downgrades from Wolfe Research. Capital One and Synchrony were downgraded by Wolfe to underperform from peer perform while Discover Financial and American Express were downgraded to peer perform from outperform. Shares of Capital One Financial fell 8.3% on the week while American Express shed 5%, Discover lost 5.5% and Synchrony declined 12%. In technology, shares of Nvidia (NVDA) slipped 5.2% last week after the chipmaker said last Friday that the company agreed to pay a $5.5 million penalty to settle charges that it didn’t adequately disclose the impact of cryptomining on its gaming business. The decliners in consumer discretionary included shares of Norwegian Cruise Line Holdings (NCLH), which fell 11% on the week as the cruise operator reported a Q1 net loss that was narrower than the loss it posted in the year-earlier quarter but was wider than the loss analysts expected. Revenue also missed the Street consensus estimate. In addition, the company warned it expects to report a Q2 loss due to the COVID-19 pandemic and the effects of the Russia-Ukraine conflict. On the upside, the gainers in consumer staples included Philip Morris International (PM), which unveiled an acquisition offer for Swedish Match at a price of 106 Swedish kronor per share in cash, or about $16 billion. Shares of Philip Morris rose 5.5%. Retailers including Home Depot (HD), Walmart (WMT), Lowe’s (LOW), Target (TGT) and Foot Locker (FL) will report next week. Other companies expected to release quarterly results next week include Cisco Systems (CSCO) and Deere (DE). Economic data expected next week include retail sales, building permits, housing starts and existing home sales for April. Provided by MT Newswires |
Where will our markets end this week?
Lower
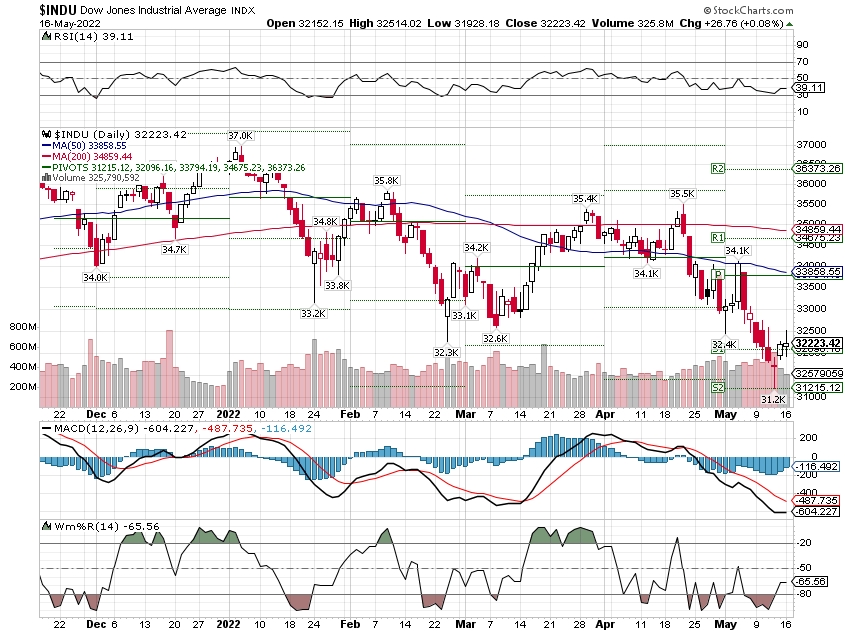
DJIA – Bearish
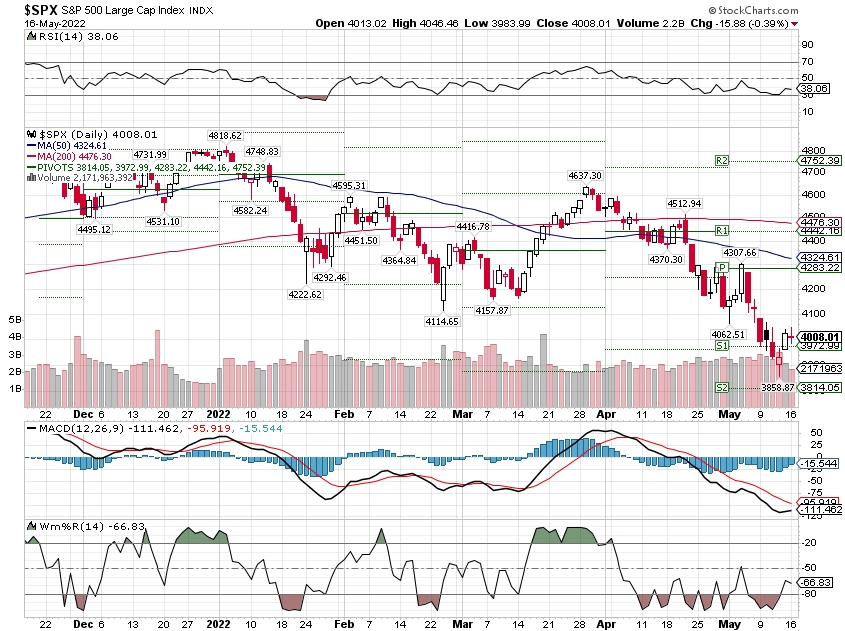
SPX – Bearish
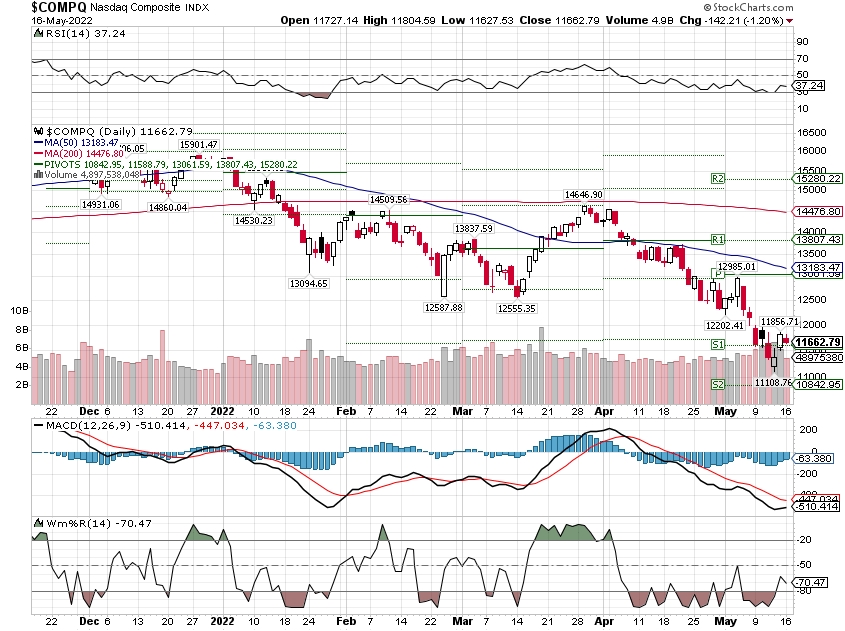
COMP – Bearish
Where Will the SPX end May 2022?
05-16-2022 -3.0%
05-09-2022 -2.0%
05-02-2022 -2.0%
Earnings:
Mon:
Tues: HD, JD, WMT
Wed: LOW, TJX, CSCO, BIDU, TGT
Thur: BJ, KSS, ROST, VFC, BABA
Fri: DE, FL
Econ Reports:
Mon: Empire Manufacturing
Tues: Retail Sales, Retail Ex-trans, NAHB Housing Market Index, Industrial Production, Capacity Utilization, Business Inventories,
Wed: MBA, Housing Starts, Building Permits,
Thur: Initial Claims, Continuing Claims, Phil Fed, Existing Home Sales
Fri: May Monthly Options Expiration
How am I looking to trade?
Currently protection on all core holding and making decisions on earnings,
www.myhurleyinvestment.com = Blogsite
customerservice@hurleyinvestments.com = Email
Questions???
https://www.cnbc.com/2022/05/16/bernanke-says-the-feds-slow-response-to-inflation-was-a-mistake.html
Bernanke says the Fed’s slow response to inflation ‘was a mistake’
Jeff Cox@JEFF.COX.7528@JEFFCOXCNBCCOM
KEY POINTS
- Former Fed Chair Ben Bernanke said the central bank erred in waiting to address inflation.
- “One of the reasons was that they wanted not to shock the market,” he told CNBC’s Andrew Ross Sorkin.
- Bernanke spoke a day ahead of his latest book release, which addresses Federal Reserve policy moves during the 21st century.
Former Federal Reserve Chair Ben Bernanke said the central bank erred in waiting to address an inflation problem that has turned into the worst episode in U.S. financial history since the early 1980s.
Bernanke, who guided the Fed through the financial crisis that exploded in 2008 and presided over unprecedented monetary policy expansion, told CNBC that the issue of when action should have been taken to tame inflation is “complicated.”
“The question is why did they delay that. … Why did they delay their response? I think in retrospect, yes, it was a mistake,” he told CNBC’s Andrew Ross Sorkin in an interview that aired during Monday’s “Squawk Box” show. “And I think they agree it was a mistake.”
Like the Bernanke-era Fed, the Jerome Powell-led central bank was called on to take aggressive action when the Covid pandemic hit in March 2020. Much of the response was patterned after the financial crisis moves, but to an even larger degree.
It kept that historically loose policy in place well after the economy recovered from the crisis.
Now, the Fed is tightening policy with rate hikes and a reduction of its bond holdings that will start in June. However, the Fed is facing criticism that it waited too long to pull back and now confronts inflation running at an 8.3% annual pace.
Bernanke said he understands why the Powell-led Fed waited.
“One of the reasons was that they wanted not to shock the market,” he said. “Jay Powell was on my board during the Taper Tantrum in 2013, which was a very unpleasant experience. He wanted to avoid that kind of thing by giving people as much warning as possible. And so that gradualism was one of several reasons why the Fed didn’t respond more quickly to the inflationary pressure in the middle of 2021.”
In late summer of 2020, the Fed changed its policy framework to indicate that it would allow inflation to run hotter than normal in the interest of assuring a complete and inclusive jobs recovery.
When inflation began running higher than the 2% target in the spring of 2021, policymakers said they expected it to be “transitory” due to pandemic-specific factors that would abate. In recent days, several Fed officials have defended their response, saying that when it became clearer that inflation was more persistent, they began using “forward guidance” to tell the market that tighter policy was coming.
One thing the Fed has going for it is that while the current inflation run is drawing comparisons to the hyperinflation of the late 1970s and early ’80s, it is different from the last time price increases were this high, Bernanke added.
What’s more, the current central bank has more credibility as an inflation fighter, and there’s more public support for rate hikes.
“There’s a lot of support for the fact that the Fed is tightening now, even though obviously we see the effects in markets,” Bernanke said. “You know, we’ll see the effects in house prices, etc. So those are some ways in which the current situation I think is better because we learned a lot from the ’70s.”
Bernanke’s new book is “21st Century Monetary Policy: The Federal Reserve from the Great Inflation to COVID-19” and will be released officially Tuesday.
Gold ticks up as dip in U.S. yields loosens dollar’s grip
Gold rose slightly on Monday as a retreat in U.S. Treasury yields offset headwinds from a relatively firm dollar, which, along with looming interest rate hikes, earlier pushed bullion to a more than three-and-a-half-month low.
Spot gold rose 0.3% to $1,817.12 per ounce by 1:52 p.m. ET (1752 GMT), after earlier hitting its lowest since Jan. 31 at $1,786.60. U.S. gold futures settled up 0.3% at $1,814.
Gold’s slight bounce was attributable to a dip in Treasury yields and a small pullback in the dollar, RJO Futures senior market strategist Bob Haberkorn said, adding that the overall trend for the dollar was “still high as the Fed is being aggressive with its rate hikes”.
“All things considered, gold is holding up, it should be significantly lower… it will find support slightly below the $1,800 level. Also, there is enormous demand for physical gold and silver.”
The dollar inched lower, but still held near a two-decade peak, making gold expensive for overseas buyers.
Although gold is considered a hedge against inflation, higher interest rates to tame rising prices curb appetite for bullion, which pays no interest.
“Many still regard gold as being significantly undervalued, and would be even more wiling to buy the metal now that prices have weakened,” Fawad Razaqzada, market analyst at City Index, said.
Spot silver gained 2.2% to $21.53 per ounce, after hitting its lowest since July 2020 on Friday.
Silver has found itself caught up in the broader sell-off in equities and gold, being punished for being an industrial metal at a time when growth forecasts are being trimmed, Rupert Rowling, market analyst at Kinesis Money, said.
Platinum rose 0.2% to $940.28, while palladium rose 3.9% to $2,019.70.
Autocatalyst maker Johnson Matthey said a surplus in the platinum market should shrink this year and the palladium markets are likely to move back into deficit.
China’s economic data disappoint in April as Covid controls weigh
KEY POINTS
- Retail sales fell by 11.1% in April from a year ago, more than the 6.1% decline predicted in a Reuters poll.
- Industrial production dropped by 2.9% in April from a year ago, in contrast with expectations for a slight increase of 0.4%.
- The unemployment rate in China’s 31 largest cities climbed to a new high of 6.7% in April, according to data going back at least to 2018.
- Shanghai city announced Sunday that it would start to allow restaurants to reopen gradually, and said Monday the city aimed to resume normal production and life by the middle of June.
BEIJING — China reported a drop in retail sales and industrial production in April — far worse than analysts had expected.
Retail sales fell by 11.1% in April from a year ago, more than the 6.1% decline predicted in a Reuters poll.
Industrial production dropped by 2.9% in April from a year ago, in contrast with expectations for a slight increase of 0.4%. The output of mining and utilities businesses grew.
But manufacturing fell by 4.6%, mostly dragged down by a slump in the auto sector and equipment manufacturing, said Statistics Bureau Spokesperson Fu Linghui. In addition to Covid, he said industrial production faces pressure from insufficient market demand, rising costs and other factors.
Last month, the persistent spread of Covid and resulting stay-home orders — primarily in Shanghai — forced factories to close or operate at limited capacity.
The “increasingly grim and complex international environment and greater shock of [the] Covid-19 pandemic at home obviously exceeded expectation, new downward pressure on the economy continued to grow,” the statistics bureau said in a statement. The bureau said the impact of Covid is temporary and that the economy “is expected to stabilize and recover.”
Fixed-asset investment for the first four months of the year rose by 6.8% from a year ago, slightly missing expectations of 7% growth. Investment in real estate declined by 2.7%, while that in manufacturing rose by 12.2.% and that in infrastructure rose by 6.5%.
China’s passenger car production dropped by 41.1% year-on-year in April, according to the China Passenger Car Association. The auto sector in China accounts for about one-sixth of jobs and roughly 10% of retail sales, according to official figures for 2018 compiled by the Ministry of Commerce.
Auto sales dropped by 31.6% in April from a year ago, the statistics bureau data showed. That was better than the peak of the decline in early 2020 — down 37% year-on-year in January and February that year — but worse than the 0% year-on-year change recorded for April 2020.
We believe local lockdowns will still severely impact the production-end of the economy in May and view a quick turnaround as all but impossible.
Ting Lu
CHIEF CHINA ECONOMIST, NOMURA
Catering sales plunged by 22.7% — better than a 31.1% year-on-year drop in April 2020. Restaurants in Shanghai were essentially closed in April, while Beijing city’s ban on dining in restaurants only took effect in early May.
Within retail sales, only beverages, medicine, food and petroleum products saw year-on-year growth.
“Although Covid case numbers have declined markedly from the peak in mid-April, the unwinding of lockdowns has been extremely slow, due partly to the caution among local government officials,” Ting Lu, Chief China Economist at Nomura, said in a note. “Therefore, we believe local lockdowns will still severely impact the production-end of the economy in May and view a quick turnaround as all but impossible.”
Shanghai city announced Sunday that it would start to allow restaurants to reopen gradually, and said Monday the city aimed to resume normal production and life by the middle of June.
Jobless rate ticks higher
The unemployment rate in China’s 31 largest cities climbed to a new high of 6.7% in April, according to data going back at least to 2018.
The unemployment rate across cities rose by 0.3 percentage points from March to 6.1% in April. The jobless rate among those aged 16 to 24 was nearly three times higher at 18.2%.
For an additional sense of the scale of economic slowdown in April, other data showed a slump in business and household demand for loans.
Total social financing — a broad measure of credit and liquidity — roughly halved last month from a year ago to 910.2 billion yuan ($134.07 billion), the People’s Bank of China said late Friday.
However, Macquarie’s Chief China Economist Larry Hu said he expected the drop in credit demand would be short lived. He pointed out that on Sunday, the central government took its “first action … to save property” by cutting mortgage rates for first-time homebuyers.
The rate, which used to follow the five-year loan prime rate as a benchmark, is now 20 basis points below that.
“Today’s cut is far from enough to turn the property sector around, but more property easing would come,” Hu said in a note Sunday.
Real estate and related industries account for about a quarter of China’s GDP, according to Moody’s.
Tax professionals ‘horrified’ by IRS decision to destroy data on 30 million filers
KEY POINTS
- The IRS destroyed data for an estimated 30 million filers in March 2021, according to the Treasury Inspector General for Tax Administration.
- The decision, prompted by a backlog of paper filings, has sparked anger in the tax community.
- “It just further damages the IRS’ reputation in the business community and in the public,” said Larry Harris, director of tax services at Parsec Financial.
An audit by the Treasury Inspector General for Tax Administration revealed the IRS has tossed data for millions of payers, sparking anger from the tax community.
The material, known as paper-filed information returns in accounting parlance, is sent yearly by employers and financial institutions, and covers taxable activity, such as W-2 forms, with copies sent to taxpayers and the IRS.
“The continued inability to process backlogs of paper-filed tax returns contributed to management’s decision to destroy an estimated 30 million paper-filed information return documents in March 2021,” according to the report.
The IRS backlog, created by years of budget cuts, understaffing, pandemic-related office closures and added duties, is expected to clear by December, according to Commissioner Charles Rettig.
While the report doesn’t specify which information returns the agency chucked, the news has triggered angry responses from tax professionals, particularly after another difficult filing season.
“I was horrified when I read the report describing the destruction of paper-filed information returns,” said Phyllis Jo Kubey, a New York-based enrolled agent and president of the New York State Society of Enrolled Agents.
Missing information returns can cause a “mismatch” at the IRS, delaying refunds because the agency can’t verify details on a taxpayer’s returns, she explained.
While the eventual consequences of the decision are unknown, tax professionals have long complained about the stream of automated IRS notices, with limited options to reach the agency.
“If they’re not putting those into the system, there’s going to be discrepancies, which means potential notices that are sent out,” said Dan Herron, a San Luis Obispo, California-based certified financial planner and CPA with Elemental Wealth Advisors.
Although the IRS halted more than a dozen types of automated notices in February, Herron says the constant correspondence is still creating headaches for taxpayers and advisors.
“There were no negative taxpayer consequences as a result of this action,” the IRS said in a statement on Thursday. “Taxpayers or payers have not been and will not be subject to penalties resulting from this action.”
Brian Streig, a CPA with Calhoun, Thomson and Matza LLP in Austin, Texas, said the news was a “break of our trust,” pointing to the burden on the business community.
“Small businesses stress out every year in January trying to accurately prepare these informational returns and get them filed on time,” he said. “To see the IRS just destroy these is almost like the IRS admitting they don’t really care.”
Larry Harris, a CFP and director of tax services at Parsec Financial in Asheville, North Carolina, voiced similar concerns, questioning the agency’s ability to stay compliant.
“It just further damages the IRS’ reputation in the business community and in the public,” he added.
The 7 levels of financial freedom, according to a millionaire — 50% of U.S. workers are at Level 2
Grant Sabatier isn’t retired. But he could be.
One of the leading voices and biggest success stories in the FIRE movement — short for “financial independence, retire early” — the self-made millionaire has amassed enough money to live comfortably off income from his investments in perpetuity.
Sabatier views his situation as the end goal for people who think about money the way he does: not as something that allows you to buy things, but as a means of giving you more choices in how you want to live. “With every dollar you save, you give yourself more freedom and options in life,” he told Grow. “Based on how much you have saved and invested, ask yourself, ‘How many months of freedom have you acquired?’”
Rather than play golf or charter fishing boats, Sabatier has spent post-9-to-5 life in what he calls “a mission-driven phase.” In his book “Financial Freedom,” as well as in the Financial Freedom Course, an online personal finance curriculum, Sabatier offers a roadmap to money security which includes seven levels of financial freedom, ranging from Clarity all the way up to Abundant Wealth.
Half of working Americans say they live paycheck to paycheck, according to a recent MagnifyMoney survey, which puts them at Level 2, Self-Sufficiency.
Progressing through the levels likely requires a shift in your financial habits and overall thinking around money, Sabatier says.
Sabatier’s 7 levels of financial freedom
Level 1: Clarity
The first step is taking stock of your financial situation — how much money you have, how much you owe, and what your goals are. “You can’t get to where you want to go without knowing where you’re starting from,” Sabatier says.
Level 2: Self-Sufficiency
Next, you’ll want to be standing on your own two feet, financially speaking. This means earning enough to cover your expenses without any outside help, such as contributions from Mom and Dad.
At this level, Sabatier notes, you may be living paycheck-to-paycheck or taking on loans to make ends meet.
Level 3: Breathing room
People at Level 3 have money left over after living expenses that they can put toward goals such as building an emergency fund and investing for retirement.
Escaping Level 2 means giving yourself some financial leeway, which Sabatier notes doesn’t necessarily mean making a much bigger salary. Indeed, 31% of working Americans making over $100,000 live paycheck-to-paycheck, according to MagnifyMoney.
“Just because you make a lot of money doesn’t mean you’re actually saving that money,” Sabatier says. “Most people in this country live through debt.”
Level 4: Stability
Those who reach Level 4 have paid down high interest rate debt, such as credit card debt, and have stashed away six months’ worth of living expenses in an emergency fund. Building up emergency savings helps ensure that your finances won’t be thrown off track by unexpected circumstances.
“At this level, you’re not worried if you lose your job or if you have to move to a different city,” Sabatier says.
When calculating how much you’d need to have saved, thinking about what your financial picture might look like understand exigent circumstances, rather then your regular, everyday expenses, financial experts say.
“If you have a job loss, you’d make some changes. You’d probably cut your gym membership and get rid of your subscriptions, for instance,” Christine Benz, director of personal finance and retirement planning at Morningstar, told Grow. “Think about the bare minimum you’d need to get by.”
Level 5: Flexibility
People at Level 5 have at least two years’ worth of living expenses saved. With those kinds of savings, Sabatier suggests, you have the ability to think about your money terms of the time it can buy you: “You could take a year off from your job if you wanted to.”
You needn’t carry all of this money in cash, Sabatier notes: It could be a sum total from your savings and investment accounts. As long as you’re able to access that money somehow, if you need it, you have the flexibility to untether yourself, at least temporarily, from the workforce.
Level 6: Financial Independence
People who have achieved financial independence can live solely off the income generated from their investments, according to Sabatier’s framework.
“You generally have one of two things,” says Sabatier. “You either have a large pile of money in an investment portfolio that’s generating interest, or you have rental properties, and cashflow from the rent covers your living expenses, or a hybrid of the two.”
To get here, you’ll have to invest a high percentage of your income, which could require you to shift to a more modest lifestyle to drastically lower your cost of living. Pursuing this lifestyle requires a change in thinking away from the traditional paradigms of personal finance, Sabatier says.
“People are being taught to save 5%, 10%, 15% of their income, and maybe you’ll be able to retire when you’re 65,” he says. “Thankfully, more young people are starting to understand that if I aggressively save and invest, I can work less and have more control over my future and my destiny.”
Level 7: Abundant Wealth
Financially independent folks who live off their portfolio income rely on the “4% rule” — a retirement rule of thumb that posits that an investor can safely withdraw 4%, adjusted for inflation, from a balanced portfolio of stocks and bonds each year, and be relatively certain that the money will continue to grow and won’t run out.
Although economists debate whether 4% is the optimal number (some more conservative observers think the right figure might be closer to 3.3%), the calculation behind it serves as the basis for establishing a FIRE number — the amount of money you’d need to retire and earn an annual income you could comfortably live on.
More young people are starting to understand that if I aggressively save and invest, I can work less and have more control over my future and my destiny.
Grant Sabatier
AUTHOR OF ‘FINANCIAL FREEDOM’
While those in Level 6 need to monitor swings in their portfolio to make sure their retirement is still going according to plan, those in Level 7 have no such worries. “Level 7 is abundant wealth — having more money than you’ll ever need,” Sabatier says. “You don’t have to worry about money, and it’s not essential to your day-to-day existence.”
It’s the level where Sabatier finds himself, and the one he wants to get you to as well, if you’re willing to shift your mindset around money.
“If you want your life to look different, you have to make different choices,” he says. “Blueprints are available.”
Apple is no longer the world’s most valuable company
KEY POINTS
- Oil giant Saudi Aramco is now the world’s most valuable company.
- It surpassed Apple on Wednesday.
Oil giant Saudi Aramco on Wednesday surpassed Apple as the world’s most valuable firm.
Aramco’s market valuation was just under $2.43 trillion on Wednesday, according to FactSet, which converted its market cap to dollars. Apple, which fell more than 5% during trading in the U.S. on Wednesday, is now worth $2.37 trillion.
Energy stocks and prices have been rising as investors sell off equities in several industries, including technology, on fears of a deteriorating economic environment. Apple has fallen nearly 20% since its $182.94 peak on Jan. 4.
The move is mostly symbolic, but it shows how markets are shifting as the global economy grapples with rising interest rates, inflation, and supply chain problems.
Aramco stock is up over 27% so far in 2022. In March, the oil giant reported that its full-year profit last year more than doubled due to soaring oil prices.
Apple passed Saudi Aramco to become the world’s most valuable publicly traded company in 2020.
Household debt nears $16 trillion despite rising rates and inflation
Jeff Cox@JEFF.COX.7528@JEFFCOXCNBCCOM
KEY POINTS
- Consumer debt and credit rose 1.7% in the first quarter to $15.84 trillion, a new record.
- The increase, which stemmed largely from housing debt, came amid surging inflation and rising rates.
- Student loan debt climbed by $14 billion in the first quarter, bringing the annual increase to 6.5%.
Even with rampant inflation and rapidly accelerating interest rates, household borrowing climbed to start 2022 and hit a new record, the Federal Reserve reported Tuesday.
Consumer debt and credit rose 1.7% in the first quarter to $15.84 trillion. The rise in total household credit was propelled largely by a $250 billion increase in mortgage debt, which now stands at $11.18 trillion, an increase of 10% from the first quarter in 2021.
Credit card balances actually fell during the three-month period by $15 billion but still remained $71 billion, or about 9% higher than they were for the same period a year ago. Auto loan originations declined in the first quarter after what the New York Fed described as “a historically brisk 2021,” in which used vehicle prices soared by nearly 27%.
Student loan debt climbed by $14 billion in the first quarter, bringing the annual increase to 6.5%.
The acceleration in debt overall comes with consumer price inflation up 8.5% over the past year through March and with interest rates surging to multiyear highs. Thirty-year mortgage rates are now running around 5% after being closer to 3% just a year ago, according to Freddie Mac.
Mortgages make up 71% of all household debt, a number that has consistently climbed.
Households have originated $8.4 trillion in new mortgage debt since the Covid pandemic began, the result of a relocation trend out of cities and into the suburbs, a move that has coincided with a massive rise in prices, the New York Fed reported. The median home price has soared 30% over the past two years to $428,700, according to census data.
The New York Fed added, though, that it appears the refinance boom that coincided with falling mortgage rates is waning as rates are rising.
To combat soaring inflation, the Fed has approved two rate increases this year totaling 0.75 percentage point and is expected to approve a series of additional hikes through the end of the year.
If history repeats itself, the bear market has 6 months of pain ahead, Bank of America’s chief strategist says
May 9, 2022 10:32 AM MDTU.S. stocks have had a rough start to the year after a standout 2021—and if history is any guide for what’s to come, things
The S&P 500, which returned nearly 27% to investors last year, has been dragged down more than 15% year to date by rising interest rates, geopolitical tensions, persistent inflation, and a number of other bearish factors.
The big question on most investors’ minds: How much further will stocks drop?
Bank of America’s chief investment strategist Michael Hartnett has looked backward, and he has a hibernation outlook. Based on historical bear market trends, he said, there could be months of pain ahead.
https://42cff40ad11cf7c9ebe5b8b44b2a708d.safeframe.googlesyndication.com/safeframe/1-0-38/html/container.html “In the last 19 bear markets, the average peak to trough decline has been 37% with an average duration of 289 days. If history were to repeat then today’s bear market ends in October 2022 with the S&P at 3000,” Bank of America Research analysts wrote in a Sunday note.
If that bears out, it means the S&P 500 still has another roughly 25% downturn ahead of it from current levels.
“Bear markets are quicker than bull markets”
Hartnett noted that in the past 25 years, the NYSE composite has always fallen significantly below its 100-week moving average during bear markets, but this year the index is trading just barely below that level, which could mean more downside lies ahead.
While about half of the stocks in tech-heavy Nasdaq are down 50% or more from their peaks, and many speculative assets in the cryptocurrency space have seen sharp drawdowns in recent weeks, Hartnett argues Wall Street will spend much of the year working through an “inflation shock,” a “rates shock,” and a “recession shock” that will lead to negative returns and increased volatility.
The “good news is bear markets are quicker than bull markets,” he said.
The investment strategist added that while many investors have sought protection in commodities since the start of the year, he believes these holdings should be sold moving forward “given recession risk.”
Hartnett isn’t bullish on the tech space, either, arguing that more speculative tech stocks will remain in a bear market for the next two years, even if the S&P 500 bottoms out. A floor does not equal a new bull market for tech stocks, he said.
The investment strategist isn’t alone in calling for stocks to fall amid a U.S. recession either. From billionaire investors to top investment banks, recession fears are spreading on Wall Street.
Jamie Dimon, the CEO of JPMorgan Chase and one of the most powerful voices in finance, argued there’s only a 33% chance the Federal Reserve can ensure a “soft landing” for the U.S. economy—in which rising inflation is tamed, but a recession is avoided—in an interview with Bloomberg on Wednesday. And Deutsche Bank said in April that it believes a “major” recession will come by 2023.
Even former Fed officials have begun sounding the alarm, with former Fed Chair Randal Quarles saying in an interview last week that a recession is likely, “given the intensity of inflation.”
HI Financial Services Mid-Week 06-24-2014