HI Market View Commentary 05-23-2022
CORE HODLING = AAPL, BAC, BIDU, COST, DIS, F, FB, GOOGL, GM, IBB, JPM, KO, MU, SBUX, SQ, V, TGT, UAA, VZ
Tell me something about our core holdings: Undervalued, They are all strong (S&P 500) companies that will not go to zero, they are volatile “enough” to move so we can pick up more shares, they touch almost all of the S&P 500 sectors, huge upside potential from where they were at,
52 Week High Current Price $ / % Down YTD
AAPL $182.94 $137.59 45.35 / 24.7%
BA $258.40 $121.61 136.79 / 52.9%
BAC $50.11 $33.86 16.25 / 32.4%
BIDU $209.17 $124.47 84.70 / 40.5%
COST $612.27 $416.43 195.84 / 31.98%
DIS $187.58 $102.42 85.16 / 45.4%
F $25.87 $12.50 13.37 / 51.68%
FB $384.33 $193.54 190.79 / 49.6%
GOOGL $3030.93 2178.16 852.77 / 28.1%
GM $67.21 $35.40 31.81 / 47.3%
IBB $177.37 $115.61 61.76 / 34.8%
JPM $172.96 $117.34 55.62 / 32.1%
KO $67.20 $60.98 6.22 / 9.25%
MU $98.45 $68.90 29.55 / 30.01%
SBUX $126.32 $73.39 52.93 / 41.9%
SQ $289.23 $83.44 205.79 / 71.15%
V $252.67 $199.03 53.64 / 21.2%
TGT $268.98 $155.36 113.62 / 42.24%
UAA $27.28 $9.64 17.64 / 64.66%
VZ $57.61 $49.53 8.08 / 14%
Our Core holding SUCK !!!!
Thank goodness we are making something up on the way down
Thank goodness we’ve added some shares and have a lot of cash to add more
Thank goodness we aren’t all in in Tech, Bonds, or Metals
The upside is huge
Help me understand leap long calls that are our replacement for stock ownership
Leap Long calls lose less than stock ownership and protection makes up downward movement so I don’t freak out
Last time the S&P 500 hit correction territory it bounced back to break even – History
What’s different: Inflation, roaring economy, Trump as president, China under control, higher interestrates and less liquidity, war, new corona virus, MonkeyPox Outbreak, Political Malaise, Food shortages, oil problems,
How to become more grateful, and why that will make you happier, healthier and more resilient
By David G. Allan, CNN | Posted – May 21, 2022 at 9:10 p.m.
How to become more grateful, and why that will make you happier, healthier and more resilient. (Ian Berry, CNNmoney)
ATLANTA — If you really think about it, so many of us should be in a perpetual state of gratitude.
Which of these do you have going for you right now? Family. Friends. Love. Health. Freedom from war and natural disaster. Imagination. Community. A roof over our heads. Common decency. Hope. Opportunity. Memories. Financial stability. Favorite places. Days off work. Good weather. The golden age of television. Books. Music. Ice cream. Weekends. A friendly exchange. Something good that happened today. Something bad that didn’t happen today.
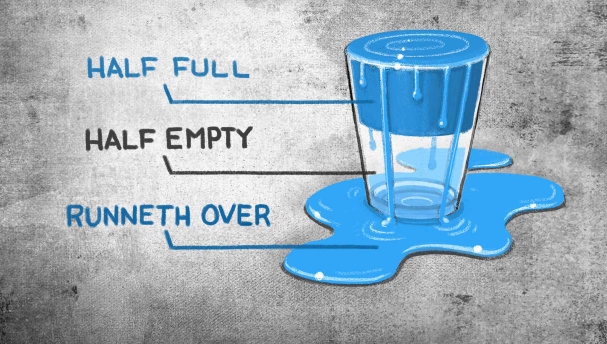
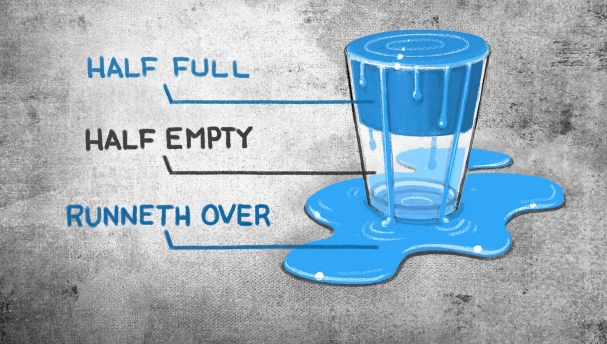
You may not have everything you want (or even need) on my list or yours, but that probably still leaves buckets — nay, container ships — full of tangible and conceptual items for which to be grateful. Things can always be better, but they can always be worse. It often depends on how you look at that proverbial glass of water.
To get in better touch with gratefulness — and get the health benefits of doing so — the trick is to find easy ways to count blessings more often than, say, over an annual turkey dinner. Keep your thankfulness boiling on the front burner of your mind, and you will increase your general appreciation of life.
Try to be more grateful for the small, mundane things that give you joy and meaning, as well as the big ones. Acknowledging just a handful each day will benefit you, and there are ways to make that a habit.
Grateful = healthful
Perhaps the most obvious benefit of displays of gratitude is that they are closely tied to increased feelings of happiness — for both the givers and the receivers.
In this week’s episode of CNN podcast Chasing Life, host Dr. Sanjay Gupta interviewed Christina Costa, a teacher and doctoral student at the University of Michigan who has studied neuroscience and psychology. She explained how you can see gratefulness on brain scans. The feeling lights up the “feel-good” neurotransmitters of dopamine and serotonin, which Gupta pointed out also decrease hormones like cortisol, associated with stress.
“The neurotransmitter reactions are pretty immediate,” Costa said. “It is hard to feel bad when you are focusing on someone that you are so grateful for, something that changed your life or something that is going really well today.”
It is hard to feel bad when you are focusing on someone that you are so grateful for, something that changed your life or something that is going really well today.
–Christina Costa, University of Michigan
Resilience, including the ability to cope with stress and trauma, is also correlated with gratitude. Studies have shown that counting blessings was a factor in managing post-traumatic stress for Vietnam War veterans and an effective coping strategy for many after the 9/11 terrorist attacks. Other research shows that the more grateful you are, the more you are likely to exhibit patience and self-control. It can even be good for marriages and relationships: Couples good at exhibiting thankfulness tend to be “more committed and more likely to remain in their relationships over time.” Our best selves, it seems, are our most grateful selves.
Studies have shown that gratitude can indirectly influence physical health, as well. “Gratitude strengthens your immune system and helps you experience less pain,” Costa said in the Chasing Life podcast.
Those who have “dispositional gratitude” — defined by one study as “part of a wider life orientation toward noticing and appreciating the positive in the world” — are more likely to report good physical health, a propensity for healthy activities and willingness to seek help for health concerns.
In another study, New York teenagers who rated as the most grateful in their class — defined by “having a disposition and moods that enabled them to respond positively to the good people and things in their lives” — were less likely to abuse drugs and alcohol. The benefits of having more gratitude also correlated with benefits to the heart among patients who had experienced heart failure.
Being grateful can even get you a better night’s sleep. According to one study involving college students who instituted various methods for increasing gratitude, such as a gratitude journal, they worried less at bedtime and slept longer and better. In another study, adults in the United Kingdom (40% of whom had sleep disorders), reported that thinking about what they are grateful for at night led to falling asleep faster and staying asleep longer.
Convinced?
How to up your GQ (gratefulness quotient)
I’m currently conducting two completely unscientific thankfulness-boosting experiments. For nearly two years, I’ve been keeping a gratitude journal. And for the last five years or so, my family has engaged in a dinnertime ritual called “Roses, Thorns & Buds” that surfaces the same details.
A lot has been written about these and other thankfulness experiments, and it should be noted that there are no rules or even standards that govern them. We’re in very, very soft science territory here. But reliable research does show that whatever you do to increase gratitude pays off, so it’s worth it to find what is easy, enjoyable and effective for you.
A gratitude journal need not be any more complicated than keeping a notebook by your bed and starting a nightly habit of jotting down who and what you were grateful for that day. Journaling was the standard method for some of the studies cited above, so this is a simple but effective option.
I’m coming up on two years of trying this one, and I added a layer you may want to consider. After one year, I took the time to total up all the mentions. My wife and children were, predictably, at the top, reminding me not to take them for granted. But I was surprised to see that coworkers, neighbors and a city park all ranked highly. It was useful for me to review in that way because when I see those people, I have this added layer of positive feeling about them at the forefront of my mind. It’s hard to get annoyed by someone when you think, “I’m so often grateful for that person.”
It was fun to play with the data, too. By category, “family” was the clear winner (1,011 instances) for me, followed by “places” (269 instances, with coffee shops being the biggest subcategory, “friends” (259), CNN “coworkers” (197) and “experiences” (133). Also, “Star Wars” (11) beat both beer (10) and books (8). It will be interesting to compare second-year totals against these. All of it is getting me closer to understanding and remembering what I’m most grateful for.
Roses, Thorns and Buds (or RTB, among its devotees) has been part of so many family dinners since my older daughter was 4 years old that I’ve forgotten where we first heard about it. It’s quite simple: Everyone at the table takes turns sharing “roses,” which are something positive and happy-making about their day; “thorns,” which are the opposite of that; and “buds” for something we’re looking forward to and we anticipate will be a rose. Sometimes, the family meal and sharing these things itself is a rose.
Granted, the “thorn” doesn’t necessarily increase gratitude — though it’s still useful from a family discussion, empathy and problem-solving perspective. And if you can fix a problem, a rose may grow in that thorn’s place.
Here are our unscientific findings: Each time, we find that we have many roses and buds and usually only one thorn to share.
Friends have told us about effective variations on this technique, so one size doesn’t fit all. If the metaphor is too flowery for you, pick another. Home runs, strikeouts and on deck? The important thing is to connect to the thankfulness in this way, whether you do it most evenings or on the occasional weekend. It’s also an easy way for kids to get into a thankfulness habit themselves.
Happiness jars, a strategy popularized by “Eat, Pray, Love” author Elizabeth Gilbert, is something of a hybrid of gratitude journal and RTB. The idea is to write down on a slip of paper the happiest moment of the day and drop it in a jar. The advantage of doing it this way is that in moments of unhappiness, you can reach into the jar and be reminded of those moments, perhaps becoming grateful for them anew. Gilbert was struck by how many of her fans shared photos of their decorated happiness jars (see Pinterest if you need inspiration) and by how her happiest moments are “generally really common and quiet and unremarkable.”
And there are other experiments to try. You could set alarms or reminders on your phone to pause and think of something you are grateful for at different times of the day: Mornings help set the tone of the day, and reflecting while at work can be particularly useful. You can then record them on a gratitude journaling app.
Or you could just focus on the simple act of saying thank you, and meaning it, more frequently. Writing letters of thanks (or emails if you want to be faster and more frequent) to those for whom you are grateful is worth doing with some regularity. You can also express gratitude with gifts, flowers and favors. Or simply make a list of all the things we take for granted but would be so unhappy to lose, such as job security, health, seeing loved ones. Review that list every week or so.
Whatever way you start infusing your life with more moments of gratitude, in the short and long term, you will be grateful that you did.
Earnings coming up:
BIDU 5/26 BMO
MU 6/30 est
https://www.briefing.com/the-big-picture
The Big Picture
Last Updated: 20-May-22 13:46 ET | Archive
The stock market has an earnings estimate problem
When 2022 began, the S&P 500 was trading at 21.3x forward 12-month earnings. When we published an updated market view on February 22, the S&P 500 was trading at 19.2x forward twelve-month earnings. At the time, the S&P 500 was down 8.6% for the year. It was lower priced alright, but we also said at the time that it wasn’t cheap.
Today, the S&P 500 is down 20% for the year and trades at 16.6x forward twelve-month earnings. The latter is an 11% discount to the five-year average (18.6) and a slight discount to the 10-year average (16.9), according to FactSet.
The stock market, then, is even lower priced than it was in February, but it still isn’t cheap.
Re-rating the Outlook
The multiple compression seen since the start of the year has been driven entirely by price. Forward twelve-month earnings estimates for the S&P 500 have not come down one bit. In fact, FactSet informs us that they have increased since the start of the year from $221.80 to $235.81.
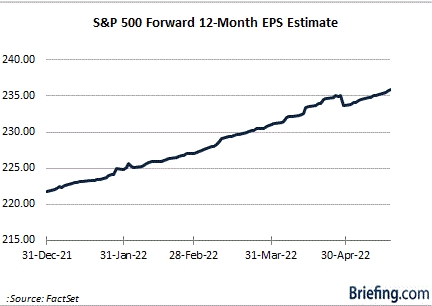
The upward revision in the earnings estimate has been influenced by the earnings momentum of the energy sector and better-than-expected first quarter earnings in aggregate. Nevertheless, with profit margin pressures becoming apparent in the first quarter reporting period due to a reduced ability to pass along higher costs to customers, it is immensely difficult to believe that the aggregate earnings estimate for the S&P 500 is going to remain in an uptrend.
The stock market has been having some strong doubts about that, too.
Those doubts have manifested themselves in the nasty price action, which is partly a correction of the speculative excess that had been driven by excess liquidity and animal spirits, but mostly a re-rating to reflect a changing world that includes the highest inflation rate in 40 years, a seminal shift by many of the world’s leading central banks to try to tackle inflation, a war in Ukraine, and COVID-related lockdowns in China that have exacerbated supply chain bottlenecks.
In brief, the re-rating is a byproduct of economic and earnings growth concerns.
Not Seeing Eye to Eye
The stock market is a forward-looking entity. Stock analysts are part of the stock market, but the two are not seeing eye to eye.
Given the earnings estimate trend, it appears as if stock analysts see blue skies ahead. The stock market, on the other hand, has acted as if a damaging storm front is rapidly approaching with respect to the earnings outlook.
Stocks simply do not trade the way they have been trading so far this year if there is confidence in meeting the earnings growth estimate.
The market’s confidence has been shaken by the Fed’s hawkish-minded pivot, which has a declared aim of raising the policy rate to weaken demand, record-high gas prices, weakening consumer sentiment, sharp declines in asset values, a spike in mortgage rates, and burgeoning evidence that corporate profit margins are contracting largely as a result of inflation pressures.
The market is also contending with an unsettling thought that the Fed is going to be overly aggressive with its rate-hike approach and invite a recession for the U.S. economy.
The latter is at the heart of the earnings matter. Wall Street firms are cutting GDP growth estimates at the same time stock analysts are raising their earnings estimates. It just doesn’t add up.
Evidence Mounting
There is enough anecdotal evidence to support the downward revisions to GDP growth forecasts:
- Real average hourly earnings continue to be negative.
- The average price of gas is above $4.00 in all 50 states for the first time ever; meanwhile, retail diesel prices are at a record high, raising the cost of freight transportation.
- Shanghai, the largest city in the world, has been shutdown for weeks as part of China’s zero-tolerance COVID policy.
- Europe is suffering under the weight of exorbitant costs for energy, driven in part by the war in Ukraine and efforts to reduce dependence on energy supplies from Russia.
- Many of the world’s leading central banks are intent on removing policy accommodation to fight inflation.
- A BofA report indicates the global equity market cap has been reduced by $23.4 trillion since the November 2021 peak.
- The Conference Board measure of CEO sentiment showed 57% of respondents expect a “very short, mild recession.”
- The Federal Reserve is intent on raising the fed funds rate to weaken demand; Fed Chair Powell said 50 basis point increases are likely at the next two FOMC meetings.
- Walmart (WMT) pointed to shifts in consumer behavior that include trading down to less expensive private label brands.
We could cherry pick other items supporting the cut to economic growth estimates. The overarching point, however, is that the body of anecdotal evidence does not lean in favor of raising earnings growth estimates. That point should start to hit home for analysts in coming weeks and months as incoming economic data increasingly reflect the headwinds of rising interest rates, supply chain bottlenecks, weakening consumer sentiment, a strong dollar, and persistent inflation pressures.
Soon enough, then, earnings growth estimates should start coming down. Consequently, the discount in the forward 12-month P/E multiple seen today is not the discount it appears to be.
At current prices, a 10% cut in the forward 12-month earnings estimate, which is somewhat conservative for an economy slowing sharply and potentially sliding into a recession, would translate to a forward 12-month P/E multiple of 18.2x, which is 8% above the 10-year average.
What It All Means
What stands out to us in the recent stock market action is that stock prices have continued to struggle even as longer-dated Treasury yields have come down. To wit: the 10-yr note yield hit 3.17% on May 9 and today it sits at 2.79%. Over the same period, the S&P 500 has declined 6.0%.
The stock market has not responded more favorably to that drop in rates because it recognizes that the drop in rates is a reflection of growth concerns. Frankly, it has also been related to the drop in stock prices, which has fostered a renewal of safe-haven flows into Treasuries that now at least have a little more competitive income appeal versus a 1.69% dividend yield for the S&P 500.
The drop in the 10-yr yield might slow the pace of multiple compression from here, all else equal. What we have alluded to, though, is that we don’t expect all else, namely earnings estimates, to remain equal.
Earnings estimates are going to come down. It’s just a question of when and how much.
That uncertainty has been a terrible drag on investor sentiment because investors can’t be certain they are getting a real value at this point knowing earnings estimates have yet to be cut.
Be that as it may, the angst surrounding this year’s downturn is becoming palpable, meaning we might be on the cusp of a selling climax that eventually gives way to a material rebound effort.
88% of the stocks in the S&P 500 are trading below their 50-day moving average while 77% of the stocks are trading below their 200-day moving average. The S&P 500 is down 20% for the year and down 15.8% alone since the start of the second quarter. The Nasdaq Composite is down 29.3% for the year and down 22.2% since the start of the second quarter.
The stock market is oversold on a short-term basis. It has the potential to wage a powerful rebound effort with investor sentiment being as depressed as it is and cash levels among fund managers being at their highest (6.1%) since 9/11, according to the BofA Global Fund Manager Survey.
Sentiment-driven rallies can be fast and furious, but in the end fundamentals take precedence. The fundamental outlook right now is not good.
Inflation remains a problem, policy rates need to go a lot higher to get inflation in check, and the trend in earnings growth estimates is not aligned with the more challenging economic environment that is on the way.
Stock prices have come down a lot, which leaves them ripe for a tactical rally effort, yet earnings estimates have not come down at all. They will, which is why today’s discounted P/E multiple can’t be looked at unequivocally as being cheap and why sentiment-driven rallies will eventually hit a wall of fundamental resistance.
—Patrick J. O’Hare, Briefing.com
| https://go.ycharts.com/weekly-pulse |
| Market Recap WEEK OF MAY. 16 THROUGH MAY. 20, 2022 The S&P 500 index fell 3% last week, reaching lows not seen since March 2021 and putting it on the brink of bear-market territory, as disappointing quarterly earnings from retailers added to investors’ concerns about the impacts of inflation on the economy. The market benchmark ended the week at 3,901.36, down from last Friday’s closing level of 4,023.89. It is now down 5.6% for the month of May and has declined 18% in the year to date. This marks the S&P 500’s seventh consecutive week in the red. The index has only had five losing streaks that long since 1928, and hasn’t had one since an eight-week slide that ended in March 2001, according to Howard Silverblatt, senior index analyst at S&P Dow Jones Indices. Friday, the index flirted with bear-market territory as it moved below 3,837.24, which would mark a 20% drop from its Jan. 3 closing high of 4,796.56. The index hit 3,810.32 at its lowest intraday level Friday. However, because the S&P 500 didn’t close at or below 3,837.24, it is still considered in a bull market for now. The week’s decline came as the latest quarterly reports from retailers including Walmart (WMT) and Target (TGT) showed negative impacts from inflation digging into earnings results. Walmart lowered its fiscal 2023 profit outlook after reporting weaker-than-expected fiscal Q1 adjusted earnings per share amid supply chain disruptions, increased costs and persistent inflationary pressures, mainly on food and fuel. Target, meanwhile, reported Q1 adjusted earnings per share below analysts’ expectations amid what CEO Brian Cornell described as “unexpectedly high costs.” Most sectors were in the red for the week. Consumer stocks had the largest declines of the week, with consumer staples down 8.6% and consumer discretionary down 7.4%. Technology fell 3.8%, industrials shed 3.7% and communication services lost 3%. Other decliners included real estate, financials and materials. Three sectors posted gains last week but the gains were slight. Energy rose 1.1%, health care edged up 0.9% and utilities eked out a 0.4% increase. In consumer staples, Walmart dropped 19% last week. Costco Wholesale (COST) also was hit hard, shedding 16% in sympathy with Walmart. In consumer discretionary, Target slid 29% while other decliners in the sector included Bath & Body Works (BBWI), whose shares fell 24% as the retailer of soaps and fragrances reported adjusted fiscal Q1 earnings per share and revenue above analysts’ expectations but forecast Q2 earnings below the Street view and cut its profit guidance for the fiscal year. The energy sector’s advance came as crude oil and natural gas prices rose. Among the gainers, Pioneer Natural Resources (PXD) and Devon Energy (DVN) added 1.8% each. Looking ahead, inflation data will be in focus next week as April inflation figures are due to be released on Friday. Next week will also feature housing data, with April new home sales due Tuesday and April pending home sales due Thursday. Other data will include April durable goods orders on Wednesday and revised Q1 gross domestic product on Thursday. Provided by MT Newswires |
Where will our markets end this week?
Lower
DJIA – Bearish

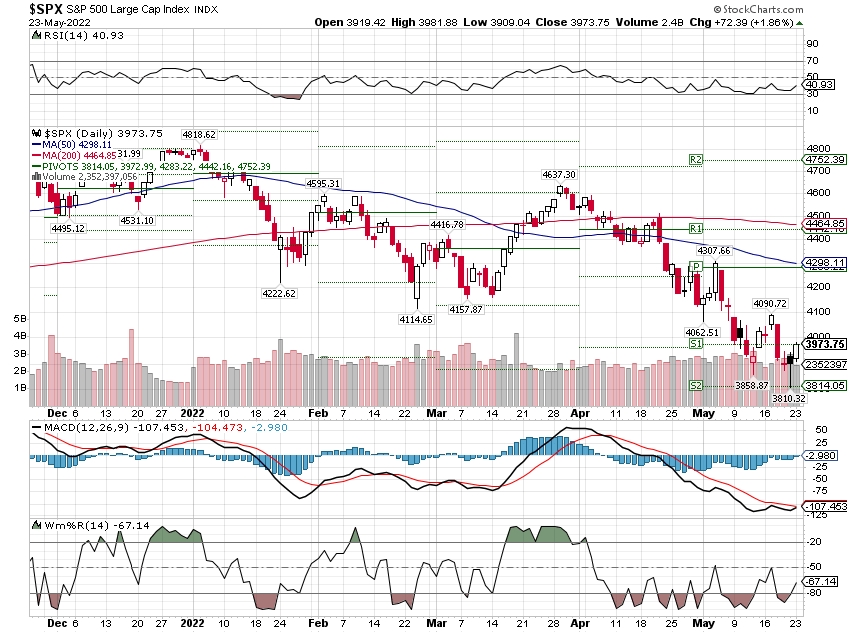
SPX – Bearish
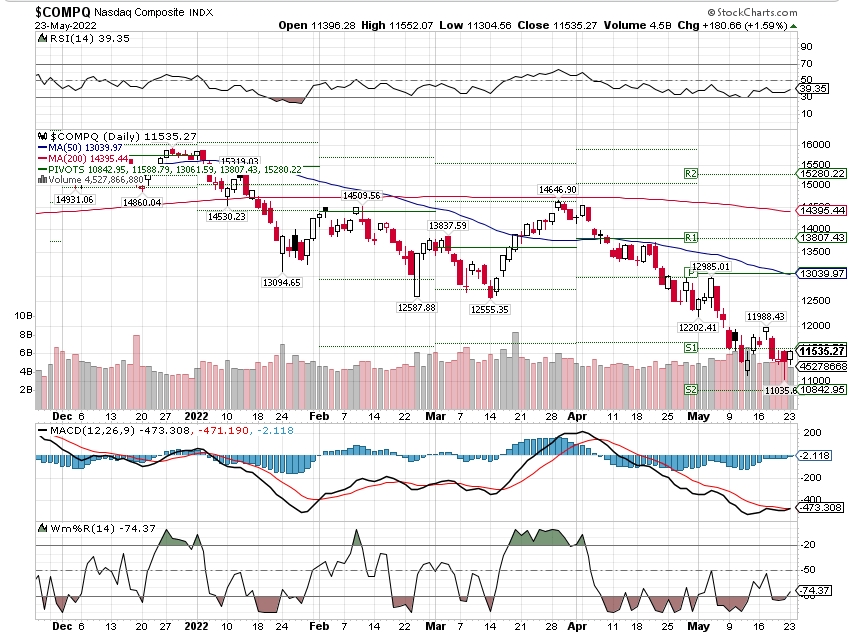
COMP – Bearish
Where Will the SPX end May 2022?
05-23-2022 -5.0%
05-16-2022 -3.0%
05-09-2022 -2.0%
05-02-2022 -2.0%
Earnings:
Mon: ZM
Tues: ANF, AZO, BBY, NTES, RL, JWN, TOL, URBN
Wed: DKS, GES, NVDA
Thur: BURL, M, AEO, GPS, MRVL, ULTA, BABA, BIDU, DG, DLTR, COST
Fri: BIG
Econ Reports:
Mon:
Tues: New Home Sales,
Wed: MBA, Durable Goods, Durable ex-trans, FOMC Minutes
Thur: Initial Claims, Continuing Claims, GDP, GDP Deflator, Pending Home Sales
Fri: Personal Income, Personal Spending, PCE Prices, PCE CORE, Michigan sentiment
How am I looking to trade?
Currently protection on all core holding and making decisions on earnings,
www.myhurleyinvestment.com = Blogsite
customerservice@hurleyinvestments.com = Email
Questions???
Yes I think we have some kind of short term rally because we are oversold 5-10% range higher = June
Tech stocks are mired in their longest weekly losing streak since dot-com bust
PUBLISHED FRI, MAY 20 20225:00 PM EDTUPDATED FRI, MAY 20 202210:51 PM EDT
SHAREShare Article via FacebookShare Article via TwitterShare Article via LinkedInShare Article via Email
KEY POINTS
- The Nasdaq dropped 3.8% this week, notching its seventh straight weekly drop.
- It’s the tech-heavy index’s longest weekly losing streak since 2001 during the dot-com bust.
- The Nasdaq is 29% off its record reached in November, while the S&P 500 briefly fell into bear market territory on Friday, down 20% from its high.
Tech companies haven’t seen a selloff like since 2001 and the bursting of the dot-com bubble.
The Nasdaq declined 3.8% this week, falling for a seventh straight week. It’s the longest losing streak for the tech-heavy index in 21 years.
Inflation, rising interest rates, the war in Ukraine and pandemic lockdowns in China are adding up to a disastrous market in general and a particularly brutal stretch for investors in technology and growth stocks, after historic rallies in recent years.
The Federal Reserve has signaled it will continue to increase rates to fight inflation, leading to concern that higher costs of capital will combine with deteriorating consumer confidence to eat away at profit margins.
The Nasdaq has lost over 29% since its peak on Nov. 19, closing on Friday at 11,354.62. The S&P 500 hasn’t fared as badly, but it still touched bear market territory on Friday, meaning a 20% drop from its high.
Cisco was among the biggest tech losers for the week, falling 13%, after the computer networking giant projected an unexpected revenue drop in the current quarter. Once seen as a bellwether for the economy given its prevalence in enterprises, Cisco said its guidance reflects the company’s decision to cease operations in Russia and Belarus coupled with supply shortages due to Covid-19 lockdowns in China and uncertainty about when things will improve.
“Given this uncertainty, we are being practical about the current environment and erring on the side of caution in terms of our outlook, taking it one quarter at a time,” the company said on its earnings call.
Dell, which reports results on Thursday, tumbled over 11% for the week. Shopify, which sells software for e-retailers, dropped almost 10%. Cloud software company Workday fell about 9% after analysts downgraded the stock on recession fears. Security software vendor Okta slid 14%.
Stocks associated with billionaire Elon Musk also took a hit. Twitter, which is currently in the process of being purchased by the Tesla CEO for $54.20 per share, fell 6% this week to $38.29. Tesla tumbled 14%.
Within Big Tech, Apple dropped 6.5%, suffering its eight-straight weekly drop. Alphabet sank 6%, while Amazon fell by about 5%.
The Nasdaq is now down 20% for the quarter and is on pace for its worst quarterly performance since the fourth period of 2008.
A History Of Recessions & Market Responses
Let’s start with the definition of what a recession is. According to the National Bureau of Economic Research (NBER), the agency responsible for dating recessions, a recession is a period of two, or more, consecutive quarters of negative economic growth. While the “R-Word” gets discussed in the financial media as if it is the “coming apocalypse,” in reality, it is a period of declining economic growth.
The chart below shows the historical length of recessions over time.
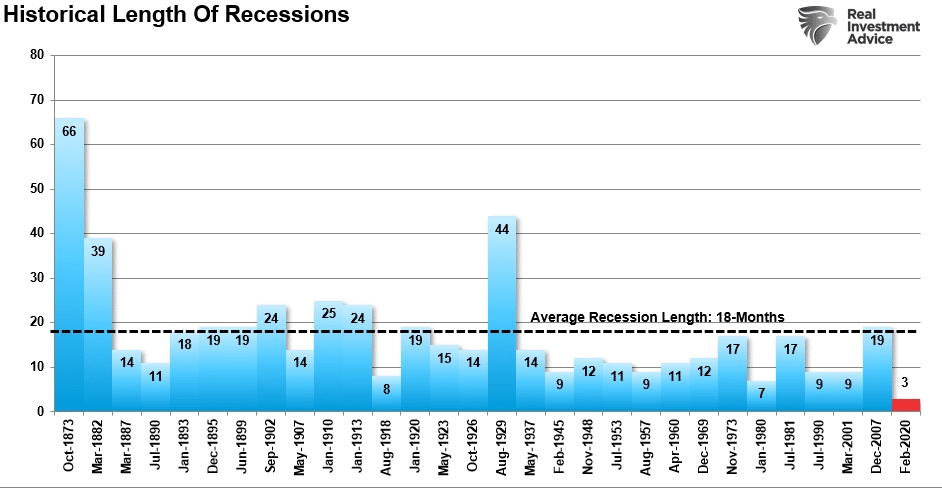
Notably, the risk to investors during an economic recession is high. Historically, markets tend to correct rather sharply during recessionary periods.
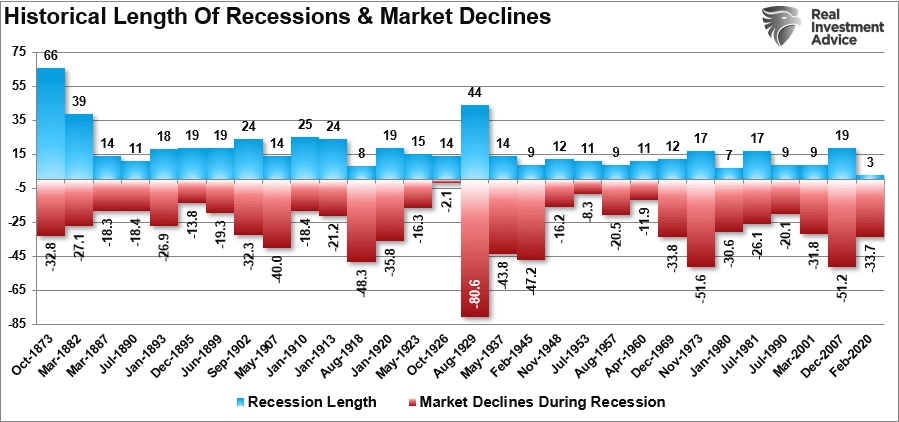
The markets reprice the excess valuations given to financial assets during the previous expansion. Higher valuations during expansions tend to precede deeper reversions during recessions.
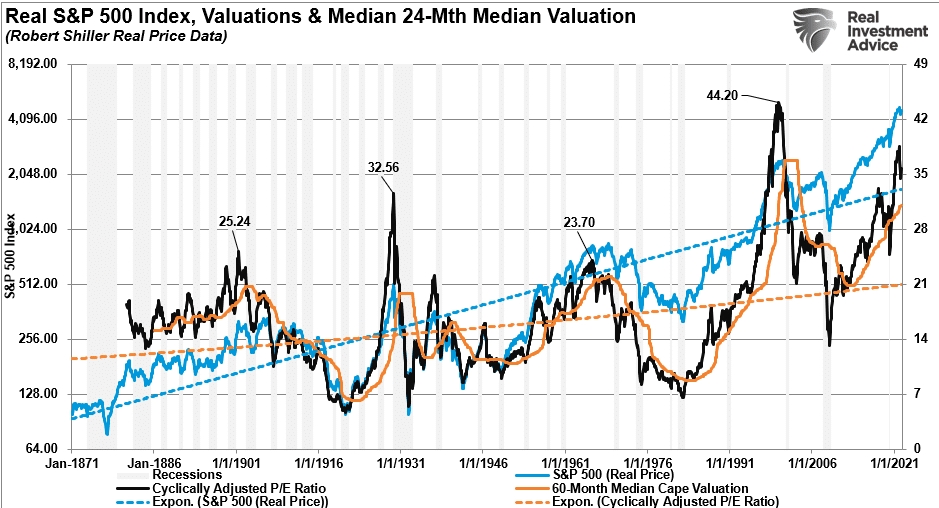
As is evident, recessions are coincident with market corrections and bear markets. The problem with trying to avoid a recession, from an investment perspective, is this: by the time a recession is evident, it is often too late.
Recession Coming?
“Is a recession coming?” That is the question currently.
A few weeks ago, the mainstream media, Wall Street, and the Fed suggested the economy was strong and “no recession” was visible. Such may have been the case until Walmart and Target reported their earnings for the first quarter noting a sharp drop in revenue and inventory builds.
Those comments changed everything. Suddenly, not only is a recession coming, it may be already here. According to a Quinnipiac poll, many Americans think the economy is heading into a recession.
“The Quinnipiac University Poll found that 85% think it is likely or somewhat likely there will be an economic recession in the next year amid fears of slowing growth and runaway inflation. Only 8% think it is ‘not so likely,’ and 4% don’t see a recession happening at all.”
As Quinnipiac concluded:
“Americans believe a recession is not a mere threat, it’s a looming reality,”
Don’t overlook the importance of that poll. Consumption makes up 70% of the economy. If Americans think a recession is coming, they will begin to contract spending and shift behaviors to prepare for a downturn. Ironically, those actions cause the recession to occur.
But it’s not just consumers. CEOs are also increasingly downbeat, which means less hiring, increased layoffs, and less capital spending, contributing to a recessionary drag.
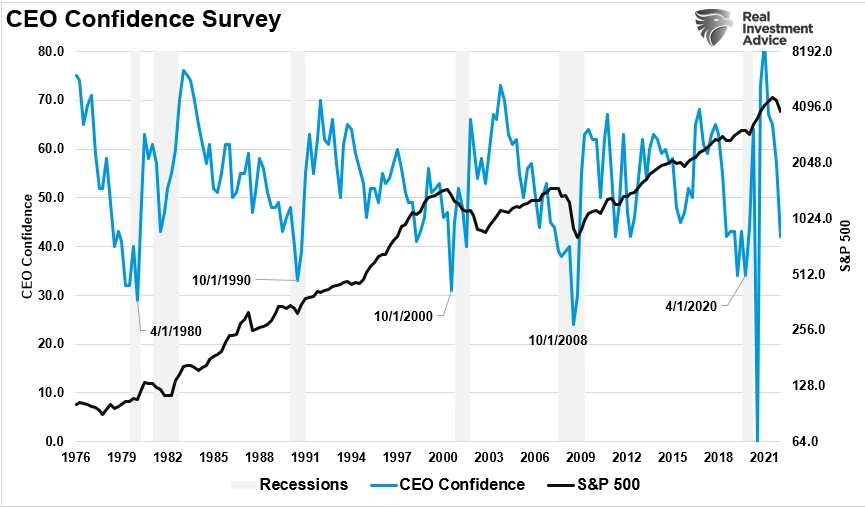
The chart below combines the CEO and Composite Consumer Confidence measures. As shown, previous downturns in both measures tend to denote recessionary outcomes.
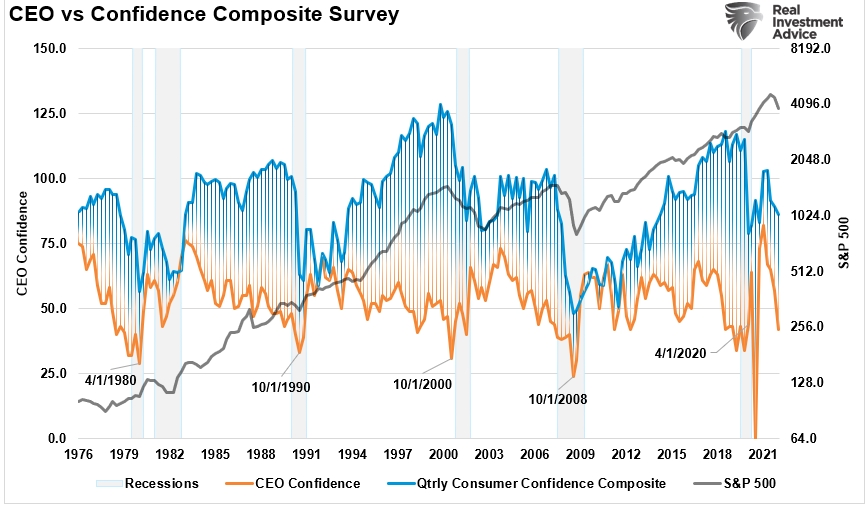
Here is the problem, we won’t know for sure until it is too late.
The technician who called the 2020 market bottom says a ‘shocking rally’ is in store
Last Updated: May 20, 2022 at 7:08 a.m. ETFirst Published: May 20, 2022 at 6:46 a.m. ET
It’s been a terrible week in an awful year for the stock market.
Walmart WMT, Target TGT, and Tencent HK:700 each reported disappointing results to add fuel to the worries about interest-rate hikes and quantitative tightening. But, Melvin Capital aside, there haven’t been signs of capitulation.
Over the last six weeks, equity redemptions have totaled $46 billion, versus $91 billion when the COVID outbreak first became apparent, according to Sean Darby, chief equity strategist at Jefferies. So you could see the argument on why markets may not have plumbed their depths.
Noted technician Tom DeMark, who called the bottom in 2020 after COVID emerged, disagrees. The founder of DeMark Analytics — known for advising hedge fund managers like Paul Tudor Jones and Steven Cohen — told Fundstrat’s head of technical strategy Mark Newton that key markets are on the verge of reversing.
DeMark’s indicators are designed for anticipating turning points, to find overextended price moves, in either direction, that reverse.
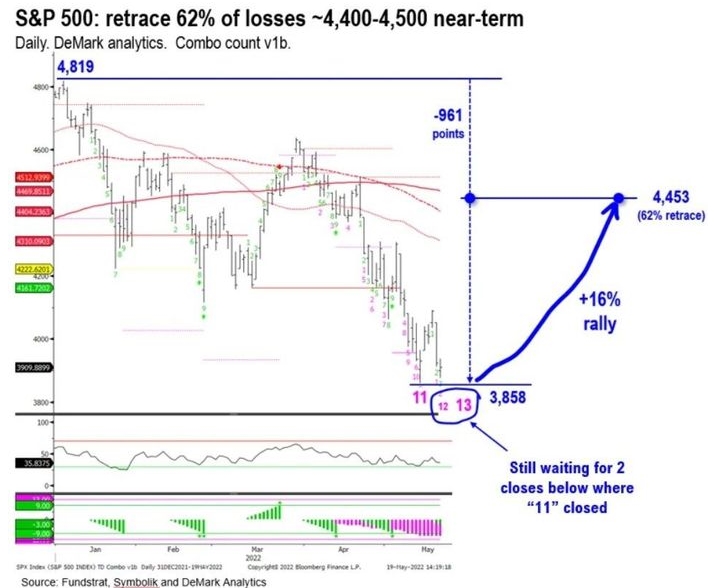
The S&P 500 SPX, DeMark says, will see one more sell-off, with a close below 3,863, before a “shocking rally” lifts the index between 4,400 and 4,500. The 10-year BX:TMUBMUSD10Y will make one more high before peaking, and crude oil CL will make a top within four trading days — $117.29 per barrel, he forecasts — before turning lower.
The fundamental implications, if he’s correct, would be that the inflationary drivers of energy and commodities are peaking, which would put less pressure on inflation.
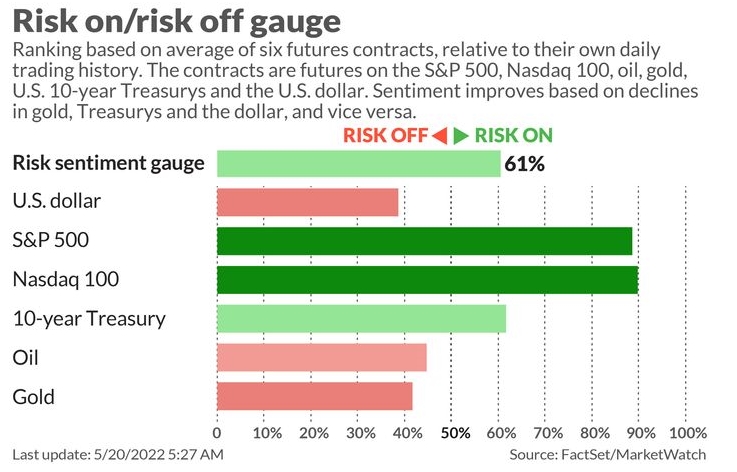
U.S. stock futures pointed to a strong open, with futures on the Dow Jones Industrial Average YM00 rising around 250 points.
The yield on the 10-year Treasury BX:TMUBMUSD10Y was 2.85%.
Top tickers
Here were the most active stock-market tickers as of 6 a.m. Eastern.
HI Financial Services Mid-Week 06-24-2014