
HI Market View Commentary 02-17-2020
Page One
Last Updated: 14-Feb-20 09:03 ET
Affection for bull market remains
The S&P 500 is up 1.4% for the week entering today’s session, making it clear that today — Valentine’s Day — is going to have to be a very bad day with lots of breakups for this week to end up being a down week for the stock market.
The early indication in the futures market, though, reflects a feeling of ongoing affection for this bull market.
The S&P futures are up two points and are trading 0.2% above fair value. The Nasdaq 100 futures are up eight points and are trading 0.2% above fair value. The Dow Jones Industrial Average futures are down nine points and are trading 0.1% above fair value.
Positive responses to earnings reports from companies like NVIDIA (NVDA), Roku (ROKU), and Expedia Group (EXPE) have provided some bullish-minded support, but so has the otherwise ho-hum performances of foreign equity markets.
The resolve of markets in Asia, amid yet more reports of escalating coronavirus deaths and cases, and the resolve of markets in Europe, amid more reports of weak economic growth, has kept selling interest in check.
The Shanghai Composite, for instance, increased 0.4%; meanwhile, Germany’s DAX Index is up 0.1% even though a flash GDP report showed the German economy stagnated (i.e. no growth) on a quarter-over-quarter basis in the fourth quarter.
Such reports just stir the pot of stimulus expectations, which naturally stir the bullish emotions of global equity markets that undoubtedly see central banks as their true love this Valentine’s Day.
That love could be put to the test, though, in coming weeks as the Fed begins reducing its influence in the repo market. Daily overnight operations, according to the New York Federal Reserve, will be cut by $20 billion to a maximum of $100 billion.
Technically, this shouldn’t be a source of upset for the stock market, unless the repo market seizes up again, but we point this out because it has been said that the stock market’s strong finish last year and fast start this year has been aided by the Fed’s reserve management efforts and bid to keep liquidity flowing in the repo market.
There were some accusations yesterday that the stock market’s impressive rebound effort faded into the close after it was learned that the Fed would be reducing its influence over the repo market.
In any event, it is a narrative to keep tabs on in coming weeks, particularly if the stock market doesn’t act well since this will be a popular excuse to explain any bad acting.
For now, some tabs are being kept on the Retail Sales report for January, which was in-line with expectations. Total retail sales increased 0.3%, as did retail sales, excluding autos. There were slight downward revisions to the December data.
The key takeaway from the report is that discretionary spending was modest in January, which will contribute to a sense that Q1 GDP growth was apt to be modest even without any impact from the coronavirus.
Separately, import prices were flat month-over-month in January and were up 0.2% excluding fuel. Export prices were up 0.7%, which was also the case excluding agricultural products.
On a year-over-year basis, import prices were up 0.3%, and down 0.9% excluding fuel. Export prices were up 0.5%, and up only 0.2% excluding agricultural products.
The key takeaway from the report is that there were no inflation alarm bells in it for the Federal Reserve.
—Patrick J. O’Hare, Briefing.com
So what I wanted to talk about I’m going to wait for a week before I divulge my thoughts.
Let’s go over strategy = Collar Trade or adding protection during the more volatile times in our markets
WE ARE NOT day trading the noise that is out on every single new headline.
People who are day trading the new are getting their butts handed to them the next day
The protection on positions allows you to have better patience and make an less stressful decision
Where will our markets end this week?
Higher
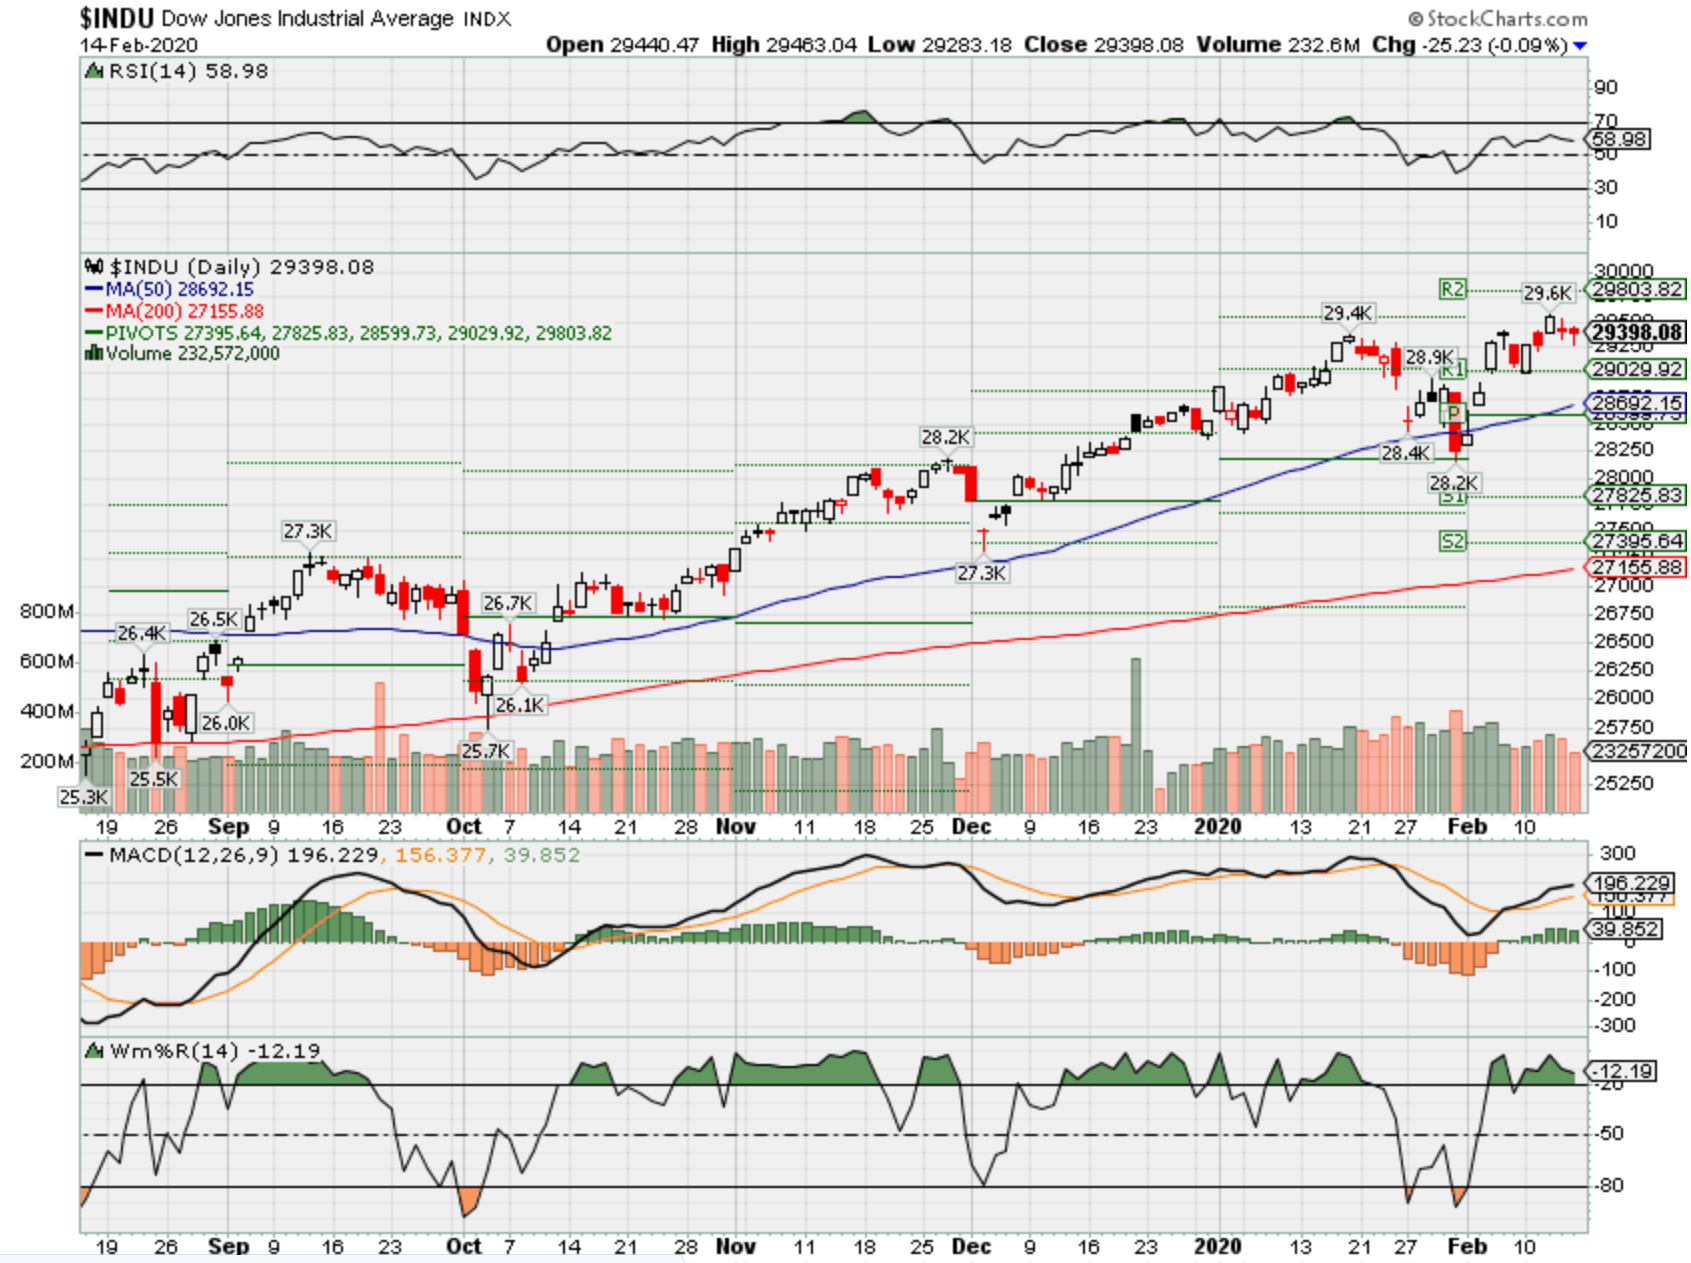
DJIA – Bullish
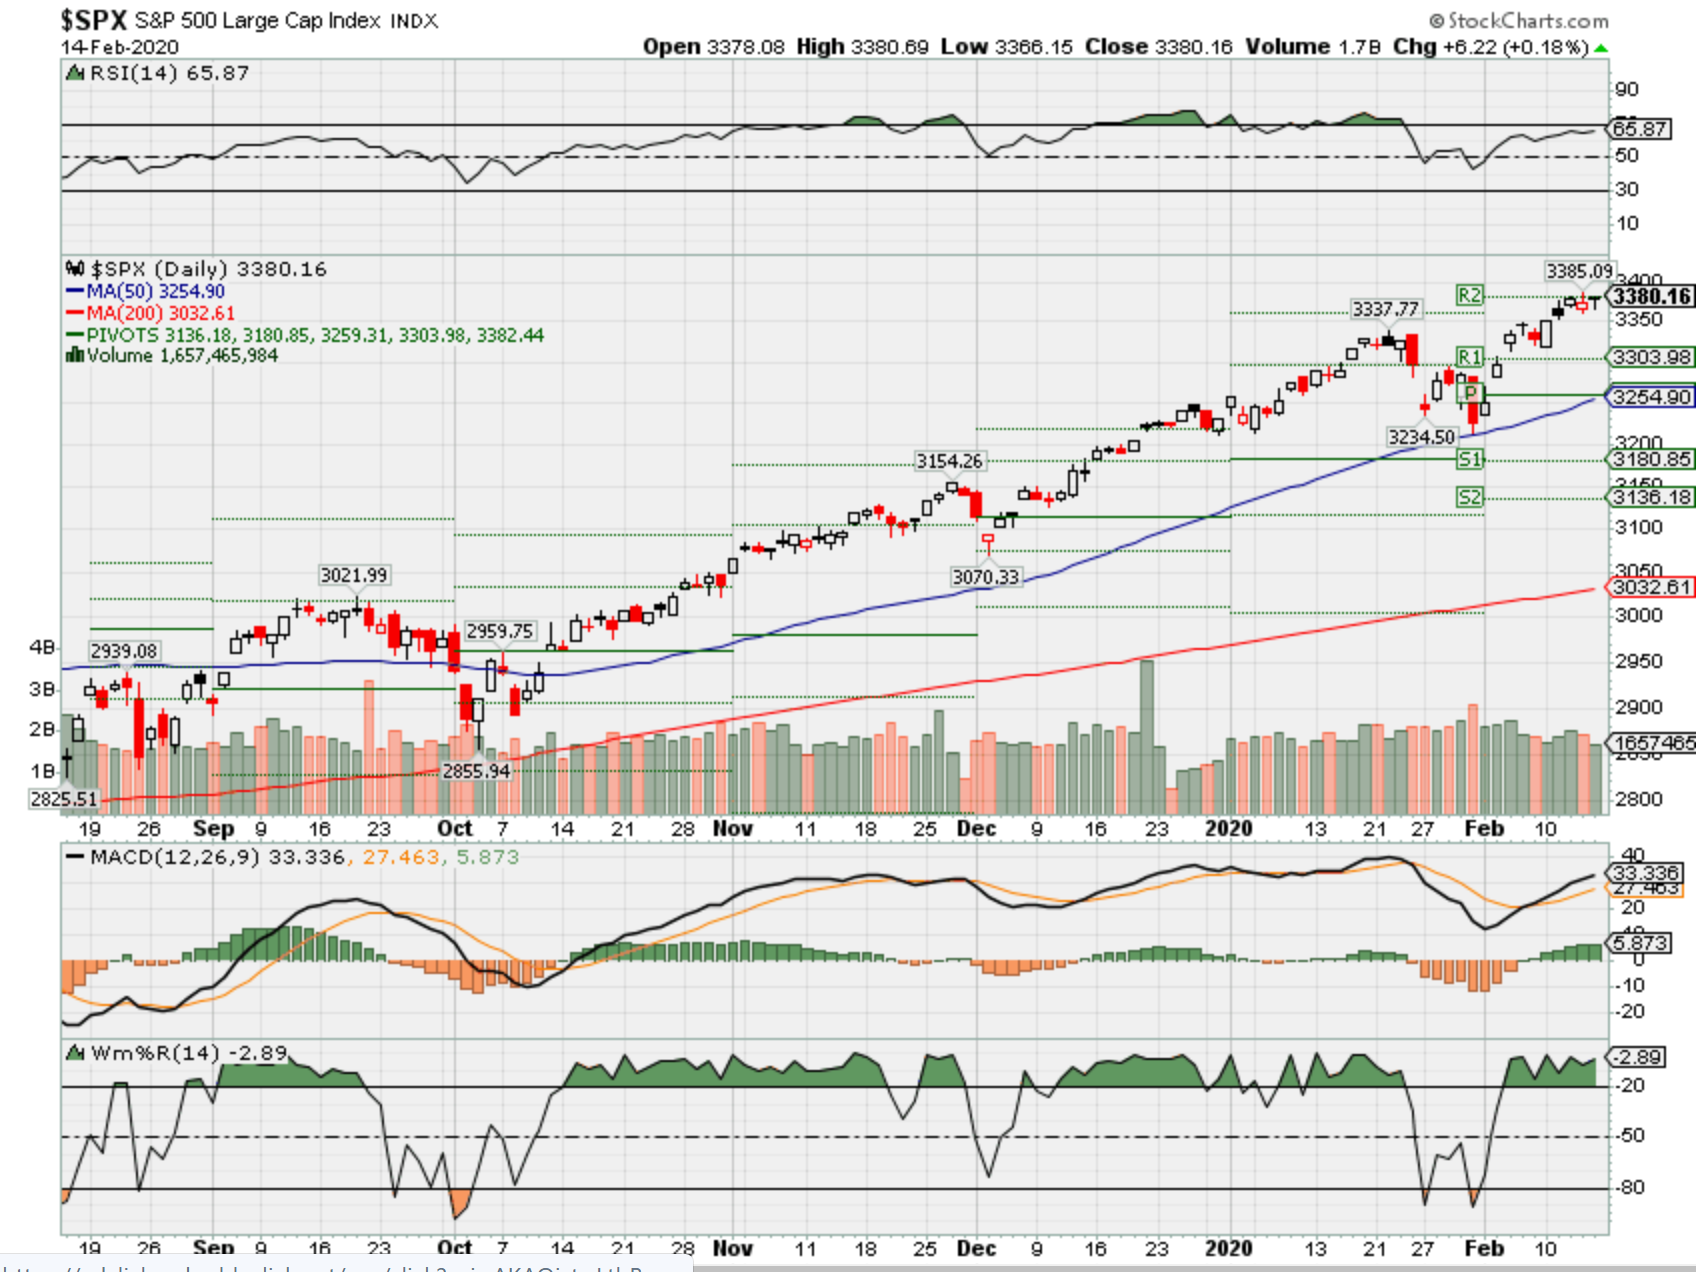
 SPX – Bullish
COMP – Bullish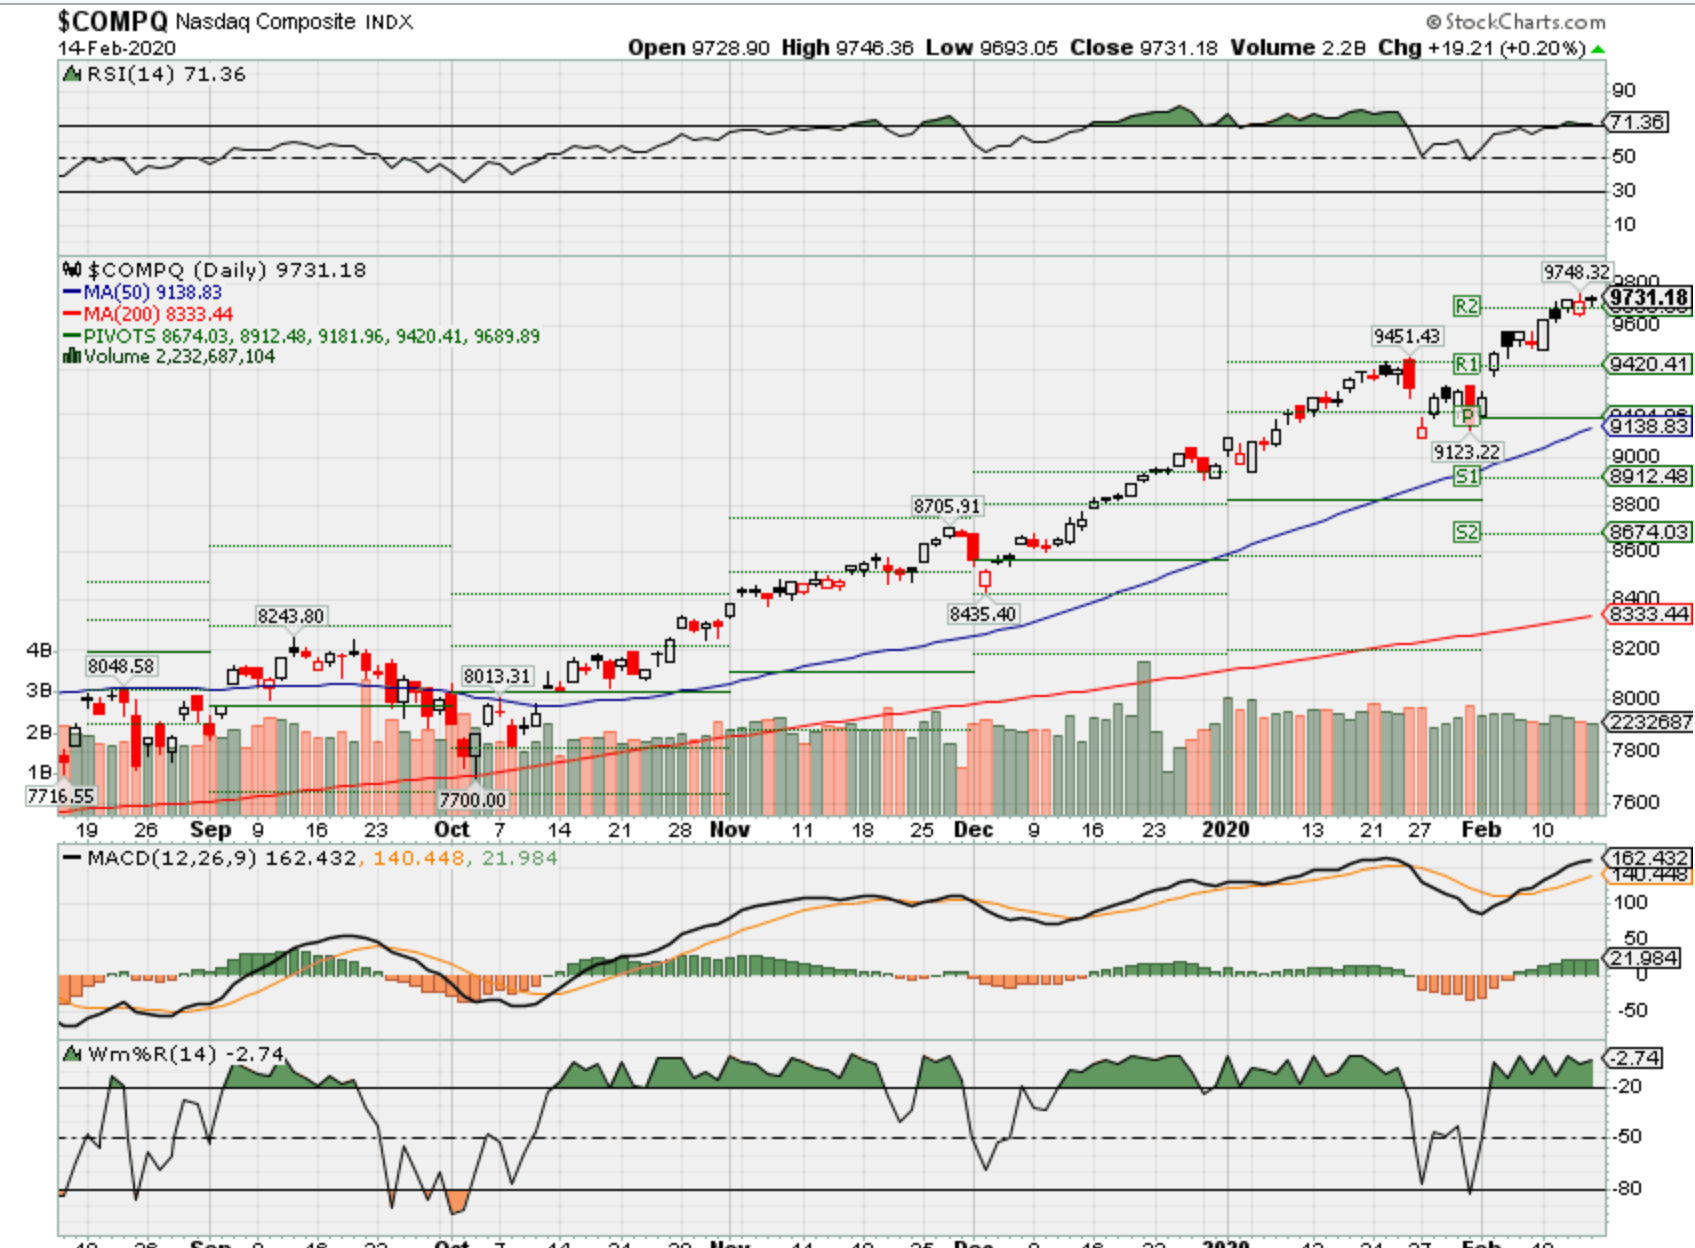
Where Will the SPX end February 2020?
02-17-2020 0.0%
02-10-2020 -2.0%
02-03-2020 -2.0%
Earnings:
Mon:
Tues: FLR, JELD, MDT, VG, WMT, A, DVN, GRPN, HLF
Wed: GRMN, FOSL, MOS, NTES, VMI, ZG
Thur: AKS, DPZ, HRL, SOHU, DBX, FSLR, NEM
Fri: DE, USM
Econ Reports:
Mon: President’s Day – Market Closed
Tues: Empire, NAHB Housing Price Index, Net Long Term TIC Flows
Wed: MBA, PPI, Core PPI, Housing Starts, Building Permits, FOMC Minutes
Thur: Initial, Continuing, Phil Fed, Leading Indicators,
Fri: Existing Home Sales,
Int’l:
Mon – CN: Housing Price Index
Tues –
Wed –
Thursday – CN: PBoC Interest Rate Decision
Friday-
Sunday –
How am I looking to trade?
Earnings are coming up and protecting through earnings with protective puts and NO short Calls
AOBC – 3/05 est
BIDU – 2/27 est
MU – 3/19 est
NEM – 2/20 BMO
TGT – 3/03 est
www.myhurleyinvestment.com = Blogsite
customerservice@hurleyinvestments.com = Email
Questions???
The Boeing Dividend: Money Is Cheap
Feb. 12, 2020 7:30 AM ET
Summary
Boeing spent significant share of its borrowings to repay debt and return value to shareholders.
Low interest environment invites for imprudent decisions.
Coupling underfunded pension plan to share prices is one such decision that keeps Boeing a step away from cutting dividends.
I do much more than just articles at The Aerospace Forum: Members get access to model portfolios, regular updates, a chat room, and more.
Throughout the Boeing (BA) 737 MAX crisis, Boeing has suffered a big blow to its reputation. The mistakes that were made are clear. And that itself wouldn’t directly destroy a company’s reputation, but with Boeing it’s different. The reason is that with Boeing it has looked as if the company allegedly willfully put out an unsafe product to optimize profits, or at least that’s the perception. In this report, I look at what probably is one of the most questionable dividends currently being paid.
Looking at the MAX and the MAX culture
I believe that Boeing made big mistakes during the development of the Boeing 737 MAX and in the way it handled the MAX crisis, mistakes that should never have been made and mistakes that wouldn’t have been made if Boeing would have not eroded the strong fundamentals of airplane design and certification. I don’t believe Boeing intentionally sold customers a death trap, but in an effort to be competitive, the company simply underestimated the need of additional pilot training for Boeing 737 MAX pilots. Possibly Boeing didn’t make decisions based on our assumptions, but looked for assumptions that would fit their decision.
You could say that Boeing should have designed an all-new aircraft and that the company went with the cheap MCAS solution. MCAS is indeed the cheap solution. But I think every Boeing critic should be aware that the Boeing 737 MAX aircraft didn’t crash because Boeing decided to go with a piece of software to maintain appreciable handling qualities, but because the MCAS design and robustness was really below par and Boeing did not inform regulators and airlines customers sufficiently while it used flawed assumptions in the design and certification process, which led to Boeing underestimating the consequences of system failure.
Everybody has their view on Boeing’s decision. The fact is that in engineering there often are tradeoffs between cost and design, but it should never compromise safety. With Boeing, that went horribly wrong as they burned through all safety nets typical with the design process, as the company made wrong assumptions, and within the company nobody seemed to take responsibility for the decisions that were made. Decisions were made, they were defended, but nobody questioned or owned them.
Boeing supports dividend
The way Boeing handled the crisis made the company look extremely bad and made the company look as if it has no moral code and no ethic compliance. One of the things that really doesn’t sit well with not only the traveling public, but lawmakers and even investors, is that despite facing a deep crisis Boeing continues paying a dividend. Obviously if a company allegedly tried to save a buck, which led to not one but two fatal accidents, not suspending the dividend is a thorn in the side.
Any day, I would be happy to state that I have an 8% yield on costs with my Boeing shares, but at the moment I/m unhappy that the company maintains its dividend. In December, I spoke to The New Republic explaining where Boeing’s money is currently coming from and I also explained, as I have done often in brief form over the past couple of months on Seeking Alpha, that fundamentally there’s no reason to be paying a dividend.
Boeing paying a dividend seems to be a matter of “just because you can, does not mean you should.” One reason is because the dividend payment bolsters Boeing’s image as a greedy company that lost its moral compass, and the second reason is the financial aspect, which is the main subject of this report.
Loading debt to pay a dividend
In late 2019, Dennis Muilenburg departed from Boeing as he upset the regulator and put pressure on regulators, ultimately failing to bring the MAX back in service by year-end. His successor, David Calhoun, is known as a more charismatic person from whom it was expected that he will be much more humble, but he was very quick to support shareholders stating that the dividend would be maintained. So, seemingly touching the dividends is off limits, and while I don’t find it surprising that the dividend hasn’t been halted or reduced, it’s not really a decision that makes sense, except for one reason as I discuss later on.
You have to look no further than Boeing’s debt to see why paying a dividend is not healthy. In 2019, Boeing borrowed $25.4B. That’s a huge pile of cash. In previous years, Boeing could comfortably fund share repurchases and dividends with its cash provided by operating activities. That wasn’t the case in 2019 as the company saw cash from operating activities being negative $2.4B and free cash flow being negative $4.3B. For years Boeing has prided itself with returning its free cash flow to investors. By that logic, once the free cash flow goes negative for a longer period, the dividend should have come down as well. Instead, Boeing only froze the dividend.
The big question is “How did Boeing spend the money it borrowed?” That question is best answered with a diagram:

Figure 1: Usage new borrowings Boeing
We often hear about Boeing having borrowed $12B (actual borrowings were $13B when the deal closed), but that’s merely Boeing’s new delayed draw term loan that it agreed on with a syndicate of banks. The actual amount borrowed is higher than $25B. Figure 1 shows one thing clearly: Nearly half, 48%, of the borrowed money is used to make debt repayments. Over $7B or 28% of the borrowed money has gone to shareholders in the form of dividend payments (18%) and share repurchases (10%), which were halted after the grounding of the Boeing 737 MAX. Smaller cash components were investing activities at $1.5B or 6% and customer compensations of $1.2B or 5%, the remainder of the borrowings has been used to bolster the cash pile and cover other cash items.
The notion that Boeing solely borrowed money to pay dividends is not accurate, since a big part of the money has gone to debt repayments. Nevertheless, out of all cash components listed, returning value to shareholders is the most useless one as it doesn’t bolster the company’s financials. The share repurchases were halted rather quickly, but Boeing has continued to pay $4.6B in dividends, and although I’m one of the beneficiaries of that decision it’s not one that I think is extremely prudent.
I wouldn’t say paying a dividend defies all logic as not paying dividends will further pressure share prices, but I don’t see how paying a dividend really fits a rational approach to the financial position of the company.
Cheap money and underfunded pension plan
The big question one could have is why Boeing is paying a dividend when it has to borrow the money. I think the answer partially lies in the fact that the money is cheap. We are in a low interest rate environment, so there’s nothing that really punishes borrowing money. You borrow money, you pay a tiny interest penalty, a cost a company such as Boeing is willing to make. If interest rates would be higher, Boeing would be less inclined to pay dividends with borrowed money. During the past five years, we could find only one year (2016) in which new borrowings did not exceed debt repayments. So, Boeing has an urge for accumulating debt and the low interest rate environment likely is one of the reasons why Boeing has that urge for debt.
As mentioned, Boeing’s decision to continue paying a dividend likely is because not paying a dividend would make share prices tumble even further. For Boeing executives who have part of their compensations in stock packages, that wouldn’t be good. If that was the sole reason, it would mean senior management doesn’t have its interests aligned with that of the company. The bigger issue here, however, is Boeing’s underfunded pension plan.
A couple of years ago, Boeing made what I marked as a risky move by funding its pension plan with $3.5B in shares. To taper the funding gap Boeing bet on higher share prices as the company sells those shares in later years. Share prices are still higher compared to the moment Boeing funded the pension plan with a stock package, so you could say Boeing’s approach has been successful, but the risk is clear. When Boeing has to preserve cash and possibly cut the dividend, share prices will tank, in which case the value of the pension plan shares declines. By funding the plan with shares, management found another reason, next to their own stock compensation packages, to boost Boeing’s profits and share prices, but it’s a risk. Because Boeing funded part of the gap that way, the company will be less inclined to cut dividends, even when paying a dividend does not make sense.
Conclusion
In my view paying a dividend hasn’t made financial sense for Boeing’s day-to-day operations. Boeing used part of the money it borrowed to repurchase shares and pay dividends, which to me seems like a consequence of the low interest rate environment in which there are extremely little monetary forces that would move a company to reduce its debt. In fact, in Boeing’s case, the low rate environment has been a driver of the way the company practices its business and participates in shareholder value appreciation. Now, if rates are low, I can’t say I do not understand that a company would borrow money, but the thought of borrowing money to make debt repayment and borrowing money to return value to shareholders just doesn’t sound healthy.
But even if Boeing would want to cut the dividend, the fact that it would put significant downward pressure on share prices would prevent them from doing so as it could require Boeing to make additional contributions to its underfunded pension plan.
The Aerospace Forum is the most subscribed-to service focusing on investments in the aerospace sphere, but we also share our holdings and trades outside of the aerospace industry. As a member, you will receive high-grade analysis to gain better understanding of the industry and make more rewarding investment decisions.
Disclosure: I am/we are long BA, EADSF. I wrote this article myself, and it expresses my own opinions. I am not receiving compensation for it (other than from Seeking Alpha). I have no business relationship with any company whose stock is mentioned in this article.
7 Facts About Markets in a Presidential Election Year
Fact One:
Past performance does not predict future results. That is, what happened in markets the last time a party was in the White House may not happen in the future.3
Fact Two:
Technology innovations, interest rates, and business profitability may have a greater influence on the market and the U.S. economy than presidential election results.4
Fact Three:
The S&P 500 has been positive in 16 out of 23 presidential election years since 1928.5
Fact Four:
Since 1952, the Dow has increased an average of 10.1% in election years with a sitting president running for reelection.6
Fact Five:
When it comes to the stock market and investing, it really doesn’t matter which party wins. Normal variations in market returns eclipse any minor differences from president to president.7
Fact Six:
Long-term investment success depends more on the strength of the U.S. economy than the party in the White House.8
Fact Seven:
The S&P 500 has an 86.4% success rate at predicting a White House win. Historically, if markets were down in the 3 months leading up to the election, the incumbent often lost.7
“In the end, stressing about the ‘what ifs’ of the election just isn’t productive. Whatever happens on November 3, 2020, life will go on.”
Financial Lesson: Don’t Let the Election Frenzy Derail a Good Investment Strategy
It’s no secret that presidential election years are uncertain times—and that investors and the stock market like certainty.
It’s also no secret that the stock market is influenced by several factors—and that a presidential election may not even be the most significant one.3
Of course, it can be easy to get caught up in campaigns, politics, and elections. And they do matter. Just not as much as you may think when it comes to investing.
Unfortunately, too many people let ideas about who could win office—and what they’ll do when they get there—run wild. And that can mean more stress and anxiety that overshadow sound investment choices and strategies.
https://seekingalpha.com/article/4324363-apple-may-underperform-market-in-2020s-why
Apple May Underperform The Market In The 2020s: Here’s Why
Feb. 14, 2020 4:43 PM ET
Summary
Apple’s recent meteoric rise has left many wondering if they should hop aboard as it rockets upwards.
I demonstrate what return you can expect from buying Apple at this price and why buying here will likely lead to underperformance of the SPY.
With services and wearables growing at healthy rates, Apple has once again restored investor confidence, as evidenced by their ~25x price to free cash flow, but that doesn’t mean buy.
Introduction
In today’s article, we will go through a sum of the parts valuation analysis of Apple (AAPL) based on two factors. The first factor is somewhat qualitative, in that, it’s a description of the ecosystem, or walled garden as some call it, upon which the second factor rests. The second factor relates to the growth of certain business segments within the ecosystem that have proven themselves capable of fueling Apple’s business growth for years to come.
With these two factors in mind, we will assess the growth prospects for Apple and determine whether the growth prospects warrant purchasing shares here.
The Walled Garden
The walled garden refers to the technological ecosystem in which one finds themselves once they have purchased two or more Apple products. It’s the idea that Apple has a substantial competitive advantage over their competition because one can own a smartphone, laptop, desktop, watch, speaker system, and TV, and they can all be seamlessly integrated with user friendly Apple software.
In the world of Android and Windows, such seamless integration does not exist because Alphabet (GOOG) (GOOGL) designs the Android operating system, Microsoft (MSFT) designs Windows OS, and, for example, Roku (ROKU) or Amazon (AMZN) designs smart TV operating systems. This leads to a fragmented user experience that cannot rival that of Apple’s. Hence, once one enters the Apple ecosystem, it is unlikely that they will exit, and as Apple introduces more products, i.e., their AirPods or Apple TV streaming service, those new products seamlessly and conveniently integrate into the ecosystem, building the wall ever higher.
Great! So What’s It All Worth?
While the walled garden is certainly something to celebrate for shareholders, parts of the walled garden have reached terminal growth, and it has become utterly imperative for Apple to focus on other aspects of the wall, lest competitors besiege their ecosystem and create an opening through which “eco-citizens” might leave.
Valuing Each Of Apple’s Individual Businesses
As a point of clarity, I will be using Apple’s most recent 10-K, instead of their most recent 10-Q to extract pertinent financial data. I will of course extract certain items such as updates to their capital return programs from their most recent 10-Q. If I were to use their most recent 10-Q for much of my modeling, the number of assumptions I would have to make would increase such that my model would become more unreliable in determining future returns. So let’s get started!
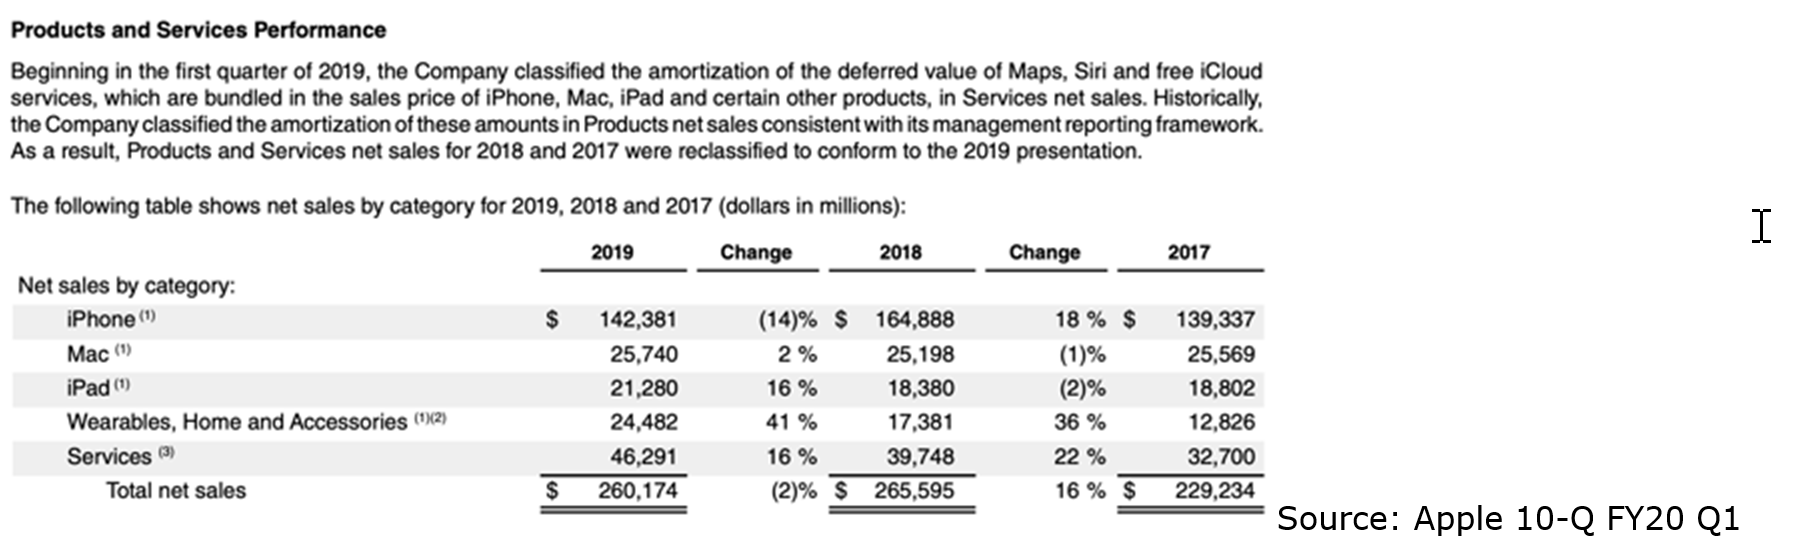
As can be seen in the above, “Wearables, Home and Accessories” grew at 41% yoy from 2018 to 2019. Additionally, Services grew at 16% yoy. These two growth rates are essential in forecasting the value of Apple, because the iPhone, Mac and iPad have essentially stopped growing entirely, as can be seen below.
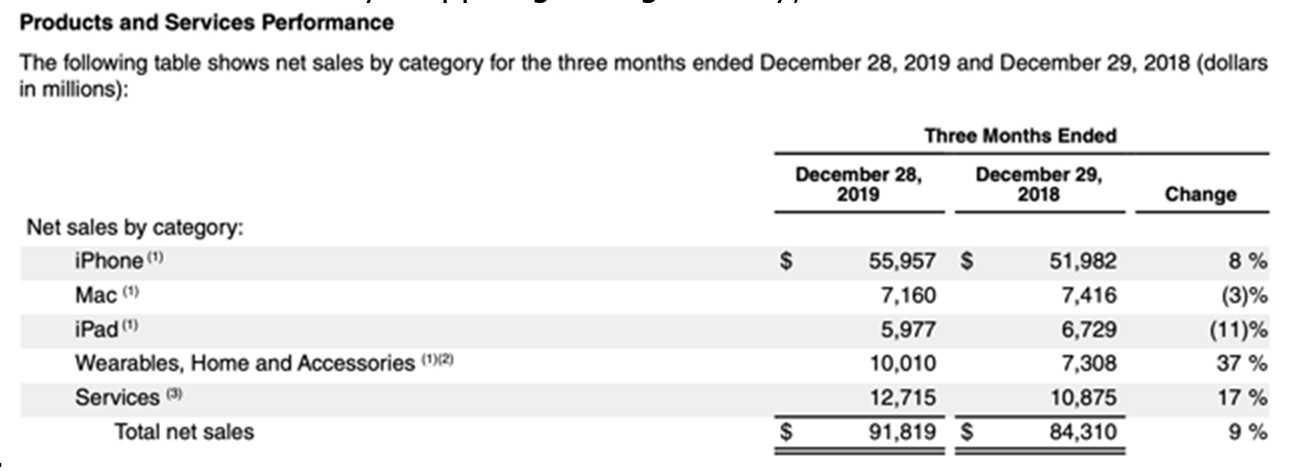
Source: Apple 10-K FY19
In Apple’s last quarter, “Wearables, Home and Accessories” grew at 37% yoy, with Services’ growth accelerating slightly to 17%.
With the above metrics, it’s rather easy to create a sum of parts valuation, whereby we can identify exactly what to expect in the way of future returns from our Apple holdings.
iPhone, Mac and iPad
For simplicity’s sake, I combined Apple’s iPhone, Mac and iPad segments into one low-growth, mature titan of free cash flow generation.
Assumptions: The following DCF model is predicated on a few assumptions regarding the margins of these businesses and the resulting free cash flow they should produce.
1) Gross Margins for the segment (iPhone, Mac, and iPad) as a whole rest at 32% throughout the 10 year period of the following DCF model, and operating expenses rest at 13% throughout the same period of time.
2) Free cash flow to shareholders is assumed to be about 80% of the above operating margin when we account for deductions resulting from an effective tax rate around 20% and interest expense.
3) For modeling purposes and in light of the recent stagnation in revenues, we assume 1% annualized growth for the entire segment, and 0% thereafter for a 100 year period of time.
iPhone, Mac and iPad Valuation
| Assumptions | Values |
| FCF To Equity Growth Rate (10yr) | 1% |
| Terminal Growth Rate | 0% |
| Discount Rate (90yr Annualized Return S&P 500) | 9.8% |
| Initial Free Cash Flow To Equity Per Share (2019) | $9.07 |
| Fair Value | $99.08 |
Source: Data Extracted From 10-K, Calculations Done By Myself
If you’re a reader of mine, you know that in all of my DCF models I incorporate the rate at which the company will likely repurchase shares. The repurchase and retirement of shares results in higher free cash flow per share, e.g., $10 distributed over 9 shares is more valuable than $10 distributed over 10 shares.
iPhone, Mac and iPad with share repurchase program:
| Assumptions | Values |
| FCF To Equity Growth Rate (10yr) | 1% |
| Terminal Growth Rate | 0% |
| Discount Rate (90yr Annualized Return S&P 500) | 9.8% |
| Initial Free Cash Flow To Equity Per Share (2019) | $9.07 |
| Fair Value | $99.08 |
| Fair Value (Including Effects of 14.5% Share Reduction) | $110.61 |
Source: Data Extracted From 10-K, Calculations Done By Myself
As the above model demonstrates, a reduction of 14.5% in shares outstanding over a 10 year period would result in a CAGR of 2.6% instead of just 1%, leading to a fair value of $110.61.
Wearable, Home, and Accessories
This is where the fun starts.
Assumptions:
1) Firstly, the model assumes an average of 20% top and bottom line growth for the next ten years. Considering Wearables, Home and Accessories are growing at a steady 35-40% presently, this may certainly prove to be a conservative estimate.
2) Gross margins for the segment as a whole rest at 32% throughout the 10 year period of the following DCF model, and operating expenses rest at 13%. This is the same as the iPhone, Mac and iPad segment because Apple combines both of these into one “products” segment, for which they give a total gross margin. This may lead to some distortion in results due to the chance that newer products will have higher operating margins, and therefore generate more FCF.
3) Free cash flow to shareholders is assumed to be about 80% of this operating margin when we account for deductions resulting from an effective tax rate around 20% and interest expense.
| Assumptions | Values |
| FCF To Equity Growth Rate (10yr) | 20% |
| Terminal Growth Rate | 1% |
| Discount Rate (90yr Annualized Return S&P 500) | 9.8% |
| Initial Free Cash Flow To Equity Per Share (2019) | $1.17 |
| Fair Value | $59.06 |
Source: Data Extracted From 10-K, Calculations Done By Myself
With share repurchase program:
| Assumptions | Values |
| FCF To Equity Growth Rate (10yr) | 20% |
| Terminal Growth Rate | 1% |
| Discount Rate (90yr Annualized Return S&P 500) | 9.8% |
| Initial Free Cash Flow To Equity Per Share (2019) | $1.17 |
| Fair Value | $59.06 |
| Fair Value (Including Effects of 14.5%) | $67.59 |
Source: Data Extracted From 10-K, Calculations Done By Myself
Services
Lastly, I will model 10% growth for the next 10 years in services.
| Assumptions | Values |
| FCF To Equity Growth Rate (10yr) | 12.5% |
| Terminal Growth Rate | 1% |
| Discount Rate (90yr Annualized Return S&P 500) | 9.8% |
| Initial Free Cash Flow To Equity Per Share (2019) | $4.41 |
| Fair Value | $120.06 |
Source: Data Extracted From 10-K, Calculations Done By Myself
With share repurchase program:
| Assumptions | Values |
| FCF To Equity Growth Rate (10yr) | 12.5% |
| Terminal Growth Rate | 1% |
| Discount Rate (90yr Annualized Return S&P 500) | 9.8% |
| Initial Free Cash Flow To Equity Per Share (2019) | $4.41 |
| Fair Value | $115.02 |
| Fair Value (Including Effects of 14.5% Share Reduction) | $130.77 |
Source: Data Extracted From 10-K, Calculations Done By Myself
Projected share buybacks resulted in a CAGR in FCF to equity per share of 14.28%, instead of the initially assumed 12.5%.
To sum up the DCF present value, and to identify in the near term how shares will trade, let’s add up the values of the individual businesses:
We arrive at a present value of $308.97. Will it trade to $400 in the near term? Potentially, but as you will see later in the article, much of Apple’s future growth has been priced in at $320.
Capital Return Programs
Share Repurchase Program
Apple continues to aggressively repurchase shares as they execute their leveraged recapitalization, whereby they eventually will become cash neutral, which means the cash on their balance sheet will equal their total long-term debt.
Source: YCharts
In April of 2019, Apple increased their $100B share repurchase program to $175B, of which $116.1B had been used at the end of calendar year 2019.
This means that Apple will likely execute another $58.9B worth of share repurchases during fiscal year 2020. This is likely because Apple’s financial team is probably employing a DCF model nearly identical in nature to mine, which is further demonstrating to them that their shares are fairly valued at worst, and potentially undervalued.
Dividend
For myself and my team at L.A. Stevens Investments, we view share repurchase programs more often than not as the most ideal method by which to return capital to shareholders. It enables investors to maximize tax efficiency by strategically liquidating their holdings during a period in their lives when it would be wisest, from a tax perspective, to do so.
Therefore, we see Apple’s conservative dividend policy juxtaposed by their aggressive share repurchase program as very positive. With that being said, dividend policy cannot be ignored in creating a company’s valuation.
Source: YCharts
In the next section, I will tie together all of the components of this valuation and include a valuation based on DRIPing Apple in, for example, a Roth IRA.
Tying It All Together: Price Targets & Expected Returns
Below you will find what is normally the third step in my valuation model. Refer to some other far shorter articles of mine, in which I clearly employ the three step model, for further clarification.
The third step always involves normalizing the share price for the reality that after 10 years, they will have a P/FCF multiple, by which their share price will be defined. Below you can see that normalization:
| Free Cash Flow Per Share | Assumed P/FCF Multiple | Share Price |
| $16.75 (Services) | 15x | $251.25 |
| $8.47 (W, H & A) | 20x | $169.40 |
| $11.72 (iPhone, Mac & iPad) | 10x | $117.20 |
Source: Data Extracted From 10-K, Calculations Done By Myself
Adding the three business share prices together, we arrive at a price target of $537.85 by 2030, which implies a CAGR of only 5.33% for the next 10 years based solely on share price appreciation.
I want to point out that the largest influencing factor on this estimate is my assumption that Wearables, Home and Accessories would grow at an average rate of 20% annualized for 10 years. For the past few years, it has grown at 35%-40% annualized, so 20% may be slightly too pessimistic. A sustained 30% growth rate would indeed materially alter the final share price, though such an assumption would be rather reckless, as 10 years of sustained 30% growth would be challenging for the mature titan that is Apple.
So in light of these rather conservative estimates (feel free to tell me if or how you disagree), Apple has share price appreciation ahead; however, the share price alone may not be able to rationally beat the market over the next decade.
But before we write off Apple as a market under-performer, let’s look at what returns would be for a person DRIPing Apple in a tax exempt retirement account.
Here’s your expected return DRIPing from $320 (current share price) in a tax exempt retirement account:
Source: www.hughcalc.org
At a 2030 share price of $603.07, you would achieve a CAGR of 6.55%. If you’re in a taxable account, it’s even worse.
Concluding Thoughts
We purchased a great deal of Apple at around $180, and we hope to achieve a stable 11.6% CAGR from the investment through DRIPing; however, at today’s price, we would not recommend putting capital to work in the stock.
Will Apple reach $400? Yes, of course, but that doesn’t mean it’s going to outperform the market over the coming 10 years from a starting point of $320.
As always, I’m very grateful for your readership, and happy investing!
Disclosure: I am/we are long AAPL. I wrote this article myself, and it expresses my own opinions. I am not receiving compensation for it (other than from Seeking Alpha). I have no business relationship with any company whose stock is mentioned in this article.
https://seekingalpha.com/article/4324250-facebook-this-cash-machine-keeps-on-spitting-out-money
Facebook – This Cash Machine Keeps On Spitting Out Money
Feb. 14, 2020 9:56 AM ET
Summary
Facebook’s cash (and cash equivalents) balance keeps on increasing, exceeding the $50Bn mark (~$55Bn at year end 2020).
This is fuelled by strong annual operating cash flow, which has now surpassed the $35Bn mark (FY 2019: ~$36Bn).
Unless Facebook goes on a massive spending spree acquiring other companies and/or goes all out on buybacks, the cash balance will keep on increasing. It is inevitable, all else constant.
The current cash balance is just under 10% of market cap and Facebook has virtually zero long-term debt. The balance sheet is set to get stronger and stronger over time.
Assuming a static world (i.e. Facebook does nothing and just maintains the existing level of operations), cash will keep on piling up at a rapid pace, potentially exceeding 50% of the current market cap over the next decade. But that’s not realistic. Facebook will grow.
My previous article on Facebook (FB) was published in September 2019, entitled “Cash-Rich Facebook Will Get Cash Richer” (price at publication $188.49). Since then, total return has been ~13%.
Source: Seeking Alpha
The title of my previous article is important. The cash pile is a key element of my FB thesis, just like with my thesis in Microsoft (MSFT) in 2011/2012. Simply put, FB’s current valuation is compelling relative to its large cash hoard and future cash flow generation potential, which will further boost its cash balance, all else constant. In fact, assuming a static world (i.e. operating cash flow after maintenance CAPEX is simply accumulated on the balance sheet), the cash balance could well exceed 50% of FB’s existing market cap. FB could be a trillion-dollar market cap company much sooner than many realize, joining the ranks of MSFT, Alphabet (GOOG) and Amazon (AMZN).
I understand that this ‘black box’ approach sounds quite basic, but it doesn’t require much more. However, the reality is that we do not live in a static world. I strongly believe that FB’s operating cash flow will continue to grow over time, and it will be much higher ten years from now. It is inevitable unless Instagram, Facebook.com, WhatsApp, new projects that FB starts, or any company that it acquires will turn out of fashion and/or be a complete disaster. I don’t see any indications this is going to be the case. For example, both daily and monthly active users remain strong:
Source: Q4 2019 Results Presentation
WhatsApp reached 2Bn users, up from 1.5Bn revealed two years ago.
Source: Seeking Alpha
For those who are not familiar with my strict investment criteria, I believe the following model is a recipe for success.
Stable and growing cash from operations is sufficient to cover all of the following corporate priorities:
- returning capital to shareholders in the form of buybacks and/or dividends (FB recently added $10Bnto its buyback authorization, an incremental increase from the the previously authorized program up to $24Bn)
- maintenance CAPEX in order to sustain the existing level of operations – i.e. to sustain current revenues and profitability
- growth CAPEX – innovation, investing in and acquiring other companies (M&A)
- balance sheet improvements such as increasing the cash balance (total cash and short-term investments), paying down debt (if any), etc
I am confident that overtime FB will acquire more companies, start more projects (like the similar app to Pinterest), its existing platforms will continue to remain popular and monetization initiatives will bring in more revenue (including more from non-advertisement sources). In other words, I am confident that cash from operations will keep on growing, and this will be translated into an ever increasing cash balance, all else constant. This is depicted in the following graph.
FB’s cash and cash equivalents and marketable securities:
Source: Seeking Alpha
Total cash and cash equivalents (including marketable securities) has surpassed the $50Bn mark (~$55Bn), comfortably outweighing all liabilities.
This situation will keep on getting better and better, fuelled by rising cash flow from operations.
FB’s cash from operations:
Source: Seeking Alpha
For FY 2019, net cash provided by operating activities surpassed the $35Bn mark (~$36Bn). Thinking about the long term, if this annual run rate is sustained (in reality it will most probably improve), on a post-maintenance CAPEX basis, FB can comfortably accumulate more than $25Bn per annum. All else constant, this will go straight to its cash balance. In other words, FB will accumulate more than $250Bn in cash over the next decade, on top of its existing $55Bn, all else constant. So that’s more than $300Bn in pro-forma cash (versus a current market cap of ~$600Bn).
Again, this scenario assumes that FB will not grow, not innovate, not acquire other companies, not repurchase shares. In other words, it will simply accumulate operating cash flow, net of maintenance capex. However, in reality, FB will most likely keep on growing both organically and via M&A. As such, revenues and operating cash flow is set to grow over time. Also, as cash flow grows, growth CAPEX is likely to increase, which in turn will create a nice compounding effect. This, coupled with continued share repurchases, will boost per share metrics at a rapid pace. Overall, I feel FB remains quite cheap and will very likely join the $1 trillion market cap club, much sooner than many expect.
Disclosure: I am/we are long FB. I wrote this article myself, and it expresses my own opinions. I am not receiving compensation for it (other than from Seeking Alpha). I have no business relationship with any company whose stock is mentioned in this article.
Disney’s Q1: Streaming, The Theatrical Window, And Long-Term Thinking
Feb. 12, 2020 3:19 PM ET
Summary
The stock is a long-term buy, but short term may see some price swings based on valuation, the novel virus and streaming investments.
Cash flow and earnings are down in part as a result of streaming activities.
The company does sport a risk in terms of selling more content to its own ecosystem.
The company should explore shortening the theatrical window as a best-practice method of promoting streaming.
Disney isn’t exactly cheap, but buying on weakness should win out.
Disney (DIS) reported earnings for the fiscal first quarter. The stock is still a long-term buy after the results, but it will clearly most likely meander as new data on the suite of streaming services come into view. In addition, the effects of investing in the services, as well as theme-park reaction to the current novel virus, will influence the price action.
The results show that the company continues to successfully produce and distribute content for multiple platforms, and that it has a powerhouse theme-park/merchandising operation. The stock will seem expensive by some metrics, but if this is something you can buy and hold, it should work out as the years go by.
Prefatory Matters
Before we get into the quarter proper, I’d like to point out the stat that leapt out at me. It’s one that highlights a risk to the streaming story.
The table in the press release dedicated to segment operating income lists a rather significant jump in intercompany eliminations. Last year, the number on the top-line side was $184 million; this year, over $1.6 billion. On the income side, eliminations came to $220 million versus basically zero.
This tells us that the company is selling a lot of its content to itself. Besides risking sweetheart-deal litigation (which Disney is working to control), the practice is representative of an opportunity cost as it concerns generating revenue to third-party platforms. If Disney invests solely in exclusivity, that means it won’t sell as much to competing cable channels, as an example, or even to other streaming entities. If subscriber counts for D+ and Hulu work out, then it won’t be a problem; if they falter as time goes on, or if talent wants a bigger percentage of the cash flow created by the services, or if the company can’t exert pricing power, then missed revenue opportunities outside of the D+/Hulu ecosystem will negatively influence the business. It’s something to keep in mind.
The First Fiscal Quarter
The company made an adjusted and diluted $1.53 per share, a beat of nine pennies against expectations but a decrease of 17% from the previous year’s performance of $1.84. So a little bit of half-empty/half-full there.
Cash from operations was down over 20% to $1.6 billion. More sadly, free cash flow was down just under 70% to roughly $290 million. That is a low free-cash number for Disney, to be sure.
The studio division was a standout performer, as one would expect from recent hit films and the addition of Twentieth Century Fox. However, on the latter asset, I should note that it probably will be several quarters before Disney fully overlays its strategies for the Fox product on the newly-acquired studio. I expect that management will enact a brand-focused approach that will replicate the Disney method of reducing film investment in favor of making sequels/prequels in a shared cinematic universe. For the quarter, revenue for the studio doubled to $3.8 billion; income likewise jumped 100% to roughly $950 million.
Media networks had top-line sales of $7.4 billion and income of $1.6 billion, both representative of better than 20% gains (again, think Fox addition in part). In fact, the consolidation effect helped to mitigate some weakness in Disney’s businesses sourced in part to the transition of the streaming suite. ESPN had lower ad sales and higher programming costs, and ABC Studios was affected by higher costs and lower content sales. Broadcasting was also hit by ad weakness. (Interestingly, the A&E partnership with Hearst delivered higher investee income – $193 million versus $179 million – because of a better advertising environment on that channel set, as well as lower content expense.)
As for the direct-to-consumer streaming segment, obviously the top line grew dramatically while the bottom line fell apart. Roughly $4 billion in sales was booked against $900 million in the previous year’s similar frame. The loss widened to a little under $700 million against a little under $140 million. No surprise there because the company is heavily marketing the services, both individually and as a bundle product, to consumers. Investment in the platforms means breakeven is a few years away.
Parks and consumer products increased sales by 8% and segment income by 9% to $7.4 billion and $2.3 billion, respectively. Recent movie hits helped to power merchandise sales and park engagement, but sadly, legacy characters such as Minnie Mouse hindered results a bit. Higher guest spending and pricing power also contributed. New attractions based on Star Wars certainly were driving factors.
No one is really focusing on current parks data…the big worry now is with the coronavirus and what effect that will have on Disney’s stakes in foreign parks. Domestic parks, too, could be affected as travel plans will be disrupted; also, we don’t know how efficiently the novel particles will spread on a global basis. The best anyone can say right now is that the event will eventually decelerate and that Disney’s theme-park division will survive well into the future based on its brand equity and iconic status. Come to think of it, that’s saying a lot, and shareholders shouldn’t worry about the long-term effects; shorter term, yes, there will probably be a few quarters of weakness in the division (at least, it should be assumed for the sake of being conservative).
Thoughts On The Quarter
Streaming is off to a big start. D+ has 26.5 million subscribers, E+ has 6.6 million, and Hulu has over 30 million, about ten percent of the latter being live subscribers as well. Honestly, though, I thought E+ would have more subscribers at this point, given the popularity of sports. Still, E+ has grown its base by multiple times over the last year.
The notes to the data table in this section are key to the overall context. Keep in mind that a subscription bundle counts as a customer in each service. It would be more informative if the number of multiple-service subscribers was included (might be too informative for competitors, I suppose), but we’ll have to be happy with the data we got. Average revenue per subscriber on a monthly basis for D+ was $5.56, and as time goes by the hope is that either increases or more bundles are sold; right now, it’s hard to interpret, given the Verizon deal that allowed for complimentary sign-ups. E+ saw its average dip 5% to $4.44 (the note on this says per-per-view revenue isn’t included in the tally, but there’s still a factor of disappointment with the stat). Hulu’s average dropped a larger 9% to $13.15 for the non-live product, while the version with the live product increased 14% to $59.47. Another note: ad sales are included in the Hulu section, and that includes ads seen during trial periods.
One of the bigger questions around D+ that many are asking, even in the comment section on SA, is how many consumers from the Verizon setup will stick with the service? It’s a legitimate inquiry, and we won’t know the answer for a while, but I have to believe that the subscriber count goes up from here. One way for the subscriber count to continue going up, from my perspective, has to do with a subject mentioned in the conference call. It was the last question, in fact. And it is a topic with which CEO Robert Iger and I disagree.
Day-and-date…the Holy Grail of movie distribution. It could be an epic movie all its own: the fight between content producers and multiplex moguls over the coveted theatrical window. One side would love to break it (or at least have the option of breaking it) while the other side wants the window to stand for as long as possible.
I get why companies like AMC Entertainment Holdings (AMC) want to keep the window shut, but only up to a point. And I get why Disney feels the window has been working. The inexorability of Iger’s position feels illogical to me nonetheless, for there has to be flexibility and/or compromise for every project as this proposed method of distribution is concerned – i.e., it would be appropriate for some, maybe not appropriate for others, and it might be needed for some others.
If one looks at data from Box Office Mojo for the latest Star Wars feature, one should be able to discern the point. On the twelfth day of release, the film had a domestic cumulative take of $390 million. On the thirty-seventh day of release, the film had a take of $500 million. By day fifty-two, the feature banked $510 million. A similar point is made with data for the Frozen sequel.
The conclusion would seem to be obvious: once a blockbuster starts to slow down, maximizing the gross ticket sales might not be as important as shifting to a streaming window. That window might precede the release on physical, or it could be simultaneous. There’s also no reason why Disney would need to take any film out of theaters before multiplex operators wanted it to, so long as Disney has the option of getting it on the service when it so desires – whatever amounts could be captured by those still wanting to take in the theatrical experience would benefit both the studio and the exhibitor. Talent obviously has deals in place to keep projects on silver screens depending on specific contracts, so that is as complicating a factor as is the obstinance of theater managers. It’s a very complex negotiation that needs to be entered into by the next CEO of the Mouse (and on that point, Iger and the board need to start making some update announcements). At the very least, a near day-and-date (maybe within a month) or a sixty-day window should be considered.
Even without a smaller window, D+ and Hulu should prosper. Hulu will benefit from the close link to the FX cable channel, and D+ has a lot of content from the Fox acquisition that can power memberships, such as The Simpsons and National Geographic programming. The D+ service is also going to drive the Hotstar asset in India once that is rebranded as D+ – Hotstar.
This quarter was, as many future quarters will be, dependent on the streaming story. As such, shareholders will have to put up with big fluctuations in cash flow and earnings. My hope is that the streaming division doesn’t stop Disney from remaining a strong participant in selling stuff to other platforms. The key might be in providing edited versions of content to competitors. While exclusivity is the name of the game currently, I could see something like the first season of the D+ bounty-hunter series ported to physical disc, or syndicated to station groups, as it ages. Doing so might essentially act as a commercial for Disney and its bundle.
Conclusion/Valuation
Disney has retreated a bit from its 52-week high of $153 (at time of writing, the quote was $142.50). Here is a chart of the price action over the last twelve months:
Data by YCharts
I would expect that the stock will come under pressure from a few issues going into the year. First, the coronavirus will impact foreign parks in which Disney holds stakes and it may impact domestic parks/cruise ships. Second, Disney may not have as big a box-office year as 2019; wait, did I just write may not? Change that to won’t. Last year was very impressive, and while I expect some blockbuster surprises, I doubt 2020 will perform in a similar manner to 2019 without the aid of a Wars picture or a Frozen sequel. Third, I expect news flow on the streaming bundle to ebb and flow in terms of positive/negative headlines; couple that with cash-flow concerns, and you’ve got a potential situation where short-term traders will take control of the price action. From a forward-P/E perspective, the shares have a low rating from SA’s quote system: at over 25 (currently), the stock is not favorably compared to the sector median.
Long-term thinkers willing to bet on streaming may find opportunities to add to existing positions over the next several months. I continue to view the stock as a buy even within the context of the streaming-war risk.
Disclosure: I am/we are long DIS. I wrote this article myself, and it expresses my own opinions. I am not receiving compensation for it (other than from Seeking Alpha). I have no business relationship with any company whose stock is mentioned in this article.
HI Financial Services Mid-Week 06-24-2014