
HI Market View Commentary 01-31-2022
Without commitment you will never start, without consistency you will never finish !!!!
Helping you education wise understand terminology, returns and our process here at HI
Where we are at once again I like that we were making more on the way down than the stocks were losing and that we are ALSO making more on the way up than stocks are gaining
What is our process here at HI?
Collar trading, protective puts
Make money on the way down to have a better return on the way back up
Dollar cost average buy more stock with the money made on puts
Hell no you can’t tell the market to do anything
What do you do if a position loses 50-70% of its value?
You do have the option of getting out of dodge = taking the loss
Dollar cost average = putting more money to bad
@ HI we use the profits from Protective Puts to add shares for a higher % return when the stocks come back
This is how if you look at the 2020 Hurley Investments You Tube returns video you see how we made a killing
Big drops down and recovery back to highs is the process
We sold puts on AAPL today for a slight profit and a slight loss
We sold FB puts for a nice profit and rolled down to $315
We need to sell protection off BAC and have plenty of profits to add 100, 200, or 300 shares to accounts as profits allow
Number of puts or the longer you collar/protective put shares of stock, the more shares you gain and the more shares you have allows for a higher % of shares added to your account
F over a 4 year period of time 1000 became 3000-4400 that was from adding long puts and adding share
The initial investment of $12,800 ish = 4400*20.30= 89,320
Profit = 89320-14000= 75320
75,320/14,000= 5.38 or 538% return over 4 years and 2 months? = 134.50% per year
https://www.briefing.com/the-big-picture
The Big Picture
Last Updated: 28-Jan-22 14:49 ET
For story stock holders, the worst is yet to come
With apologies to Willie Nelson and Julio Iglesias, this note isn’t going out to all the girls I’ve loved before. With apologies to my wife, who is the woman I have loved for 22 years, it’s not going out to her either. No, this note goes out to all the ones I’ve never met before but who have now met the reality of a stock bubble popping.
I’ve been there before. It was 1997 when I started at Briefing.com and things were just getting warmed up in the dotcom universe. They were white hot, though, by early 2000 and then… well, as they say, the rest is history.
The dotcom bubble burst in March 2000, but that wasn’t the worst of it.
The worst was still to come, and I’m afraid the same is going to hold true for this new generation of stock bubble participants. They probably think they see investment opportunity now with individual stock prices down 50%, 60%, 70% or more from their purchase levels, but they risk getting blinded by the opportunity cost.
A Whole Lot of Time
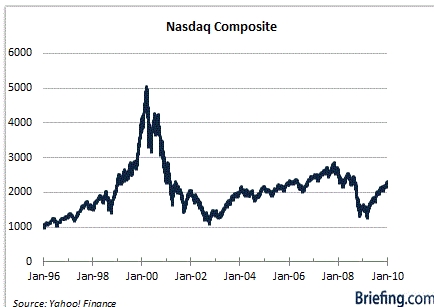
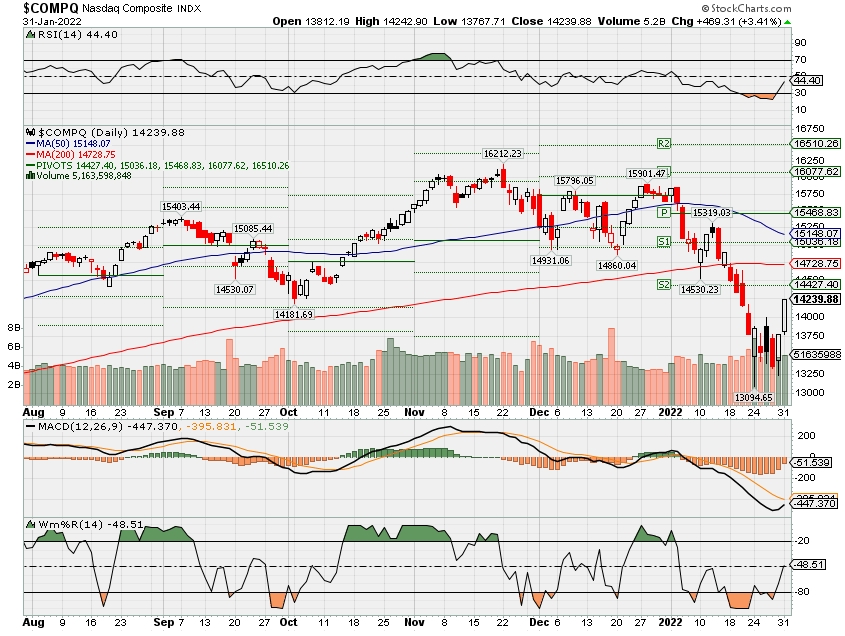
I present Exhibit “A.” It’s a long-term chart of the Nasdaq Composite.
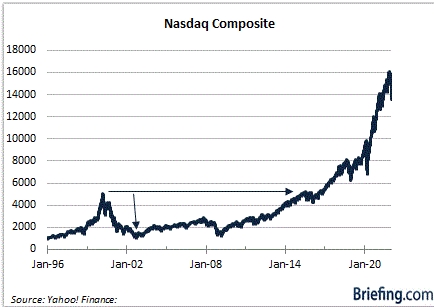
The Nasdaq Composite peaked in March 2000. It didn’t bottom until October 2002. It was a process.
Time eventually healed all bubble-popping wounds at the index level, but it took a whole lot of time. In fact, the high seen in March 2000 wasn’t seen again until April 2015. There was a housing bubble in between that also popped and precipitated the worst financial crisis since the Great Depression.
I realize everyone didn’t buy at the top in March 2000, but it’s fair to say that retail participants got more engaged with the dotcom mania in 1997 and got fully engaged with it in 1999 after dealing with a few nettlesome developments in between known as the Asian currency crisis (1997) and Russia’s debt default (1998). Bygones.
There were so many great story stocks to own in the late-1990s predicated on a great investment theme. The sky was the limit for a dotcom company, and earnings didn’t matter. It was about sales, clicks, and market share gains that would ultimately lead to huge earnings down the road.
Amazon.com (AMZN), unquestionably, has been the proof of that thesis, but so many other companies never lived up to those fanciful expectations. They either went out of business, got acquired at drastically reduced prices by larger companies looking for add-on acquisitions, or just labored in the ashes of the dotcom fire that burned for many years.
Forewarned
This is a warning to anyone who bought profitless story stocks last year, keying on investment themes like space travel, electric vehicles, green energy, SPACs, the metaverse, crypto, and the like.
Stocks that might have run from the single digits to the high double digits — or even triple digits — on a rush of liquidity and gamesmanship. Stocks that traded at 40x, 50x, 60x sales or more. Stocks whose gains were predicated on the good fortunes of established companies putting up good results.
These are the stocks that aren’t going to see their prior highs for a long, long time — if they ever do. Here’s why:
- The Fed’s pivot to a hawkish mindset is going to create pressure for the broader market, which is going to be favoring companies at this point with stronger investment attributes (i.e., profitability, free cash flow, dividends, solid balance sheet, dependable earnings prospects).
- Your fellow shareholders, who wish now they had sold earlier, will look at interim rally efforts as a gift/opening to cut their exposure or exit the position altogether.
- The shock and awe of the sell-off in many of these story stocks has made it clear to a new crop of market participants that valuations always matter in the end– and even more so in a rising interest rate environment.
- The speculative fever has been broken. There will be speculative activity — there always is — but it won’t be like it was for a long time. Too many people have been burned by it.
- Other pursuits will appeal more to novice day traders who have lost money, making the pool of liquidity driving these stocks a lot shallower.
- Macro “things” are bound to happen that adversely impact market sentiment, and when they do, there will be a flight to quality.
- Quarterly earnings reports are going to be regular reminders of just how far most story stocks have to go to live up to the outlandish valuations they were previously accorded.
What It All Means
The ugly truth of the matter is that most of these story stocks are going to languish as trading vehicles for an extended period. Sure, there will be pundits out there singing their investment appeal, but if you don’t have a lot of capital, you are apt to incur a large opportunity cost with a buy-and-hold approach.
That is, you risk sitting on dead investment capital for a long time, missing the opportunity of investing in profitable companies that pay a dividend.
Some of the story stocks may live up to their promise — and good for them and those pundits who stick by their investment thesis. They are apt to generate some big returns. Most story stocks, though, probably won’t, just like most young athletes won’t ever make it to the professional level.
It’s important to disabuse yourself of the notion that this is only a temporary setback. It isn’t. The dotcom experience indicates as much.
And speaking from that experience, the worst is waiting for something that isn’t coming — or at least not coming anytime soon. Do yourself a favor and avoid the opportunity cost.
—Patrick J. O’Hare, Briefing.com
Where will our markets end this week?
Higher
DJIA – Bearish
SPX – Bearish
COMP – Bearish
Where Will the SPX end February 2022?
01-31-2022 -3.0%
Earnings:
Mon: CBT
Tues: XOM, PHM, SIRI, UPS, AMD, GOOG, CB, EA, GM, GILD, PYPL, SBUX
Wed: BSX, DHI, JCI, WM, ALL, QCOM, TMUS
Thur: CAH, CI, COP, CMI, LLY, EL, HON, MRK, NOK, RL, ATVI, CLX, SKWS, SNAP, WYNN, F, BABA
Fri: BMY, RCL
Econ Reports:
Mon: Chicago PMI, China NEW YEAR week start
Tues: ISM Manufacturing, Construction Spending, JOLTS
Wed: MBA, ADP Employment
Thur: Initial Claims, Continuing Claims, Productivity, Unit Labor Costs, Factory Orders, ISM Services
Fri: Average Workweek, Non-Farm Payroll, Private Payrolls, Hourly Earnings, Unemployment Rate
How am I looking to trade?
Long put protection has been added to certain stocks
www.myhurleyinvestment.com = Blogsite
customerservice@hurleyinvestments.com = Email
Questions???
How is the transfers coming – Laggards 10% of my business that needs to come over 3.5 million
Will we be using SCHAW or the Street Smart Edge = YES as soon as my accounts come over
YES KEVE AND I have the same positions you guys are in
Isn’t the interest rate hike already baked in – Howard …..YES but people still lose their sh$!
‘You have no home here’ — Cramer blasts speculative SPACs for taking down the stock market
PUBLISHED WED, JAN 26 202210:55 AM ESTUPDATED WED, JAN 26 202212:13 PM EST
KEY POINTS
- CNBC’s Jim Cramer on Wednesday condemned the 2021 rush of speculative SPACs for playing a part in the stock market’s recent weakness.
- “There’s no more Jimmy Chill when it comes to SPACs,” the “Mad Money” host said.
- Cramer on Wednesday also lambasted what he calls robot-generated headlines, telling investors to pause and digest the news before acting.
CNBC’s Jim Cramer on Wednesday condemned the 2021 rush of speculative SPACs for playing a part in the stock market’s recent weakness.
On “Squawk Box,” Cramer issued a challenge to any SPAC enthusiast who might want to face off with him.
“There’s no more ‘Jimmy Chill’ when it comes to SPACs,” he said. “You come on our show and you come out with that nonsense … you have no home here, where I am.”
Cramer was doubling down on comments he made the prior evening on “Mad Money,” when he blasted last year’s flood of special purpose acquisition company deals as well as initial public offerings.
“These newly minted stocks and SPACs are now killing us. It’s the excess supply that’s dragging down the rest of the market,” Cramer said Tuesday evening. “Broken IPOs have emptied the pockets of investors.”
Cramer further elaborated before Wednesday’s opening bell on Wall Street. “I have a really great plumber. I’ve used him for 25 years. If he thinks I’m going to give him a blank check, forget about it.”
SPACs are also known as blank-check companies because their sole purpose is to merge with a private company that wants to become publicly traded. The IPO process, which is a more traditional route to the public markets, tends to be more rigorous.
Cramer on Wednesday also lambasted what he calls robot-generated headlines, telling investors to pause and digest the news before acting. “I just find it revolting that people are doing these headlines,” he said. “Can people just take a breath, listen to the conference call and make a decision before they blow it out?”
Cramer cited the initial drop in Microsoft shares in after-hours trading Tuesday after strong earnings. The stock later soared after the tech giant issued rosy forward guidance.
— Sign up now for the CNBC Investing Club to follow Jim Cramer’s every move in the market.
This ARK holding and pandemic star is down 77% from its peak — why one hedge fund is starting to buy it
| By Barbara Kollmeyer |
| Critical information for the U.S. trading day Getty Images We’re about to slam the door on one of the worst annual starts for the S&P 500 since the 2008-09 financial crisis, with the S&P 500 down 7% for January. No doubt, some investors may be having second thoughts about whether they should be in markets at all. But Goldman Sachs has been rallying the dip buyers. See the chart below. While most investors at least have a stellar 2021 to fall back on, hedge funds have had it tougher. Some data point to an 8.7% gain for hedgies between January and November 2021, versus 26% for the S&P last year. Still, those funds get paid to take the big chances and win at times. Our call of the day comes from Scott Miller, who manages Greenhaven Road Capital, which returned 3% last year, and lost 9% in the fourth quarter. The small annual gain was due to the fund’s focus on smaller companies and no S&P 500 (SPX) names. The negative return came from a “bias toward companies with long runways for growth that will not require additional cash to reach their potential,” he told clients in a January letter. Despite recent heat, those stocks can be worth the trouble, he argued. “If a company can sustain 30% growth over a five-year period with a steady multiple, we nearly triple our money. If the multiple expands…even better. But even if the multiple were cut in half on day one, the investment would still deliver an 85% return over those five years,” he said. With that, he makes the case for a couple of new investments, including COVID-19 star Teladoc Health (TDOC), whose 50% drop in 2021 and another 23% this year has hit Cathie Wood’s flagship ARK Innovation ETF(ARKK) hard. He said the virtual-health company and the other pick, Israeli digital-intelligence group Cellebrite (CLBT), “have the competitive benefits of being a scaled provider.” Teladoc is cheap for starters, selling for less than 5 times revenue (from 20 times). It still expects 25% to 30% annual growth for the next three years, and preannounced revenues and reaffirming projections earlier this year, meaning confidence isn’t waning. Further, he said Teladoc’s growth path is focused on selling more products to existing customers, and it has evolved into a comprehensive medical service, with a broad geographic footprint, making it an attractive option for health plans or companies. “If Teladoc can achieve their stated growth ambitions, it will be a result of cross-selling, which has been successful for them historically. For example, more than 40% of telehealth users today have accessed multiple products, compared with just 10% in 2017. If every Teladoc patient used every product, revenue would grow more than 25X without adding a single new customer,” he said. As for Cellebrite, a recent special-purpose acquisition company/carve-out from Japan’s Sun Corp., Miller said the company “checks a lot of boxes”: over 5,000 public safety and 1,700 enterprise customers; revenue growth of 25% and net revenue retention of over 140%; solutions with a large return-on investment for end customers; 80% gross margins and an estimated 20% penetration of their current base. “Shares are currently trading for less than 5X 2022 revenues, which is a >50% discount to peers in the DI space. I like our chances for continued growth and even multiple expansion over time,” he said. Miller sees two other opportunities as volatility may continue. The first is companies that can growth 20% plus growth in years to come, with attractive multiples, high margins, little to no debt, secular tailwinds, reinvestment ability — top holdings PAR Technology (PAR), Digital Turbine (APPS), and Elastic (ESTC). He is also scouting companies selling for deep value, unavailable in the last several years. “Will either of these groups of companies escape near-term gyrations? Unlikely. Will either of these groups compound at high rates over time? I like our chances,” said Miller. U.S. Stocks Had a Terrible January. History Offers Plenty of Comfort. As starts to the year go, it has been a pretty bad one. But at least January is finally coming to an end. The S&P 500 has fallen 7% so far this month and is on track for its worst January since 2009. The Federal Reserve’s hawkish tilt is largely to blame. Fed Chair Jerome Powell’s press conference last week failed to ease concerns and volatility, as he promised a “nimble” approach to monetary policy in the face of surging inflation. Historically, a bad first month hasn’t necessarily spelled a bad year. The S&P 500 has fallen 3% or more in January on six occasions in the past 20 years, three of which were more than 5% declines. On three of those occasions, the index was back in positive territory for the year by the end of February. In 2016 it took until March, and in 2009, investors had to wait until May. The exception, of course, was 2008, which never turned positive. Aside from urging investors not to panic, history also suggests there is nothing wildly abnormal about the start to 2022. The S&P 500 has averaged about one 10% decline and more than three 5% declines every year since it was created in 1957, according to Dow Jones Market Data. However, the index hasn’t had a 10% correction since March 2020 and only registered one 5% pullback in the whole of 2021. If anything, the past two years have been abnormal. That could mean more volatility ahead, if there is a reversion to the mean. Midterm years tend to be the most volatile in the four-year presidential cycle, with an average 17.1% peak-to-trough decline, LPL Financial noted. But a year later the S&P 500 has been an average of 32% up on lows. —Callum Keown BARRONS https://www.investopedia.com/articles/markets/012616/adidas-vs-nike-vs-under-armour-which-2016-nkeua.asp Adidas vs. Nike vs. Under Armour: Stocks Compared for 2022 By MATTHEW JOHNSTON Updated January 19, 2022 Reviewed by ANDY SMITH Adidas AG (ADDYY), Nike Inc. (NKE), and Under Armour Inc. (UAA) are three of the largest retailers in the highly competitive athletic apparel industry. Sportswear companies make and sell clothing designed for athletes and people with active lifestyles, including running shoes, shorts, T-shirts, tracksuits, swimsuits, and more. The global sports apparel market generated $188.2 billion in revenue during 2020, up 4.0% compared to the previous year. The COVID-19 pandemic hampered the sales of many sportswear companies in 2020, but athletic apparel in particular was more resilient than the broader apparel industry.1 Total revenue for the global sports apparel market is expected to rise 2.0% to approximately $192.0 billion in 2021.2 Adidas vs. Nike vs. Under Armour Price Market Cap 1-Year Total Returns P/E Ratio Adidas AG (ADDYY) $140.00 $54.6 B -16.5% 27.8 Nike Inc. (NKE) $165.39 $261.8 B 22.3% 43.9 Under Armour Inc. (UAA) $22.25 $10.6 B 31.6% 23.7 Source: YCharts as of Dec. 13, 2021 Adidas AG (ADDYY) Adidas’ business was severely impacted by the pandemic in 2020, especially in the first half of that year due to temporary store closures. Most of the company’s stores reopened by the end of the year, with the exception of stores in Europe. But the pandemic prompted Adidas to focus on bolstering its e-commerce sales channels. E-commerce revenues rose 53% in 2020, accounting for more than 20% of the company’s total sales. Total revenue sank 14% in currency-neutral terms.3 Adidas started 2021 with first quarter sales up 27% in currency-neutral terms despite ongoing lockdowns in Europe and industry-wide supply-chain challenges.4 However, it missed earnings per share (EPS) estimates by 30.9%.5 Strong growth continued in the second quarter, with currency-neutral sales up 55% even with extended lockdowns in the Asia-Pacific region. The results prompted Adidas to raise its full-year outlook for 2021.6 Late in the second quarter, the company announced a new share buyback program to be executed in the second half of the year.7 Sales growth slowed to 3% in currency-neutral terms during the third quarter. Geopolitical tensions hurt Adidas’ Greater China sales, which declined 15%.8 Adidas and other Western companies publicly raised concerns about allegations of forced labor in China’s Xinjiang region, prompting Chinese consumers to boycott Adidas products earlier in the year.9 During the quarter, Adidas announced plans to sell Reebok to Authentic Brands Group for as much as $2.5 billion.10 In October, the company announced that it would begin another new share repurchase program after completing in September the program it announced in late June.11 Currently, 16 analysts out of 29 have a buy rating for Adidas’ stock, while one gives it an overweight rating, ten give it a hold rating, and two an underweight rating. There are no analysts who currently recommend selling the stock.12 Nike Inc. (NKE) The pandemic drove Nike to accelerate its pivot towards its e-commerce channels. In the second quarter of the company’s 2021 fiscal year (FY), the three-month period ended Nov. 30, 2020, Nike’s digital sales rose 84% (80% on a currency-neutral basis) while companywide revenue grew just 9% (7% on a currency-neutral basis).13 Nike had already been investing in its online direct-to-consumer business prior to the pandemic. As a result, the company was in a stronger position than many rivals to ramp up e-commerce sales when the pandemic began.14 That showed in Nike’s results. Its second quarter EPS surprised analysts’ estimates by 25.8%.15 Disruptions related to the pandemic continued to impact Nike’s results in its fiscal third quarter, ended Feb. 28, 2021. Revenue rose 3% (but fell 1% on a currency-neutral basis). Congestion in U.S. ports and ongoing store closures in Europe were a drag on Nike sales.16 However, digital sales continued to deliver strong growth, up 59% (54% on a currency-neutral basis).17 Nike’s fortunes changed dramatically in its fiscal fourth quarter. It reported its highest quarterly revenue ever as EPS beat consensus estimates by 82.4%.15 Fourth quarter revenues rose 96% (88% on a currency-neutral basis) to $12.3 billion as the company’s business rebounded from the negative impact of the pandemic in the prior year.1819 Despite the fourth quarter rebound, global supply chain disruptions continued to weigh on Nike’s first quarter 2022 results. While revenue came in below analysts’ expectations, it was still up 16% (12% on a currency-neutral basis) for the year.2021 A total of 17 analysts out of 31 currently have a buy rating on Nike’s stock. Nine analysts have an outperform rating, four a hold rating, zero an underperform rating, and just one analyst recommends selling the stock.22 Under Armour Inc. (UA) Under Amour was also hurt by the pandemic in 2020, with annual revenue declining 15%. Like Adidas and Nike, the company’s e-commerce sales helped to mitigate the impact of store closures. Under Armour’s e-commerce sales grew 40% during the year.23 Its fourth quarter EPS surprised analysts’ estimates by 300.0%.24 In Under Armour’s first quarter of 2021, the company raised its full-year outlook on optimism about the rebound in demand for its products. Sales were up 35% (32% on a currency-neutral basis), beating consensus estimates.25 EPS crushed analyst forecasts by 433.3% as e-commerce sales rose 69%.2426 Under Armour topped consensus estimates again in the second quarter, with EPS beating analyst forecasts by 300.0%. The company’s sales, up 91% (85% on a currency-neutral basis), also beat expectations. It once again raised its full-year outlook for 2021.2728 It was a similar story in the third quarter of 2021, with strong EPS and sales prompting the company to raise its outlook for all of 2021. Revenue for the quarter rose 8% (6% on a currency-neutral basis).29 Under Armour posted those results despite a number of obstacles, including ongoing supply-chain problems. Factories in Vietnam, where about one-third of Under Armour’s apparel and accessories are made, were forced to shut down due to COVID-19 outbreaks. The company said in early November that most of the factories were back up and running.30 There are nine analysts that currently have a buy rating on Under Armour’s stock out of a total of 26. Three analysts have an outperform rating, 11 have a hold rating, two have an underperform rating, and just one analyst recommends selling the stock.22 The Bottom Line Adidas, Nike, and Under Armour are seeing their business operations rebound in 2021 from the previous year’s pandemic-related shock. All three have dramatically expanded their e-commerce sales. Their recovery is happening despite major supply chain disruptions. But investors aren’t uniformly enthusiastic. That’s illustrated by these three companies’ stock performance, which has varied significantly. Under Armour’s shares have delivered a total return of 31.6% over the past 12 months, far outperforming the broader market. Nike has risen 22.3%. The big loser is Adidas, down 16.5% during that period. Despite its superior stock performance, Under Armour currently has the lowest price-to-earnings (P/E) ratio, indicating it is still relatively undervalued compared to the other two sportswear companies. Its earnings performance has also been stronger than Nike or Adidas. But it is Nike’s stock that analysts are most optimistic about, with 26 of the company’s analysts having either a buy or outperform rating on the stock, more than each of the other two companies have. SPONSORED Hire a Pro: Compare Retirement Advisors In Your Area https://www.cnbc.com/2022/01/27/robinhood-shares-tumble-9percent-after-first-quarter-revenue-forecast-is-well-below-estimates.html?__source=iosappshare%7Ccom.apple.UIKit.activity.Mail Robinhood loses active users in the fourth quarter, forecasts weak revenue PUBLISHED THU, JAN 27 20224:10 PM ESTUPDATED FRI, JAN 28 20224:00 PM EST Maggie Fitzgerald@MKMFITZGERALD KEY POINTS Robinhood anticipates first-quarter revenue of less than $340 million, down 35% compared with 2021. Wall Street expected $448.2 million in revenue for Q1, according to FactSet.Monthly active users fell to 17.3 million last quarter from 18.9 million in the third quarter.Robinhood is about to face its toughest comps in the first and second quarters of 2022 following its record year in 2021 from events like the GameStop short squeeze. Stock-trading app Robinhood gave a bleak revenue forecast for the first quarter of 2022 on Thursday as its latest earnings report showed a decline in active users. Shares of Robinhood rose 9.7% on Friday after losing more than 14% earlier in the day. Robinhood shares drop |
HI Financial Services Mid-Week 06-24-2014