HI Market View Commentary 06-27-2022
Market expectations are a rebound up to 4100, Market closed next Monday for 4th of July
Which means we might have a selloff like today – big money closing the end of the quarter books
There is STILL RISK to the downside and It wouldn’t surprise me to see us test 3000
HI right now is cash heavy due to collecting profits off of the long put protection and we still have to add shares to certain stocks
OK today again I am going to go over questions and make it short
#1 How are you able to watch the markets when you have a family emergency?
I have to because my money is also in the market and I can’t just let it ride
IF you are protected you don’t necessarily have to be watching every single minute
#2 Do you pay for help with market “stuff” charting, newsletters, etc…..
YES but I am paying so you don’t have too and you can do everything for free
#3 How are you not losing your Sh$#?!?!?!!!! (in todays market)
It is experience – 1987, 1993, 1996-7, 2000, 2003, 2008, 2010, 2020
I’ve been through and came out much better on the other side
#4 Can anyone do what you do?
YES
I just consume HUGE amounts of information
#5 Why don’t you use Artificial Intelligence?
Artificial Intelligence is stupid and past information
How well do you use range data not pin point data
https://www.briefing.com/the-big-picture
The Big Picture
Last Updated: 24-Jun-22 15:31 ET | Archive
Earnings warning signs should start flashing soon
Mark your calendars. We have roughly a month until the second quarter earnings reporting period goes into full swing, and it is likely to be a swing factor for the stock market.
We should hear our fair share of positive earnings surprises but, more importantly, we should hear a larger share of earnings warnings.
A P/E Disconnect
There has been a pickup in warnings already for the second quarter. FactSet informs us that 103 S&P 500 companies have provided guidance for the second quarter, and 71 of them (or 70%) have issued negative guidance.
That is a large percentage, outpacing both the 5-year average (60%) and the 10-year average (67%).
That has helped account for the small (emphasis on the word “small”) downward revision since March 31 to second quarter per share earnings (-0.9%), which is less than the 5-year average (-2.3%) and the 10-yr average (-3.3%).
Still, the second quarter estimated earnings growth rate for the S&P 500 is 4.3%. That compares to an estimated growth rate of 5.9% on March 31.
The projections for earnings growth may have slowed, but they have not gone off the rails to any large extent. That is good news. Of course, it doesn’t match the price action at all since March 31.
As of this writing, the S&P 500 is down 14.2% since the end of the first quarter, but at one point last week it was down 19.7%.
The magnitude of that decline had everything to do with an expectation that the magnitude of current earnings growth projections for coming quarters is woefully out of whack with what is expected to be a much more challenging economic climate.
Forward Thinking Needs Some Re-thinking
Some will say the stock market has suffered like it has because of the shift in rate-hike expectations, the rapid uptick in market rates, the inflation pressures, the COVID-related lockdowns in China, the war in Ukraine, high commodity costs, and the dour disposition of consumer and business confidence.
They aren’t wrong. Those items have caused a stir in one way or another but, in aggregate, they contribute directly to the view that S&P 500 companies, in aggregate, aren’t going to live up to expectations.
The expectations are high, too. According to FactSet, analysts expect earnings growth of 10.7% for the third quarter, 10.1% for the fourth quarter, and 10.4% for all of calendar 2022.
Even more remarkable is the unyielding trend in forward twelve-month earnings, which, at this point, incorporate the last six months of this year and the first six months of 2023. That has moved from $221.91 on December 31 to $231.09 on March 31 to $238.08 today.
This has happened while:
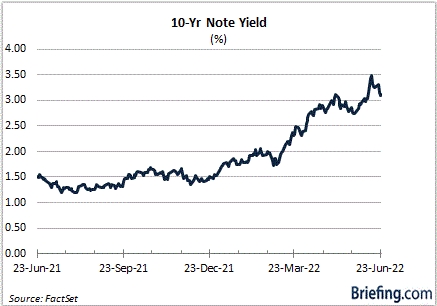
- The 10-yr note yield has gone from 1.51% to 3.50% (it is currently 3.12%).
- The U.S. Dollar has gone from 95.97 to 104.20.

- The target range for the fed funds rate has gone from 0.00-0.25% to 1.50-1.75%, and has been accompanied by a median estimate of 3.80% for 2023.

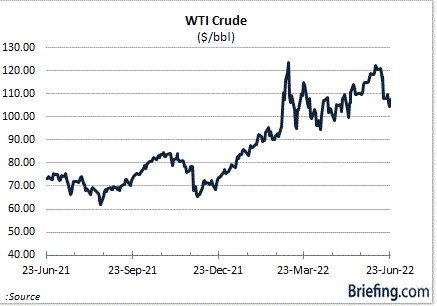
- WTI crude futures have moved from $75.21 to $123.68 on June 14 (they are currently at $107.65).
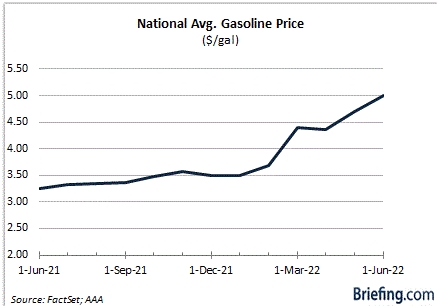
- The national average for gasoline has eclipsed $5.00/gallon.
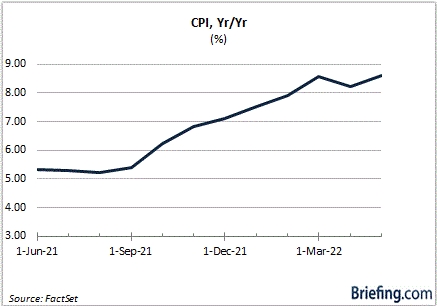
- The annual rate of CPI inflation has climbed to a 40-year high of 8.6%.
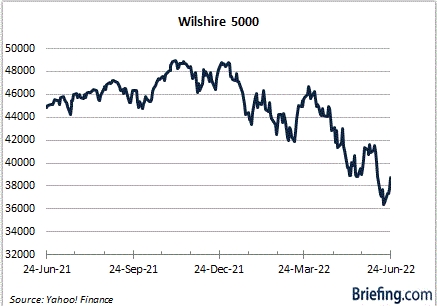
- The Wilshire 5000 market cap has declined by nearly $10 trillion.
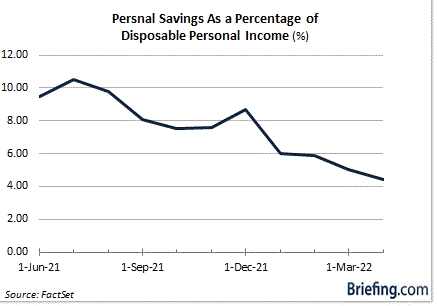
- Personal savings as a percentage of disposable personal income has fallen from 8.7% to 4.4%.
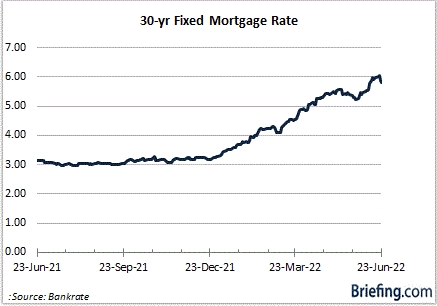
- The 30-yr fixed mortgage rate has increased from 3.27% to 5.81%.
- Leading Wall Street economists have suggested the probability of the U.S. suffering a recession is at least 35%.
- China has locked down major cities as part of its zero-COVID policy, further disrupting supply chains and shipping logistics.
- Leading companies have started to announce layoffs and/or a pause or slowdown in hiring activity.
- Europe has suffered an energy price shock of epic proportion.
That is a lot of components subtracting from forward twelve-month earnings prospects, which is why it doesn’t add up that there wouldn’t be a cut to forward twelve-month earnings estimates.
Fed Chair Powell even indicated this week that it will be challenging for the Fed to achieve a soft landing (i.e. an environment of slower growth or a shallow recession).
What It All Means
It would be wonderful if the S&P 500 lived up to current earnings estimates. That would make it a relative bargain at 16.0x forward twelve-month earnings estimates compared to the 5-year average of 18.6x and the 10-yr average of 16.9x.
The swing factor the market fears — if not the analysts — is that the guidance during the second quarter reporting period will force a downward adjustment to the earnings estimate outlook.
It is a reasonable fear with many factors weighing on earnings prospects. Some are more acute than others, but the weight of expectations has been pronounced in second quarter selling efforts.
Ironically, when the estimate cuts happen is when the stock market might start behaving better, because then it will have a better line on what is a true value versus a value trap.
—Patrick J. O’Hare, Briefing.com
| https://go.ycharts.com/weekly-pulse |
| Market Recap WEEK OF JUN. 20 THROUGH JUN. 24, 2022 The S&P 500 index rose 6.4% last week as stocks began bouncing off the previous week’s lows when the market benchmark entered bear market territory amid inflation concerns. The S&P 500 ended Friday’s session at 3,911.74, up from last week’s closing level of 3,674.84. This marks the index’s first weekly advance since the week that ended May 27. Even with last week’s gain, the S&P 500 is down 5.3% for the month of June. With just four sessions remaining in the month as well as the first half of 2022, the index is down 18% for the year to date. Last week, the index entered bear market territory as the Federal Reserve’s Federal Open Market Committee made a larger-than-expected increase in its benchmark interest rate following higher-than-expected inflation figures reported earlier this month. Investors have grown increasingly worried about whether the central bank will be able to achieve a “soft landing,” in which rate increases curbed inflation without sending the economy into a recession. Last week, in testimony to the House Financial Services Committee, Fed Chairman Jerome Powell said a recession is possible and a soft landing would be “very challenging.” He also said the central bank would be reluctant to shift to cutting rates without clear evidence that inflation “really is coming down.” Nevertheless, most US sectors rose last week, led by the consumer discretionary sector, which climbed 8.2%, and health care, which added 8.1%. Real estate was also strong, up 7.7%, followed by a 7.3% gain in technology, a 7.2% rise in utilities and a 7% climb in communication services, among other gainers. Energy, which slipped 1.6%, was the only sector in the red. In the consumer discretionary sector, Carnival (CCL) said it expects to turn a core profit in its current fiscal third quarter, driven by a boost in demand for cruising following an easing in COVID-19 protocols. Shares of Carnival jumped 13% on the week. The health care sector’s gainers included AbbVie (ABBV), whose shares rose 10% as the company said it has submitted a supplemental new drug application for atogepant to the US Food & Drug Administration for the preventive treatment of chronic migraine in adults. Atogepant, which is marketed as Qulipta in the US, is already FDA-approved to treat adults with episodic migraine. In real estate, shares of American Tower (AMT) climbed 11% as JPMorgan upgraded its investment rating on the stock to overweight from underweight while boosting its price target on the shares to $285 from $245. American Tower was also named one of Credit Suisse’s top five picks among 35 outperform-rated stocks across its REIT coverage universe. On the downside, the energy sector’s drop came as crude oil futures fell on the week. Among the decliners, Marathon Oil (MRO) shares shed 8.7% and Devon Energy (DVN) lost 7.3%. Next week, as June and the first half of 2022 conclude, investors will be looking at data showing May pending home sales and durable goods orders on Monday, the June consumer confidence index on Tuesday, revised Q1 gross domestic product on Wednesday, May personal consumption expenditure inflation and consumer spending data due Thursday, and June manufacturing data due Friday. Provided by MT Newswires |
Where will our markets end this week?
Lower
DJIA – Bearish
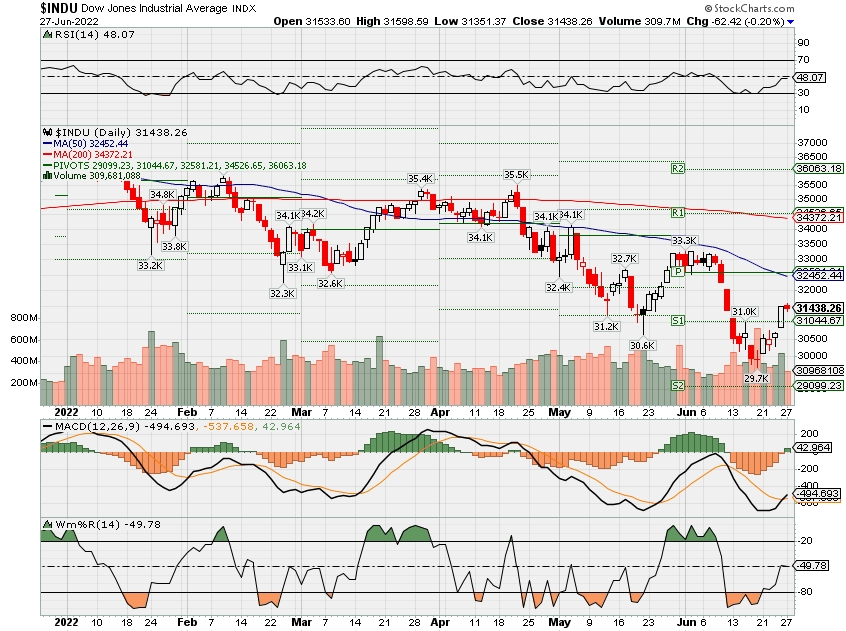
SPX – Bearish
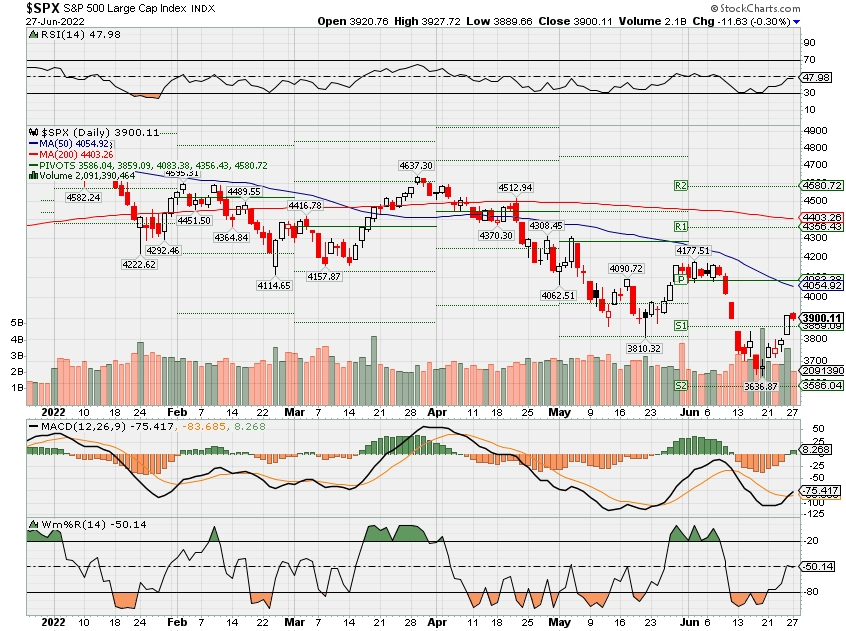
COMP – Bearish
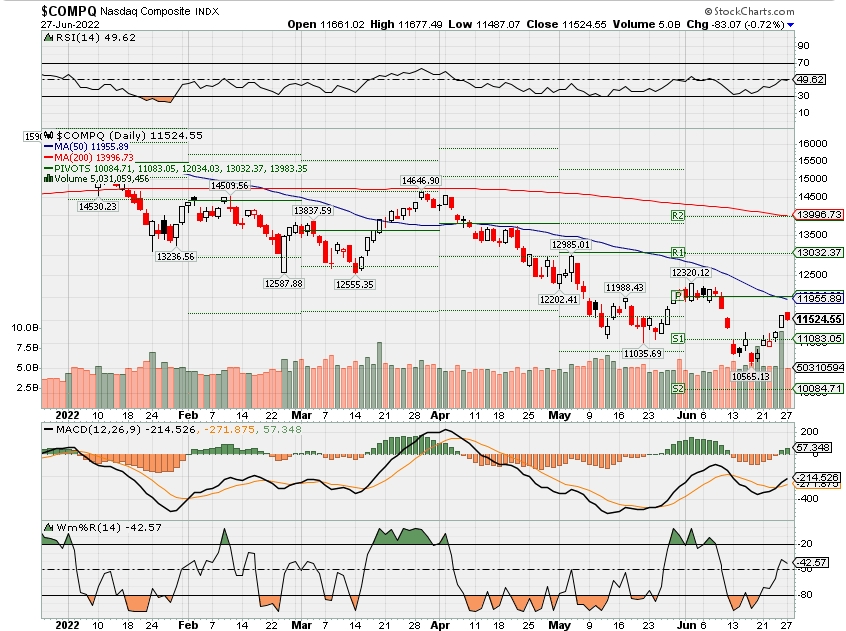
Where Will the SPX end June 2022?
06-27-2022 -5.0%
06-20-2022 -5.0%
06-13-2022 -3.0%
06-06-2022 -2.0%
05-30-2022 +3.0%
Earnings:
Mon: NKE,
Tues:
Wed: BBBY, GIS
Thur: WBA, MU
Fri:
Econ Reports:
Mon: Durable Goods, Durable ex-trans, Pending Home Sales,
Tues: Consumer Confidence
Wed: MBA, GDP, GDP Deflator
Thur: Initial Claims, Continuing Claims, Personal Spending, Personal Income, PCE, Chicago PMI
Fri: ISM Manufacturing, Construction Spending
How am I looking to trade?
Currently protection on all core holding
www.myhurleyinvestment.com = Blogsite
customerservice@hurleyinvestments.com = Email
Questions???
Since you were selling off puts last week when are they going to go back on?
Before the July FOMC rate hike meeting
Crypto hedge fund at center of crisis faces risk of default as deadline to repay $670 million nears
KEY POINTS
- Three Arrows Capital, a crypto-focused hedge fund, has to meet a deadline on Monday to repay more than $670 million in loans to Voyager Digital or face default.
- Voyager said that it “intends to pursue recovery from 3AC” and is talking to its advisors “regarding legal remedies available.”
- Three Arrows Capital, or 3AC, is facing a liquidity crisis after the collapse of terraUSD and luna, margin calls on its loans and a massive slump in the crypto market.
Three Arrows Capital, a crypto-focused hedge fund, has to meet a deadline on Monday to repay more than $670 million in loans or face default, in a case that could have a ripple effect across the digital asset market.
3AC, as it’s also known, is one of the most prominent crypto hedge funds around and is known for its highly leveraged bets.
But with billions of dollars being wiped off the digital coin market in recent weeks, the hedge fund is facing a potential liquidity and solvency issue.
Voyager Digital, a digital asset brokerage, said last week that it had lent 3AC 15,250 bitcoins and $350 million of the stablecoin USDC. At Monday’s prices, the total loan equates to more than $675 million. Voyager gave Three Arrows Capital until June 24 to repay $25 million USDC and the entire outstanding loan by June 27, Monday.
Neither of these amounts has been repaid, Voyager said last week, adding that it may issue a notice of default if 3AC does not pay the money back.
Voyager said that it “intends to pursue recovery from 3AC” and is talking to its advisors “regarding legal remedies available.”
Voyager Digital and Three Arrows Capital were not immediately available for comment when contacted by CNBC.
https://art19.com/shows/beyond-the-valley/episodes/1c321bab-2c21-4b9d-b422-4f33478a1f31/embed?theme=dark-blue Voyager, which is listed on the Toronto Stock Exchange, has seen its shares plummet 94% this year.
How did 3AC get here?
Three Arrows Capital was established in 2012 by Zhu Su and Kyle Davies.
Zhu is known for his incredibly bullish view of bitcoin. He said last year the world’s largest cryptocurrency could be worth $2.5 million per coin. But in May this year, as the crypto market began its meltdown, Zhu said on Twitter that his “supercycle price thesis was regrettably wrong.”
The onset of a new so-called “crypto winter” has hurt digital currency projects and companies across the board.
Three Arrow Capital’s problems appeared to begin earlier this month after Zhu tweeted a rather cryptic message that the company is “in the process of communicating with relevant parties” and is “fully committed to working this out.”
x There was no follow-up about what the specific issues were.
But the Financial Times reported after the tweet that U.S.-based crypto lenders BlockFi and Genesis liquidated some of 3AC’s positions, citing people familiar with the matter. 3AC had borrowed from BlockFi but was unable to meet the margin call.
A margin call is a situation in which an investor has to commit more funds to avoid losses on a trade made with borrowed cash.
Then the so-called algorithmic stablecoin terraUSD and its sister token luna collapsed.
3AC had exposure to Luna and suffered losses.
“The Terra-Luna situation caught us very much off guard,” 3AC co-founder Davies told the Wall Street Journal in an interview earlier this month.
Contagion risk?
Three Arrows Capital is still facing a credit crunch exacerbated by the continued pressure on cryptocurrency prices. Bitcoin hovered around the $21,000 level on Monday and is down about 53% this year.
Meanwhile, the U.S. Federal Reserve has signaled further interest rate hikes in a bid to control rampant inflation, which has taken the steam out of riskier assets.
3AC, which is one of the biggest crypto-focused hedge funds, has borrowed large sums of money from various companies and invested across a number of different digital asset projects. That has sparked fears of further contagion across the industry.
“The issue is that the value of their [3AC’s] assets as well has declined massively with the market, so all in all, not good signs,” Vijay Ayyar, vice president of corporate development and international at crypto exchange Luno, told CNBC.
“What’s to be seen is whether there are any large, remaining players that had exposure to them, which could cause further contagion.”
Already, a number of crypto firms are facing liquidity crises because of the market slump. This month, lending firm Celsius, which promised users super high yields for depositing their digital currency, paused withdrawals for customers, citing “extreme market conditions.”
Another crypto lender, Babel Finance, said this month that it is “facing unusual liquidity pressures” and halted withdrawals.
— CNBC’s Abigail Ng contributed to this report.
This first half ranks among the market’s worst on record. Here’s what typically happens next
Mounting fears of a recession caused by the Federal Reserve hiking interest rates to fight inflation have sent the stock market tumbling into a bear market in the first half.
Ned Davis Research looked at past horrible starts and found there is typically a relief bounce in the second half — even if the selling eventually continues.
SECOND HALF REBOUND?
| YEAR | THROUGH MID-JUNE | REST OF YEAR | FULL YEAR | BEAR END DATE |
| 1932 | -36.9% | 34.6% | -15.1% | 2/27/1933 |
| 1940 | -20.1% | 6.0% | -15.3% | 4/28/1942 |
| 1962 | -22.1% | 13.2% | -11.8% | 6/26/1962 |
| 1970 | -17.3% | 21.0% | 0.1% | 5/26/1970 |
| 2022 | -23.1% | ? | ? | ? |
Source: Ned Davis Research
Every one of the four years that was on par with this one saw a second-half rebound, Ned Davis found. For two of the years, the bear markets ended in the second half. In the other two, the next six months marked a bear market bounce.
Only one year saw the market recover the losses it incurred during the first half.
Looking at this history is instructive if only to show that the magnitude and speed of this downturn is nearly unprecedented to start an annual period. That alone could indicate that at least a small relief bounce is long overdue, regardless of the fundamental picture.
However, Ned Davis believes the comeback chances may come down to whether the economy can skirt a recession.
“The answer may ultimately lay with the Fed, and we will continue to watch economic data for signs the economy is tilting toward or avoiding a recession,” wrote Ed Clissold and Thanh Nguyen in this week’s report.
Some Wall Street banks believe a comeback is possible. JPMorgan strategists even believe the S&P 500 can rally back to even as the U.S. avoids a recession.
“It is not that we think that the world and economies are in great shape, but just that an average investor expects an economic disaster, and if that does not materialize risky asset classes could recover most of their losses from the first half,” wrote Marko Kolanovic, chief global markets strategist for JPMorgan, in a note Thursday.
UBS strategists give the highest probability to a modest bounce in the S&P 500 back to 3,900, or about 4% from here. They anticipate a scenario where inflation stays high but starts to show signs of peaking.
—With reporting by Michael Bloom

HI Financial Services Mid-Week 06-24-2014