HI Financial Services Commentary 05-23-2017
You Tube Link: https://youtu.be/p62JzOGtnd4
Ready to jump ship when none of the fundamentals have changed. WHY?????
I’m not worried yet about the trade = Fed Minutes, Trump Tweets, Terror in Europe, Historical summer downturns, Political unrest in Washington, Failed health care plan, no tax plan
I have technically validations on my next moves
What’s happening this week and why?
New home Sales 569 vs est 608
Trump trip to middle east where new business with Saudi Arabia and Israel
Terrorist attacks in Europe
Buy the dippers are out force
Where will our market end this week?
Lower
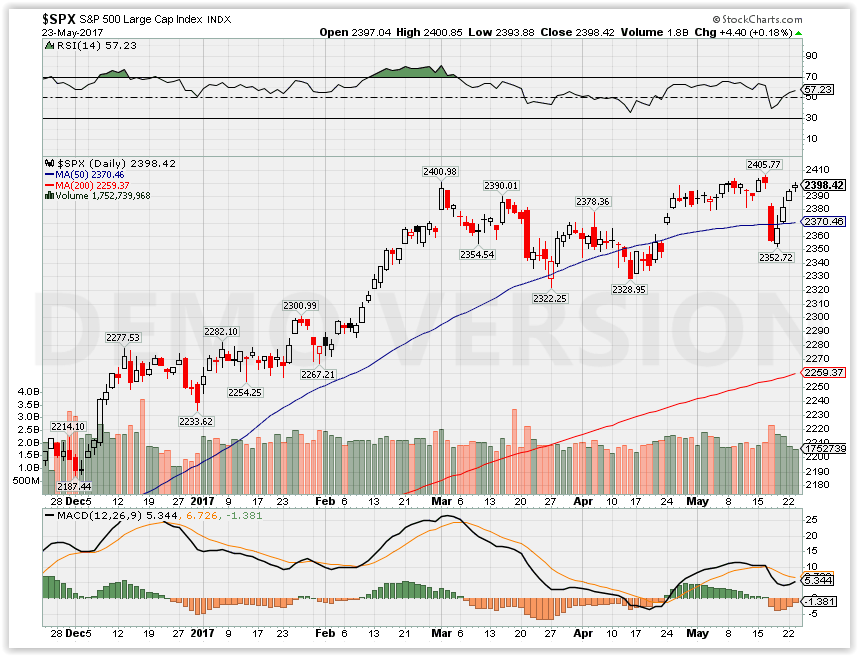
SPX – Bullish

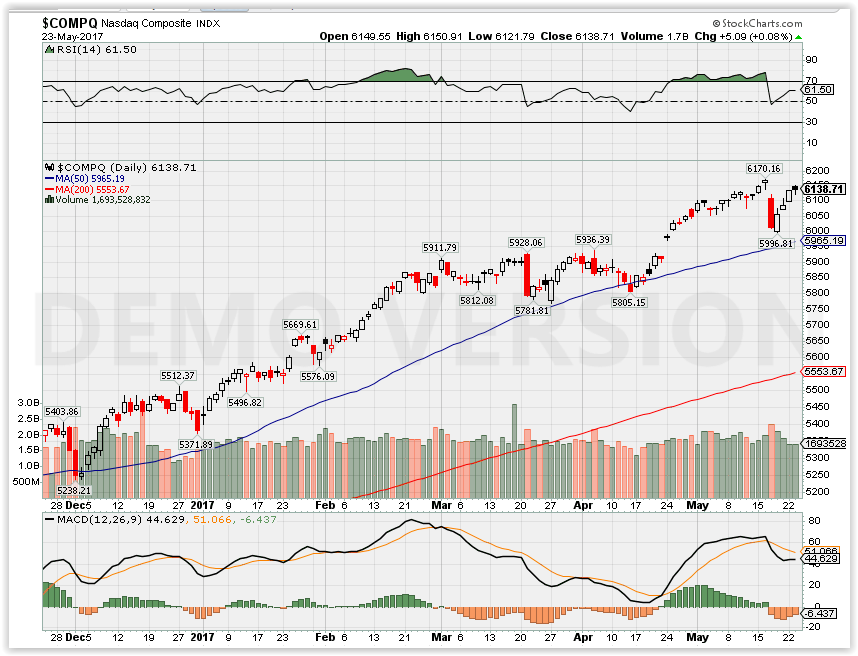
COMP – bullish

Where Will the SPX end May 2017?
05-23-2017 +0.0%
05-16-2017 +2.0%
05-09-2017 +2.0%
05-02-2017 +2.0%
What is on tap for the rest of the week?=
Earnings:
Tues: AZO, TOL, INTU
Wed: CHS, JASD, TIF, HPQ, PVH
Thur: ANF, BBY, GCO, HRL, MDT, COST, GME, MRVL,
Fri: BIG
Econ Reports:
Tues: New Home Sales
Wed: MBA, Crude, FHFA Housing Price Index, Existing Home Sales, FOMC Minutes
Thur: Initial, Continuing Claims,
Fri: Durable Goods, Durable ex-trans, GDP, GDP Deflator, Michigan Sentiment
Int’l:
Tues – JP: All Industry Index
Wed –
Thursday –
Friday –
Sunday –
How I am looking to trade?
Looking to Bull put long puts in past earnings collar trades,
Looking to add summer short calls for income
Questions???
How do I sit and wait for technical crossovers on positions?
Primarily I collar trade and use technically to adjust the long put or short call
I use 2 to 4 days after crossovers to validate a trend change
www.myhurleyinvestment.com = Blogsite
customerservice@hurleyinvestments.com = Email
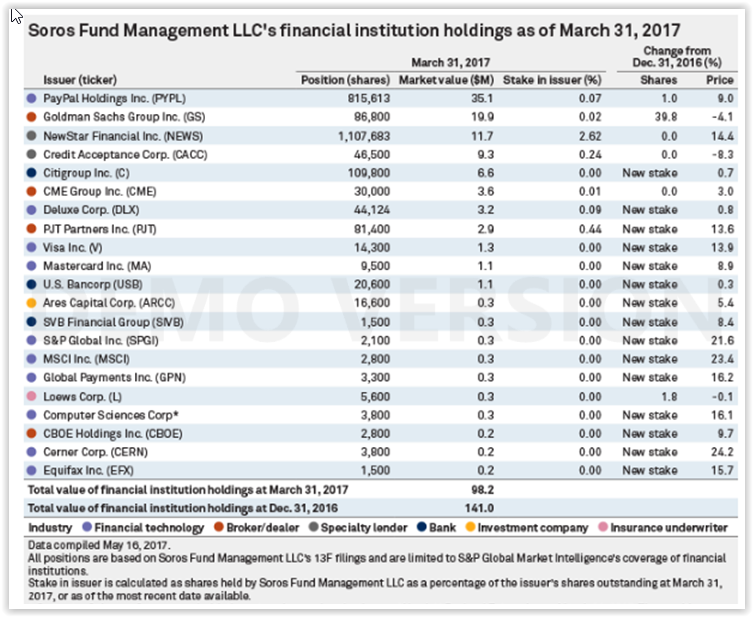
George Soros has added to his losing bets against the stock market
Thursday, 18 May 2017 | 5:04 PM ET
http://www.cnbc.com/id/104479357
Billionaire investor George Soros has upped what so far has been a losing bet on the U.S. stock market, according to recent filings.
The hedge fund manager and active supporter of progressive causes added bearish options plays to his portfolio during the first quarter.
His two primary plays — against large caps via the S&P 500 and small caps via the Russell 2000 — have a notional, or potential, value of $764.3 million, according to an analysis from S&P Global Market Intelligence. The plays are through his family office, Soros Fund Management.
They continue a trend he began in 2016 of betting against the market, moves that haven’t worked out well considering the latest leg in the bull market. The S&P 500 is up 5.7 percent this year while the Russell 2000 is up fractionally at 0.3 percent.
As of the end of the quarter, Soros held 3.3 million shares of the iShares Russell 2000 exchange-traded fund puts, an increase of 36 percent from the previous quarter and carrying a notional value of $459.6 million. He increased his holdings of SPDR S&P 500 puts by 162 percent from the fourth quarter to 1.3 million shares, carrying a notional value of $304.7 million.
A Soros spokesman declined to comment.
Puts are options to sell positions at an agreed-upon price and date.
It was a mixed bag otherwise for Soros, according to holdings in his 13-F form filed with the Securities and Exchange Commission.
A complete look at Soros’ stock positions:
He added to positions in social media with a losing bet on Snap, which is off 15.5 percent since its initial public offering in March, but raised his stock ownership of Facebook, which has surged 28.3 percent.
May Business Conditions Monthly
by
MONDAY, MAY 22, 2017
AIER Leaders hold at highest level since November 2014
Economic data over the past month show mostly favorable underlying trends. The labor market remains the cornerstone of the expansion, with job creation and wage gains boosting aggregate personal income. Consumer spending continues to trend higher with some pockets of weakness. Business investment is picking up, as is housing. Imports and exports have gained recently, but exports remain subject to variations in global growth and the dollar.
The AIER Business-Cycle Conditions Leaders index held at 83 in April, matching the highest level since November 2014. The Coinciders index remained at a perfect 100 for a second month, while the Laggers index pulled back for the second month in a row, to 75 from 83 in the prior month (chart 1). On balance, the solid performance of our Leaders combined with the preponderance of other economic data is reassuring, suggesting continuing economic expansion in the months ahead, with a low risk of recession.
As with last month, 9 of the 12 Leaders are expanding, though one indicator went from neutral to expanding while another changed from expanding to neutral. The indicator for average workweek in manufacturing turned from an increasing trend last month to a flat trend. As discussed last month, the average workweek indicator does have a natural limit on its performance. The average workweek in manufacturing can only increase so far before plateauing: workers can only work so many hours in a week. Though this indicator has moved back to a flat trend, serious concern should only arise when it changes to an unfavorable trend.
Real new orders for consumer goods is the indicator that switched from a flat trend to an expanding trend. With all the other consumer-and labor-market-related indicators showing a positive trend, it was just a matter of time before the indicator for real new orders for consumer goods returned to expanding.
Unit sales of heavy trucks remained in a flat trend in April after several months in a downward trend. Its performance stands in contrast to the other capital-spending-related Leader, real new orders for core capital goods. The core capital goods Leader had shown weakness for most of the period from 2012 through 2015 but turned to a positive trend in January 2017. Capital spending in the United States has been weak over the past several quarters, partially because of the collapse in energy prices in the middle of 2014. As energy prices rebound, investment in energy-related industries has bottomed and looks to be turning higher. Stronger economic data, better sales and profit growth, and higher business confidence may support faster growth in business investment in coming quarters.
The one Leader that remains in a downtrend is the yield curve. The spread of 10-year over 1-year Treasuries has been narrowing as short-term rates rise along with the fed funds rate while longer rates remain somewhat steady, likely buoyed by safe haven buying. Continued Fed tightening will keep upward pressure on long rates. That pressure combined with strengthening economic growth, rising price pressures, and the likely beginning of the end to Fed balance sheet reinvestment will add to upward pressure on long-term Treasury yields.
Confirmation for our Leaders comes from our Coinciders index, which registered a perfect 100 for the second month as all six of the indicators continue expanding. The back-to-back 100 readings are the first since August-September 2015. All six of the Coinciders are now showing strong expansion trends.
Our Laggers posted its second decline in a row in April, falling to 75 from 83 in March, and 92 in February. Four indicators are currently trending higher, while one—real commercial and industrial loans—is flat. Core CPI, which had been trending flat last month, moved to a downward trend in April. The recent slowdown in core CPI is primarily a result of slower increases in some areas of medical care and in college education costs. Both have been areas of persistent upward pressure in recent years. Only time will tell whether the deceleration in these areas will continue or will turn out to have been temporary.
First-quarter GDP report highlights key trends and risks
Real gross domestic product rose at a 0.7 percent annual rate in the first quarter, down from a 2.1 percent pace in the fourth quarter of 2016, according to the Bureau of Economic Analysis. Among the components, business and housing investment accelerated in the first quarter, partially offsetting slower consumer-spending gains and declines in government spending and inventory accumulation.
Business investment rose at a 9.4 percent annualized rate in the first quarter of 2017. That gain was led by a 22.1 percent surge in spending on structures, while spending on equipment rose 9.1 percent and intellectual property investment rose 2.0 percent. Residential investment, or housing, accelerated to a 13.7 percent rate of increase compared to a 9.6 percent pace in the prior quarter. Altogether, business and residential investment contributed 1.62 percentage points to total GDP growth compared to just a 0.46 percentage-point contribution in the fourth quarter.
Real new orders for core capital goods, one of the AIER leaders, rose 0.2 percent in the latest month, the sixth monthly increase in a row and the ninth increase over the past 10 months. The trend in real new orders for core capital goods is clearly upward and has been a positive contributor to the AIER Leaders index for the past six months.
The combination of an improving economic outlook, rebounding corporate sales and profits, strong balance sheets, and low (though rising) financing rates provides a positive environment for business investment. The tight labor market and rising labor costs should provide the incentive for continued increases in capital investment.
A main contributor to the slower pace of real GDP growth in the first quarter was a sharp deceleration in consumer-spending growth. Real personal consumption expenditures rose at just a 0.3 percent annual rate in the first quarter compared to a 3.5 percent pace in the fourth quarter of 2016. That deceleration means that real PCE contributed only 0.23 percentage points to first-quarter growth compared to 2.4 percentage points in the fourth quarter. The primary reasons for the slowdown are a plunge in spending on household utilities because of unusually warm weather, and a sharp decline in auto sales.
The plunge in utility spending is a negative in the calculation of real GDP but may be a positive for consumers. The sharp decline is also unlikely to be repeated in the second quarter. The slowdown in auto sales is more significant. Auto sales in the United States had been on a record pace in 2015 and 2016, but signs suggest the market may be somewhat saturated. Two key issues are whether a strong labor market can help sustain demand and whether financing will still be available as interest rates rise.
Both real exports and real imports rose in the first quarter, resulting in a negligible impact on real GDP growth. Real exports rose 5.8 percent compared to a 4.5 percent drop in the fourth quarter, while real imports rose 4.1 percent versus a 9.0 percent jump in the prior quarter. The net effect of trade was a slight, 0.07 percentage-point contribution to real GDP growth in the first quarter.
The biggest drag on first-quarter real GDP growth was a $39.2 billion (in real terms) drop in inventories for the quarter compared to a real increase of $42.5 billion in the fourth quarter of 2016. That swing to liquidation from accumulation chopped 0.93 percentage points off real GDP growth in the first quarter. Inventories can be quite volatile from quarter to quarter but add very little to real economic growth over the long term.
Government expenditures were another drag on first-quarter real GDP growth. Spending fell 1.7 percent in the first quarter, led by a 4.0 percent drop in defense spending. Nondefense spending rose at a 0.9 percent pace, while state and local government spending fell 1.6 percent. Overall, government spending sliced 0.30 percentage points off first-quarter real GDP growth.
Fed on track with policy normalization
Strength in underlying economic trends, including ongoing gains in the labor market and inflation measures close to Fed targets, supports Fed plans to continue with policy normalization. The Fed increased the fed funds target from 0.75 to 1.0 percent at the March 15 FOMC meeting. It then held rates steady following the FOMC meeting on May 2-3. Current expectations are for two additional rate increases in 2017 followed by three or four increases per year until the fed funds target reaches 3.0 percent sometime in 2019.
Fed members have also been focusing more attention on managing the Federal Reserve’s balance sheet. Security holdings total about $4.2 trillion as of May 4. Published documents from the Fed on the process of policy normalization suggest the next step will be to end its policy of reinvestment and let the holdings of securities shrink naturally. That process could be altered in the future, depending on economic conditions.
One important aspect of the change in reinvestment is the maturity distribution of the current Fed holdings. According to Fed documents, the balance sheet shows about $2.5 trillion of Treasury securities, with about 47 percent having a maturity between one and five years. Another $385 billion, or 16 percent, have a maturity between 5 and 10 years, while $628 billion, or 25 percent, have a maturity greater than 10 years. The remaining 12 percent have a maturity of less than one year. The other significant holding on the balance sheet is mortgage-backed securities. Nearly all of the $1.77 trillion of MBS held by the Fed have a maturity of more than 10 years, though MBS can have significant amounts of prepayments.
Fed members have indicated that changes to reinvestment policy may occur late in 2017 or early 2018 if the economy continues on its current path. It will be in the best interest of the economy and American people for the Fed to move ahead with policy normalization as quickly as prudently possible. It will be equally important for the Fed to be as transparent as possible and communicate plans early in order to minimize any disruptions from policy changes.
MONEY
7 signs you’ll never be a millionaire
Kathleen Elkins | @kathleen_elk
Tuesday, 16 May 2017 | 4:00 PM ET
http://www.cnbc.com/2017/05/16/signs-youll-never-be-rich.html
As self-made millionaire Steve Siebold says, almost anyone has what it takes to become a millionaire.
Are you on your way to striking it rich? Or does your behavior shoot up red flags?
To help you figure it out, we’ve rounded up some warning signs to watch out for. Of course, everyone’s situation is different, but if you’re routinely making these mistakes, it may be time to make some changes when it comes to managing your money.
You put too much emphasis on saving
Sure, rich people value the importance of saving and investing, but they also recognize that the key to getting really, really rich is to focus on earning.
“The masses are so focused on clipping coupons and living frugally they miss major opportunities,” Siebold writes in “How Rich People Think.” “Even in the midst of a cash flow crisis, the rich reject the nickel-and-dime thinking of the masses. They are the masters of focusing their mental energy where it belongs: on the big money.”
That said, there’s no need to completely disregard smart saving strategies. But if you want to reach seven figures, “stop worrying about running out of money and focus on how to make more,” Siebold says.
You don’t have goals for your money
“The number one reason most people don’t get what they want is that they don’t know what they want,” writes self-made millionaire T. Harv Eker in his book, “Secrets of the Millionaire Mind.”
If you want to build wealth, you have to have a clear goal, specific plan and hard deadlines. And when you’re setting goals, don’t be afraid to think big. The rich set their expectations exceptionally high and are up for any challenge, Siebold says: “No one would ever strike it rich and live their dreams without huge expectations.”
You use phrases like “I want” and “I wish”
Just like your thoughts and habits can mean the difference between living a wealthy life and an average life, so can your choice of words. As Jen Sincero writes in her book, “You Are a Badass at Making Money,” “if you’re broke or not where you want to be financially, you can be sure that your language could use an upgrade.”
Certain common phrases are particularly limiting, says Sincero, such as “I want” and “I need,” which are different ways of saying “I lack.” And “I wish,” she says, is another way of saying “I’m not in control.”
Instead, start saying things like, “I have,” “I create” and “I choose.”
You haven’t started investing
Investing is one of the simplest, most effective ways to build wealth, and the sooner you start, the easier it will be to reach seven figures.
“On average, millionaires invest 20 percent of their household income each year. Their wealth isn’t measured by the amount they make each year, but by how they’ve saved and invested over time,” writes personal finance expert Ramit Sethi in his bestseller “I Will Teach You to Be Rich.”
The good news is, it’s easier than ever to put your money to work. Thanks to micro-investing apps such as Acorns, you can start by simply investing your “spare change.” Other apps also aim to make investing simple and accessible, and automated investing services known as robo-advisors can work for you, no matter how much you have in the bank.
You have only one source of income
Sure, you can get rich on one stream of income, but your chances aren’t great. As author Thomas C. Corley found in his five-year study of self-made millionaires, the rich “do not rely on one singular source of income,” he writes in “Change Your Habits, Change Your Life.”
“Three seemed to be the magic number in my study,” he continues. “Sixty-five percent had at least three streams of income that they created prior to making their first million dollars.”
These additional streams could be real-estate rentals, a side hustle or a part-time job.
You rarely step outside of your comfort zone
The average person wants to be comfortable. Rich people, on the other hand, are stimulated by uncertainty.
“Physical, psychological and emotional comfort is the primary goal of the middle-class mindset,” Siebold writes. “World class thinkers learn early on that becoming a millionaire isn’t easy and the need for comfort can be devastating. They learn to be comfortable while operating in a state of ongoing uncertainty.”
You think being rich is reserved for a lucky few
If you think getting rich is out of your reach, you’re probably not going to make millions. The average earner remains average because they expect to, says Siebold: “The masses think they aren’t worthy of great wealth. Who am I, they ask themselves, to become a millionaire?”
“The truth is, in a capitalist country, you have every right to be rich if you’re willing to create massive value for others,” he continues.
Start asking yourself, “Why not me?” After all, that’s what the millionaires and billionaires do.


HI Financial Services Mid-Week 06-24-2014