HI Financial Services Commentary 04-11-2017
Let’s talk about the market and two particular things:
- Market Movement – Based on Headline Risk
We came back from 145 down today on speculation
President that said “I want to be judged by the stock market growth”
Headlines include: North Korea, China, Russia, Syria, Great Britain, France elections, Obamacare, Tax reform, Fed rate hikes and balance sheet decline, tax pullback,
- Robo Trading = Automated trading based on orders placed around technically, computer algorithms, Human programing for unforeseen future market moves
What’s going to happen?
More unemployment, more volatility and more days like today with bigger drops up and down
What’s happening this week and why?
Headline risk is happening
Bank earnings start on Thurday
Where will our market end this week?
Higher because of the holiday
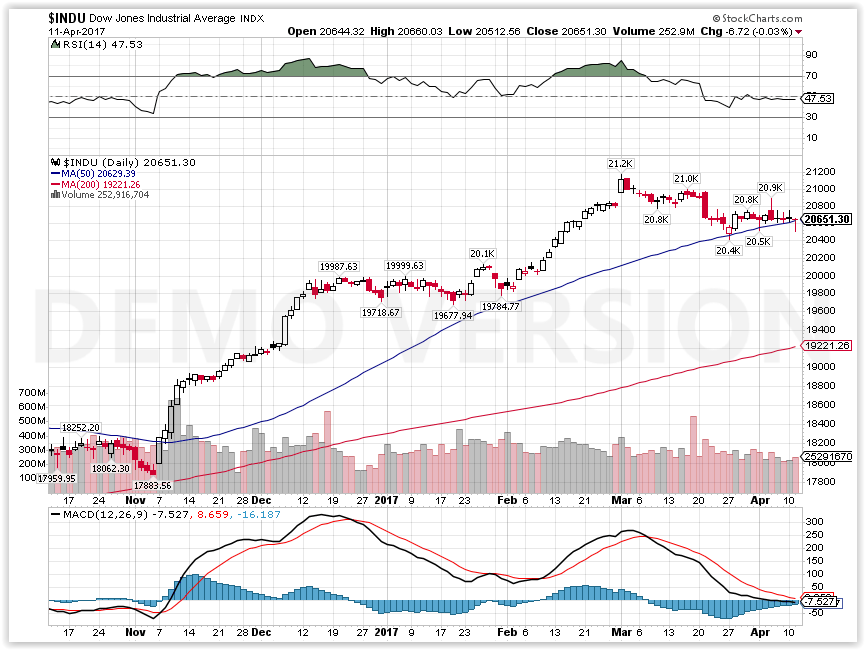
DJIA – Bearish but holding SMA Support
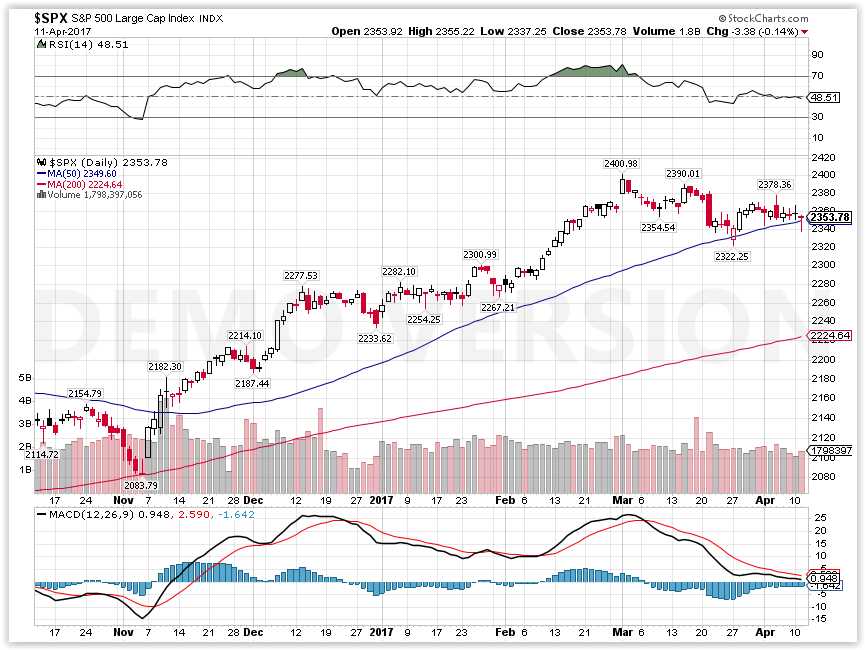
SPX – Bearish but holding SMA Support

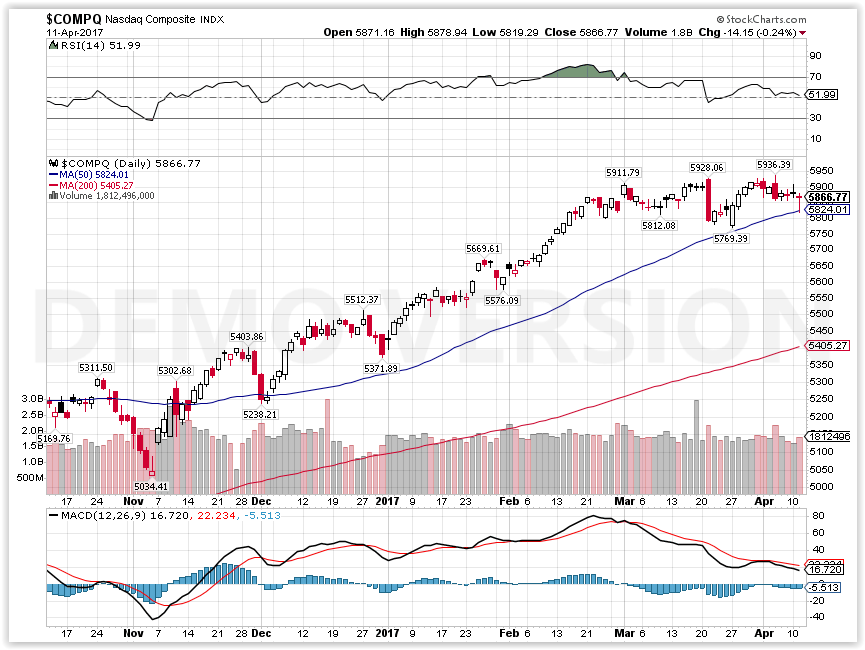
COMP – NOT Technically Bearish but holding SMA Support

Where Will the SPX end April 2017?
04-11–2017 -2.0%
04-04-2017 -2.0%
What is on tap for the rest of the week?=
Earnings:
Tues:
Wed: DAL, FAST
Thur: C, FNH, JPM, PNC
Fri: MARKET CLOSED
Econ Reports:
Tues: Jolts
Wed: MBA, Crude, Import, Export
Thur: Initial, Continuing Claims, PPI, Core PPI
Fri: CPI, Core CPI, Business Inventories, Retail Sales, Retail ex-auto
Int’l:
Tues – CN: CPI, PPI
Wed – GB: Labour Market, JP: PPI
Thursday – CN: Merchandise Trade Balance
Friday –
Sunday – CN: GDP, Industrial Production, Retail Sales
How I am looking to trade?
Coupel weeks ago added some long put protection on positions to get through earnings
110 May Long puts on F
V Jan 2018 92.50 Short call
DIS, AAPL have just been running
FB May 150 short call
DHI May long put at $31
AOBC Long puts at $20
Questions???
Most of what I’m trying to find are stocks that didn’t run last year
AND most of those happen to be what I was in last year= AAPL, BA, F, BIDU, BABA, DIS, V,
www.myhurleyinvestment.com = Blogsite
customerservice@hurleyinvestments.com = Email
https://seekingalpha.com/article/4058156-walt-disney-company-bargain-dcf-sotp-analysis
Is The Walt Disney Company A Bargain? A DCF And SOTP Analysis
Mar.27.17 | About: The Walt (DIS)
Summary
Investment Thesis: ESPN concerns are overstated and investors should consider performance of Parks & Resorts and Studio Entertainment segment. Also, Disney should not divest ESPN.
Based on SOTP analysis, the most likely implied value is between $113 and $142.
Based on DCF Analysis, implied share price is $126.38, which is a 13% premium to the current price of $112. The most likely implied value is between $111 & $145.
Disney has been generating economic value (ROIC greater than WACC) for shareholders, a track record I view very positively.
Source : Googlefinance
Investors who took positions in Walt Disney (NYSE:DIS) stock 1 year ago would have earned a return of 12.65% on their investments by March 22,2017. During the same period, the S&P earned 14.36% in capital gains. Among Disney’s competitors and peers, Time Warner (NYSE:TWX), CBS Corporation (NYSE:CBS) and Twenty-First Century Fox (NASDAQ:FOXA) return 34.70%, 20.57% and 8.25% respectively.
Source : Googlefinance
Disney’s stock has done well over the last 5 years with return of 158.75%, though the past year has been the most difficult in recent history because of ESPN woes.
However, I believe that ESPN concerns are overstated and investors should consider performance of Parks & Resorts and Studio Entertainment segment. Also, Disney should not divest ESPN. Disney has been generating economic value (ROIC greater than WACC) for shareholders, a track record I view very positively.
http://www.cnbc.com/id/104352674
Here’s why the market keeps ripping higher
Monday, 20 Mar 2017 | 5:33 PM ETCNBC.com
The Nasdaq composite index on Monday was the latest U.S. stock market benchmark to hit an all-time high as the bull market, which turned officially 8 years old this month, marches on. Many investors, strategists and traders believe the run will continue as dealmaking picks up, President Donald Trump‘s tax reform is enacted and earnings continue to improve.
“The economic environment has improved to such an extent that the Federal Reserve appears to have greater confidence and commitment to its process of interest rate normalization,” said John Stoltzfus, chief investment strategist at Oppenheimer Asset Management. “After eight years of a recovery bull market, many investors (institutional and retail) who had stayed on the sidelines and away or light on equity exposure appear to be coming back into the market with some adding international exposure.”
The Nasdaq hit an all-time intraday high Monday as shares of Apple hit a new peak. The S&P 500 and the Dow Jones industrial average are within about 1 percent of new highs hit earlier this year. The S&P 500 is up 251 percent since its financial crisis low close on March 9, 2009.
To be sure, there are a growing number of bears on Wall Street, but most of the concerns don’t center on a specific catalyst, but on ebullient sentiment that’s led to above-average valuations in the face of rising interest rates.
“Market valuations are still too expensive,” said Steve DeSanctis, equity strategist at Jefferies. “When the Fed hikes a third, fourth and even fifth time, performance starts to slip for the overall market.”
We’ll get to the bearish reasons in just a bit, but let’s look first at what’s got the bulls so excited about the rest of this year.
Bullish: Investment banking boom
The Snap IPO hasn’t worked out great for investors who bought after its debut but the shares are still 17 percent above their offering price. And the biggest technology IPO since 2014 is getting animal spirits flowing among bankers on Wall Street. There have been 23 IPOs so far this year, already triple the amount at the same time last year, according to Renaissance Capital.
“Increase in IPOs means more stock ‘currency’ will be used for M&A, driving up the stocks of companies that can be acquisition candidates,” said James Altucher, former hedge fund manager and current entrepreneur and author. “More IPO currency will be created this year than the past five years combined.”
And dealmaking is indeed showing signs of picking up with Intel’s $15.3 billion offer for driverless technology play Mobileye a week ago. The purchase of the heavily shorted stock was a wake-up call for hedge funds placing bets against the stock market: there’s still a lot of cheap capital out there looking to be deployed before rates go higher.
As CNBC’s Mike Santoli pointed out in his CNBC PRO column Monday, shares of boutique investment banks like Lazard, Greenhill & Co. and Evercore Partners are really perking up in anticipation this year in anticipation of an M&A boom.
Bullish: President Trump
While more extensive tax reform is likely, the bulls argue there is plenty of room for President Donald Trump and Congress to err. All they really need to do is approve some form of repatriation tax cut, the bulls say. S&P 500 members have $2.4 trillion stashed overseas that could potentially come here if taxes are lowered on overseas profits, according to Strategas Research Partners.
“A deemed repatriation is part of all four major tax options that will be sent to the President when deciding upon a plan,” wrote Daniel Clifton, policy analyst at Strategas, in a note last week. “We would not be surprised if $1 trillion was returned back to the U.S. that could be used for investment, job creation, share repurchases, dividends, M&A, and to pay down debt.”
Some bulls believe that even without any tax reform, it’s enough for market confidence and multiples that we are entering at least a four-year period of deregulation.
“I am still bullish,” said Jim Iuorio, trader at TJM Institutional Services. “The real story isn’t so much the appearance of Donald Trump as it is the absence of President Obama. Toward the end he became the regulation president.”
Bullish: Earnings growth
For the quarter ending this month, S&P 500 earnings are expected to increase by 10 percent, more than the 6 percent profit growth last quarter, according to S&P Global Market Intelligence. Earnings in the technology sector, the group that has lifted the Nasdaq to records this month, are expected to jump 16 percent this quarter, according to S&P.
If stock prices ultimately follow earnings, these are good numbers for the bulls.
This is a “transition from an interest rate-driven to an earnings-driven secular bull market,” wrote Jeff Saut, chief investment strategist at Raymond James, in an email. “The profit lows came in 2Q16.”
The bears argue stock prices are moving too high relative to earnings, raising multiples to historically high levels. The trailing 12-month price-earnings ratio has jumped to above 21 times from 16.7 in February of 2016, according to Oppenheimer.
“The indices are determined by the biggest companies,” said Altucher. Apple “is trading at just 13 times earnings.”
Bearish: Everyone’s too bullish
Many of the bears keep citing that bullish sentiment has gotten too high. They argue that when everyone’s bullish, there’s no one left to buy and so a bull market ends.
“We are currently experiencing multi-decade high extremes of optimism, and we view this euphoria as a warning sign,” said Brad Lamensdorf, short seller and newsletter writer, in his Lamensdorf Market Timing Report.
The number of bulls in the oft-cited Investors Intelligence newsletter survey reached 63 percent in February, the highest since 1987, a contrarian sell signal for many.
“The bull market is not over, but a correction is coming,” said Jim Lebenthal of Lebenthal Asset Management. “Investor sentiment surveys have very high levels of bullish respondents, and they have for a few months now. That usually presages a decline.”
Bearish: President Trump
As often as President Donald Trump is cited by the bulls, he is cited by the market bears.
“The market is in consolidation phase awaiting progress on fiscal policy while nervous about President Trump’s ability to maintain the support of the Republican majority in the face of his lack of prioritization as to what is important (fiscal policy) and what is not (wiretap allegations),” said Stephen Weiss of Short Hills Capital Partners in an email.
Bearish: Rising Rates
The bears believe that low interest rates have been the primary driver of this bull, allowing companies to borrow cheaply to buy back their own stock and making ballooning multiples acceptable on a relative basis. Now that the Fed is in an interest rate hiking cycle, with moves to shrink its balance sheet likely on the horizon, the bears believe the run fueled by cheap money is over.
But Eddy Elfenbein, manager of the AdvisorShares Focused Equity ETF, points out that real rates (interest rates minus inflation) are still low.
The “median Fed member sees the range for fed funds rates to be 2 percent to 2.25 percent by the end of 2018,” said Elfenbein citing the latest Fed “dot plot” data. “They also see inflation at 2 percent. That means real rates will remain negative (and next to negative) for nearly two more years.”
“That’s the strongest point in the bulls favor,” he said.
http://www.cnbc.com/id/104386570
Billionaire investors didn’t get rich by using index funds, Leon Cooperman says
Christine Wang | @christiiineeee
Wednesday, 5 Apr 2017 | 2:29 PM ETncel
Billionaire hedge fund manager Leon Cooperman defended his industry, saying passive management isn’t how famed investors have built their fortunes.
“All I know is if the ability to underperform exists, the ability to outperform also exists. Warren Buffett, Mario Gabelli, Stan Druckenmiller and Ken Langone — and a little bit Lee Cooperman — didn’t get to their net worth by buying an index,” Cooperman said Wednesday on CNBC’s “Halftime Report.”
Passive investing has grown in popularity as hedge funds have seen billions in outflows. Unlike hedge funds or active management, passive funds track an index and don’t have professional managers selecting their holdings.
While some market watchers may be right that hedge funds are having a tough time in the short term, Cooperman argued history shows that may be the wrong call in the long run.
There are periods where the hedge fund industry consistently outperforms the market, but also stretches where it struggles to do that. When hedge funds can’t deliver, he said it makes sense that their asset bases shrink.
“Money goes where money is treated best. The one truism is that you cannot charge a premium fee and deliver subpar performance,” Cooperman said.
He said a bear market or “two-way market” could help hedge funds regain their popularity.
“There’s no question it’s an expensive form of asset management and fees are coming down,” Cooperman said.
Cooperman’s Omega Advisors had about $3.6 billion in assets under management as of March 31.
Here’s how much the average family has saved for retirement at every age
Kathleen Elkins | @kathleen_elk
Friday, 7 Apr 2017 | 11:28 AM ET
When it comes to retirement savings, how do you stack up?
According to a report from the Economic Policy Institute (EPI), the mean retirement savings of all working-age families, which the EPI defines as those between 32 and 61 years old, is $95,776.
But that number doesn’t tell the whole story. Since so many families have zero savings and since super-savers can pull up the average, the median savings, or those at the 50th percentile, may be a better gauge. The median for all working-age families in the U.S. is just $5,000.
As the charts show, retirement preparedness varies by age. Not surprisingly, younger families have less stashed away. Here’s a breakdown of the mean and median retirement savings of U.S. families at every age:
Mean retirement savings of families between 32 and 37: $31,644
Median retirement savings of families between 32 and 37: $480
Mean retirement savings of families between 38 and 43: $67,270
Median retirement savings of families between 38 and 43: $4,200
Mean retirement savings of families between 44 and 49: $81,347
Median retirement savings of families between 44 and 49: $6,200
Mean retirement savings of families between 50 and 55: $124,831
Median retirement savings of families between 50 and 55: $8,000
Mean retirement savings of families between 56 and 61: $163,577
Median retirement savings of families between 56 and 61: $17,000
How big should your nest egg be?
The answer is highly personal, and specific dollar amounts can be arbitrary, but according to retirement-plan provider Fidelity Investments, a good rule of thumb is to have 10 times your final salary in savings if you want to retire by age 67.
Fidelity also suggests a timeline to use in order to get to that magic number:
- By 30: Have the equivalent of your salary saved
- By 40: Have three times your salary saved
- By 50: Have six times your salary saved
- By 60: Have eight times your salary saved
- By 67: Have 10 times your salary saved
Need help reaching these savings goals? Check out:

HI Financial Services Mid-Week 06-24-2014