HI Market View Commentary 05-01-2023
So today I heard the comment about a “non-recession recession”.
With all the QE that the world injected into economies what would be the expectation? = Inflation but rising economy, we juiced the GDP Returns with already counted monies = home prices went up,
What else went up?= Everything else also went up
Everything went up artificially and now the “system” has to rebalance itself.
My expectations are earning need to count for something.
Approaching the 4200 level for a triple top which means earnings need to push us higher and the FED on Wednesday needs to make some comment on the ending of scheduled rate hikes in the near future.
Last week we added 407 SPY puts to portfolios which is 10 points lower than today
Wednesday do we get any verbiage to say we are taking a pause or slowing down??? I don’t think they are smart enough to add the verbiage
The majority of the market gains (S&P 500) have come from the FANG Stocks
Earnings dates:
AAPL – 5/04 AMC
BIDU – 5/24
CVS – 5/03 BMO
DIS – 5/10 AMC
F – 5/02 AMC
SQ – 5/04 AMC
UAA – 5/09
The Big Picture
Last Updated: 28-Apr-23 12:01 ET | Archive
X-date marks the climactic debt ceiling spot
In life, we are always aiming to raise the ceiling. We advocate to raise the ceiling on our children’s learning; we aim to raise the ceiling in our relationships; we work to raise the ceiling on our careers; we attempt to raise the ceiling with our travel experiences; and we train to raise the ceiling for our personal fitness.
To raise the ceiling, metaphorically speaking, is to allow room to move into a higher and better position.
Not metaphorically speaking, Congress always raises the debt ceiling.
History To Repeat Itself?
In recent years, the process of raising the debt ceiling has devolved at times into a not-so-pretty process. 2011 was the most jarring case in point, inviting an historic downgrade of the nation’s debt rating by Standard & Poor’s in response to the political brinkmanship that created unnecessary waves of angst about the U.S. defaulting on its debt.
Unfortunately, there is a burgeoning sense that history could repeat itself this year given the divided Congress and entrenched viewpoints on what should be done to raise the debt ceiling.
Republicans are coalescing around a platform that calls for spending cuts in exchange for raising the debt ceiling by $1.5 trillion or until March 31, 2024, whichever comes first. Democrats, meanwhile, are coalescing around a platform that calls for raising the debt ceiling without any strings attached.
So, what’s it going to be? That is the $31.4 trillion question and then some.
The nation’s current debt ceiling is $31.4 trillion. We hit the ceiling in January, prompting Treasury Secretary Yellen to warn lawmakers then that the Treasury Department would be taking “extraordinary measures” to keep paying the bills, but that such measures would eventually run dry. The day they do would be the climactic “X-date.”
Treasury Secretary Yellen at the time did not think the payment well would run dry before early June, but some strategists have suggested the X-date could be in early June instead of the July-August period that had been widely mentioned because tax receipts have not been as strong as originally forecasted.
To be fair, others are prognosticating that tax receipts will be enough to get past early June and that estimated tax payments made by June 15 will buy the Treasury some more time with its extraordinary measures, perhaps even into August or a bit later before the U.S. looks at the “Big D” — and we don’t mean Dallas — in the event there is no agreement to raise the debt ceiling.
Changes of Note
The monthly Treasury Budget statement, which is rarely a market mover, is apt to carry market-moving status on May 10 when the April report is released, showing income tax receipts for April that will shape expectations for when the X-date will be reached. The Treasury market might be moved more initially by that understanding than the stock market.
Already we are seeing some changes that reflect the growing concerns about the rancor in Congress, where Republicans and Democrats alike are saying they will not let a default happen before then telling the other party what it needs to do to ensure a default doesn’t happen.
Credit default swap spreads are rising and there has been a notable divergence at the front of the yield curve.
A 3-month T-bill matures in July, meaning close to the possible X-date or, egad, after it. Accordingly, the 3-month T-bill yield has been rising with concerns about a default weighing on buying interest. The 1-month T-bill, though, has been in greater demand, partly because of the banking issues but also because its maturity date remains in a “safe zone” that predates any X-date.
To be sure, shorter-dated Treasury securities will be in the crosshairs of any default drama, so their behavior in the ensuing weeks will be a good gauge of the market’s belief — or lack thereof — in Congress working out an agreement to raise the debt ceiling before there is a default.
What It All Means
Just about everyone asked to comment on what would happen in the event the U.S. defaults on its debt says it will be calamitous for capital markets and ruinous for the nation’s credit standing, ensuring demands for higher rates from creditors for years to come, making the interest the U.S. pays on that debt all the more expensive and a drag on growth.
We won’t dispute the idea that the U.S. defaulting on its debt would be an awful situation. Frankly, it is hard to fathom all the bad that could come because of it, but as one talks/thinks about this notion, it is often addressed as if the default situation won’t be remedied.
Undoubtedly, it will be remedied. It should be remedied before there is a default, but if partisan politics do take us into a default situation, it stands to reason that the reaction in the capital markets will quickly drive an agreement on the debt ceiling.
That’s not to say it wouldn’t be a tough couple of days or weeks, but knowing a worst-case scenario won’t be allowed to fester is why longer-dated Treasury securities could ironically be seen as a safe haven amid any debt default turmoil. That’s how they were viewed in 2011.
We should all hope that we don’t have to endure a U.S. default for any length of time — not even for a second. Alas, if we do, we are reminded by Winston Churchill that “Americans will always do the right thing, only after they have tried everything else.”
—Patrick J. O’Hare, Briefing.com
Where will our markets end this week?
Lower
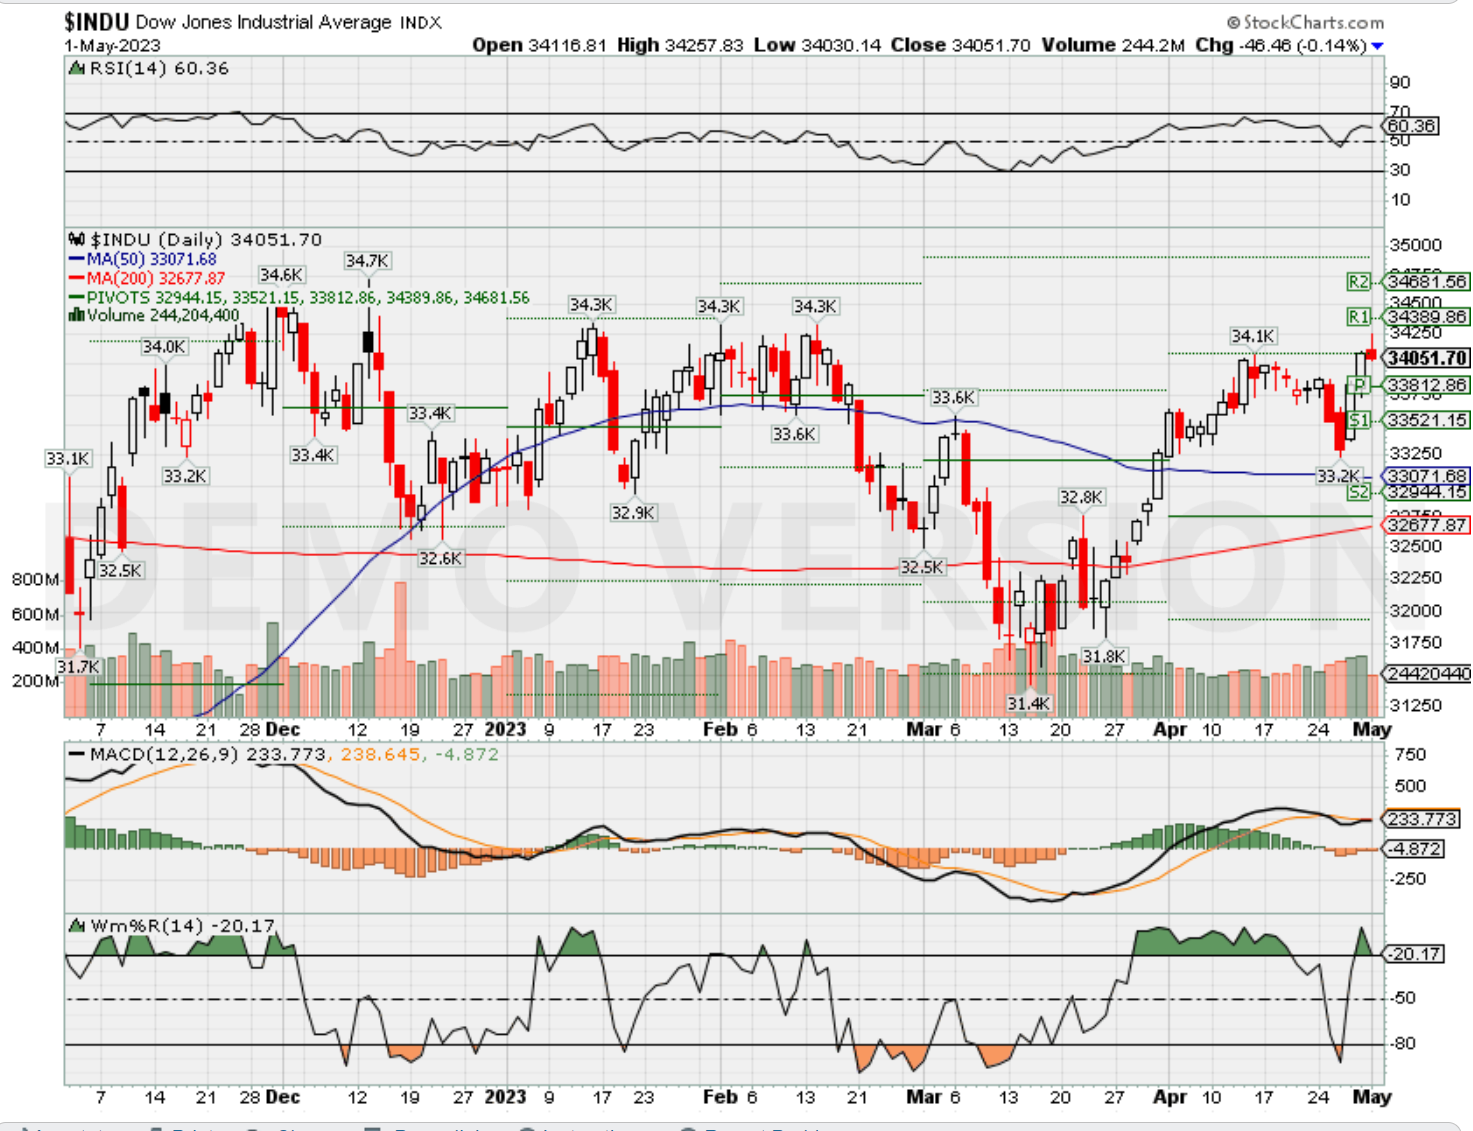
DJIA – Bullish
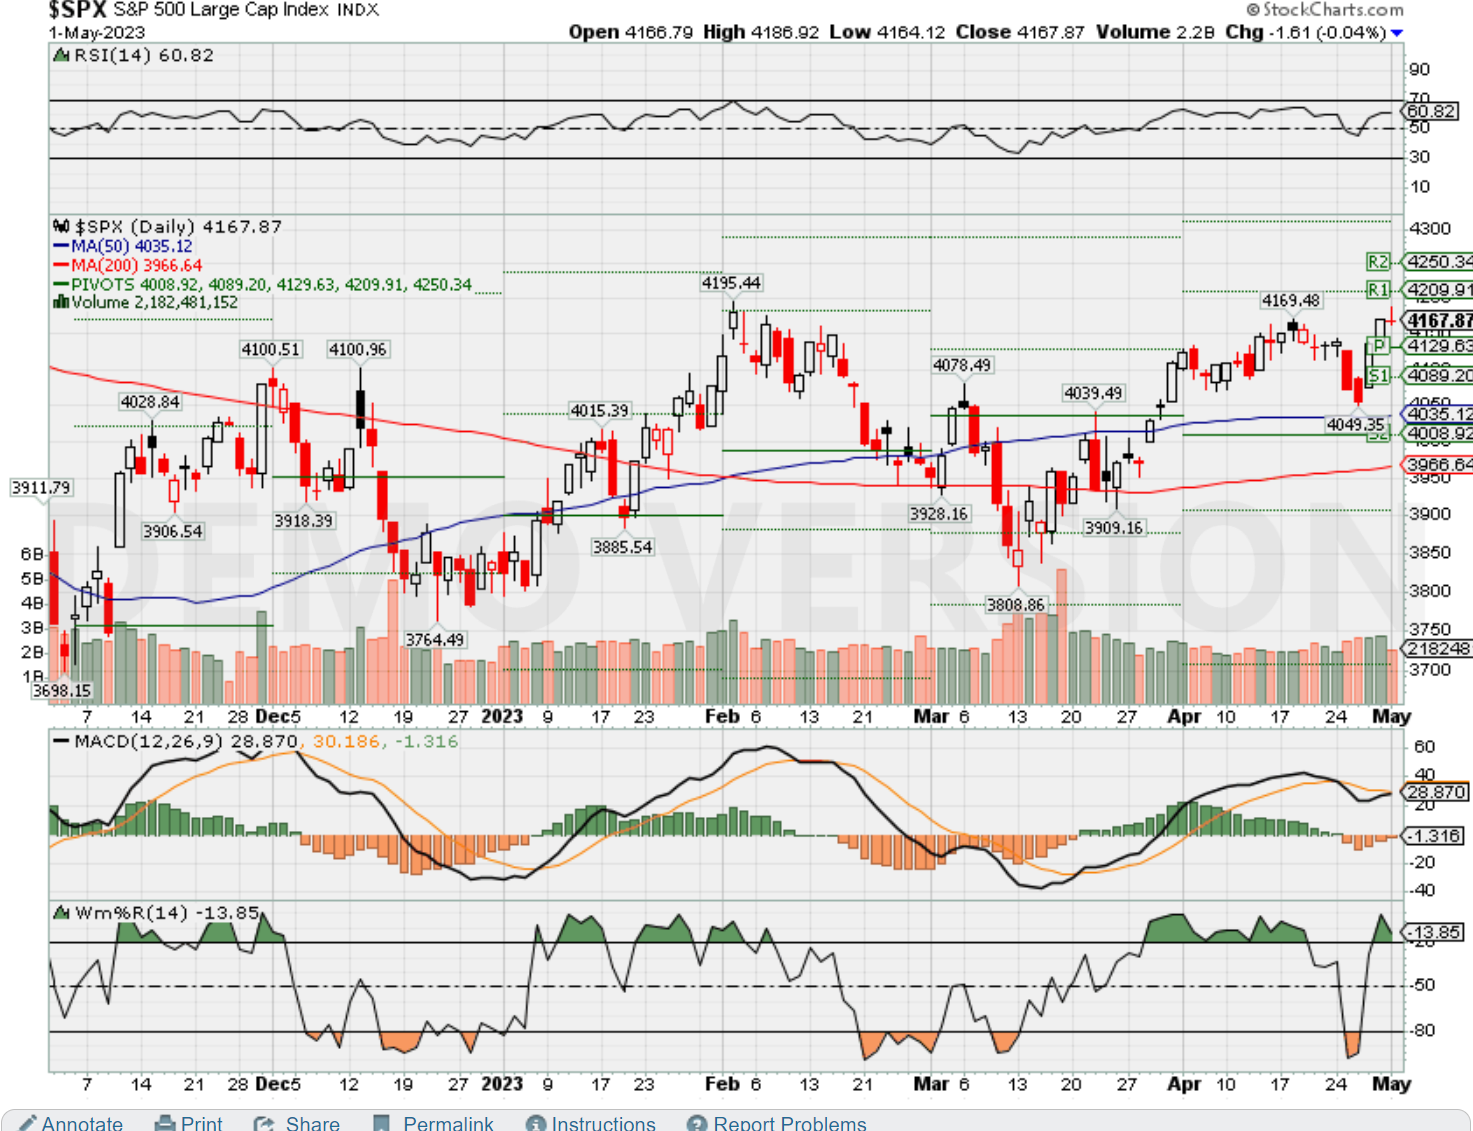
SPX –Bullish
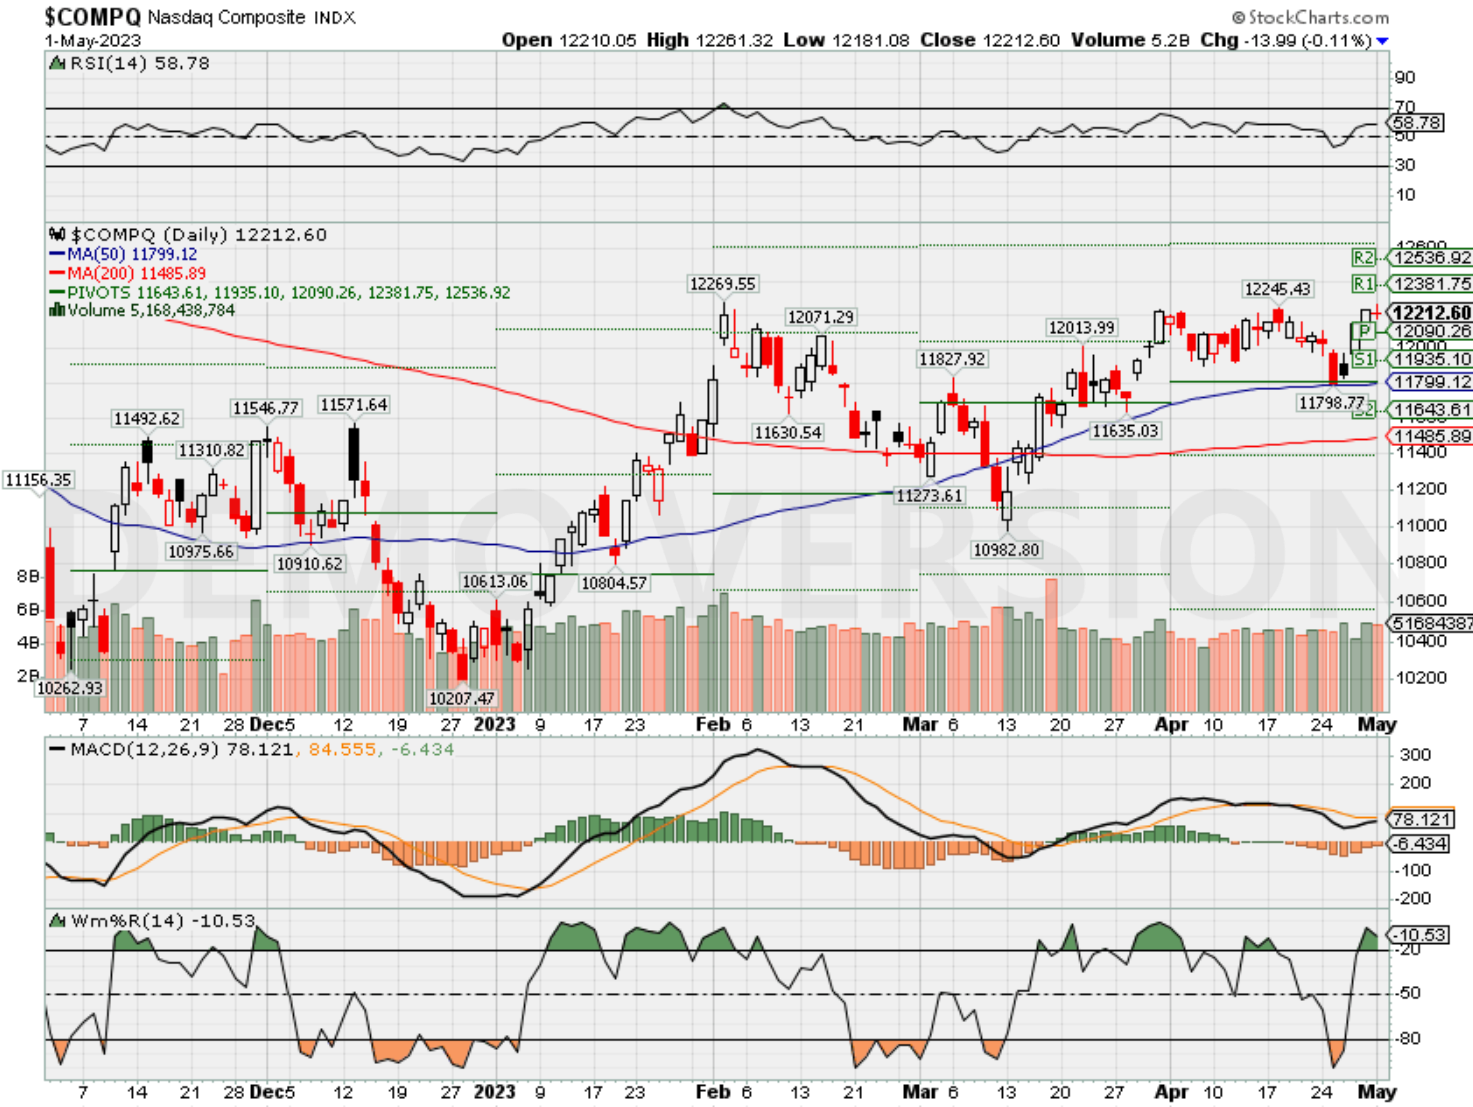
COMP – Bullish
Where Will the SPX end May 2023?
05-01-2023 2.0%
Earnings:
Mon: KBR, FLS, MGM, RMBS, RIG,
Tues: ADT, BP, LNG, CMI, DD, TREE, MAR, TAP, PFE, UBR, AMD, CLX, SBUX,
Wed: GOLD, EL, KHC, MUR, PSX, YUM, HUBS, MRO, VAC, MOS, NUS, QCOM, ZG,
Thur: K, PZZA, PTON, DKNG, DBX, LOCO, LYFT, MNST, YELP, AAPL, SQ
Fri: AMC, CNK, FLR, JCI, GT
Econ Reports:
Mon: Construction Spending, ISM Manufacturing
Tue Factory Orders, Jolts
Wed: MBA, ADP Employment, ISM Services, FOMC Rate Decision
Thur: Initial Claims, Continuing Claims, Unit Labor Costs, Productivity, Trade Balance,
Fri: Average Workweek, Non- Farm Payroll, Private Payroll, Unemployment rate, Hourly Earnings, Consumer Credit
How am I looking to trade?
www.myhurleyinvestment.com = Blogsite
info@hurleyinvestments.com = Email
Questions???
Yes, I am still sold on the Nasdaq = AAPL, META and Financials leading the way this year, BIDU as a China opening play
F should do well in their earnings , to all depends on their guidance and the market understanding of their financial division of the company
Bond ETFs ‘are not a great place to be’ amid market volatility: Expert
May 18, 2022
ETF Think Tank Director of Research Cinthia Murphy joins Yahoo Finance Live to discuss ETF positions against the current market’s volatility, as well as energy commodities and stocks.
Video Transcript
SEANA SMITH: The retail sector and some of those bigger names like Target and Walmart among the worst performers in today’s massive selloff. Again, all three of the major averages in the red right now. The XRT, the retail ETF, that’s off just over 8%. So we want to talk about what all this means here for the ETF space. And for that, we want to bring in Cinthia Murphy, ETF Think Tank director of research. And Cinthia, it’s quite an exciting day to have you on when you’re taking a look at losses of this type of magnitude. But what do you make of the selling action that we’re seeing today?
CINTHIA MURPHY: I mean, it’s always shocking to see this much red all at once. I mean, we keep hoping to turn the corner and get back to the things we like to see, which is green and it just doesn’t happen. I think what we keep seeing in the ETF space is just this dilemma. Is this the bottom? Is this not the bottom?
And at any signal that it could be the bottom, we, all of a sudden, see a resurgence in buying and people looking to maybe talk this market into stop declining. But then, like we saw a little bit yesterday, and then today is just back to things are not actually looking better, and the selling resumed. So it’s been a really tough market to watch everything, for sure.
RACHELLE AKUFFO: But then when you have these kind of drops day after day, these kind of wild swings, what’s the defensive play here in terms of ETF sector action?
CINTHIA MURPHY: You know, what we’re seeing people do primarily is, I mean, there’s not a lot of things that are working. We’ve heard this line throughout 2022, which is, actually, all the hedges are failing. There’s no place to hide, these kinds of really hyperbolic statements. But they’re really reflected the sign of, what do you do? So if you look at just the last week and to the last month, so, you know, last couple of weeks, there’s been a lot of money that, all of a sudden, is going into your short-term bond funds.
That’s, like, the closest you can get to a money-like allocation, but picking up a little bit of yield. It’s that fixed income exposure, which is considered your traditional safe haven, with the minimum amount of duration risk you can possibly get because rates are going up, so bonds are not a great place to be. So within that spectrum, the short dated bonds are picking up a lot of assets. I mean, we see some of these funds pick up, just three of them, BIL, SHV, have picked up, like, $5 billion in a week. So it’s really a space that’s heating up as people look for safety.
We’ve also seen a lot of demand for dividend ETFs because, again, it’s, let’s try to generate some income. Everything else is going down. So let’s find things that bring a little bit of cash to your pocket. So dividend ETFs, especially high dividend yield ETFs, has been really popular this year, and people keep putting money into that space. So it’s been really, like, a little bit of trying to find ways to diversify your risk a little bit and find plays that can help you in that space.
SEANA SMITH: Cinthia, you mentioned the hunt for dividend ETFs. I’m curious what the role you think energy has played in this because energy has been an outperformer. We had oil above $100 a barrel. Is that a significant driver of the interest that we’re seeing there?
CINTHIA MURPHY: Yeah, that is fascinating because from a sector perspective, it has a massive performance this year. And yet, if you look at actual energy ETFs and oil ETFs, you don’t see a lot of money going there. So energy has really been the played out through the high dividend ETFs, which tend to right now have a really high allocation to energy stocks, which are generating really strong dividend yields.
So people have played energy through that vector, and they have played energy more through the value ETF factor, so ETFs that are out there looking for relatively attractive value stocks. So value ETFs have a lot of allocation to energy right now because energy has been beaten down for so many years. So people have really accessed that energy story through your dividends, through value ETFs, more so than directly through oil and energy ETFs. So it has been kind of an interesting indirect play. But for dividend yield, energy is a big component this year because it’s done so well.
RACHELLE AKUFFO: And I want to shift gears and talk about what you’ve seen in terms of the record inflows into ETFs over the last two years. You say that year to date, asset creation in ETFs is now lagging year earlier levels, at about $200 billion year to date versus $350 billion in the same period in 2021. Why is that happening? And when you factor in things like some of these quarterly earnings, what is your outlook?
CINTHIA MURPHY: You know, I think it’s fascinating because throughout all the market turmoil, as we’ve seen, from 2008 on, you always see that ETF investors, more investors, not just ETF investors, have really turned to ETFs to allocate and be tactical because ETFs are so liquid. They’re easy to get in and out. So they’re attractive vehicles to express any kind of market sentiment. What’s been interesting in 2022 is that assets, the pace have really slowed down. So I think it’s just, it just speaks to investors are reluctant to put more money to work in the market.
So it’s not about ETFs as much as it is just by an overall risk aversion at the moment. I’ve been talking to people. More and more people are telling me they’re just starting to park their assets into cash, because they don’t know what to do with this money. And I think we’re starting to see that in the overall ETF flows. They’re slowing down because there really is no great place to put your money to work today, with all this much red across the board.
U.S. GDP rose at a 1.1% pace in the first quarter as signs build that the economy is slowing
PUBLISHED THU, APR 27 20238:30 AM EDTUPDATED THU, APR 27 202310:44 AM EDT
Jeff Cox@JEFF.COX.7528@JEFFCOXCNBCCOM
KEY POINTS
- Gross domestic product rose at a 1.1% annualized pace in the first quarter, below the 2% estimate.
- Slumping inventories and a general decline in private investment held back early year gains.
- Inflation was higher than expected in the quarter, with the PCE price index rising 4.2% against the 3.7% estimate.
Growth in the U.S. slowed considerably during the first three months of the year as interest rate increases and inflation took hold of an economy largely expected to decelerate even further ahead.
Gross domestic product, a measure of all goods and services produced for the period, rose at a 1.1% annualized pace in the first quarter, the Commerce Department reported Thursday. Economists surveyed by Dow Jones had been expecting growth of 2%.
The growth rate followed a fourth quarter in which GDP climbed 2.6%, part of a year that saw a 2.1% increase.
The report also showed that the personal consumption expenditures price index, an inflation measure that the Federal Reserve follows closely, increased 4.2%, ahead of the 3.7% estimate. Stripping out food and energy, core PCE rose 4.9%, compared to the previous increase of 4.4%.
Stocks were solidly higher following the report while Treasury yields spiked.
“People were still spending even despite higher prices, even despite higher inflation and a big drag that we had from inventories,” Citigroup economist Veronica Clark said. “Overall, I think it’s a relatively inflationary report, even though the headline GDP number a bit softer. All of those signs that demand is still strong and prices are still rising were very much present today.”
Like most other Wall Street forecasters, Citi expects the economy eventually to tip into recession, though Clark said the timing is uncertain.
“We would have expected to see some more slowing at this point, though you’re definitely getting signs that you’re on the margin,” she said. “So it doesn’t look like we’re going to be immediately slowing into a recession. And I think this Q1 data definitely helps to confirm that, especially [since] consumption is still so strong.”
The slowdown in growth came due to a decline in private inventory investment and a deceleration in nonresidential fixed investment, the report said. The inventory slowdown took 2.26 percentage points off the headline number.
Consumer spending as measured by personal consumption expenditures increased 3.7% and exports were up 4.8%. Gross private domestic investment tumbled 12.5%.
“The U.S. economy is likely at an inflection point as consumer spending has softened in recent months,” said Jeffrey Roach, chief economist at LPL Financial. “The backward nature of the GDP report is possibly misleading for markets as we know consumers were still spending in January but since March, have pulled back as consumers are getting more pessimistic about the future.”
In other economic news Thursday, jobless claims totaled 230,000 for the week ended April 22, a decline of 16,000 and below the estimate for 249,000.
The GDP report comes as the Federal Reserve is seeking to slow an economy burdened by inflation that had been running at its highest level in more than 40 years.
In a policy tightening regime that began in March 2022, the central bank has raised its benchmark interest rate by 4.75 percentage points, taking it to the highest level in nearly 16 years. Though inflation has pulled back some from its peak around 9% in June 2022, it remains well above the Fed’s 2% goal. Policymakers all say inflation is still too high and will require elevated interest rates.
At the same time, growth has taken a hit from troubles in the banking sector that are likely to infect the economy ahead. Those two issues – the Fed’s rate hiking cycle and an expected credit crunch ahead – are expected to tilt the economy into recession later this year.
Consumers, though, have remained resilient and are expected to use excess savings and purchasing power to make the economic contraction short and shallow. A strong jobs market, with an unemployment rate at 3.5%, also is expected to underpin growth.
Investor warns it’s ‘looking a lot like the tech bubble’ and names 3 cheap stocks to buy outside it
PUBLISHED WED, APR 26 20238:51 PM EDT
The S&P 500 is “supported” by just seven mega-cap tech stocks right now — and it’s starting to look a lot like the 1990s tech bubble, one analyst told CNBC on Wednesday.
“The S&P 500 [is being] supported by a few expensive mega cap techs,” said Eric Lynch, managing director of Scharf Investments.
Seven companies — Apple, Microsoft, Nvidia, Meta, Tesla, Amazon and Alphabet — account for 95% of the S&P 500′s total return in the first quarter, he noted.
“To us this looks a lot like the tech bubble in 1990s when tech gave the world massive outperformance over value, over mid cap small caps, international stocks,” he told CNBC’s “Street Signs Asia.”
“Effectively, once the bubble burst there were all these asset classes that had really attractive valuations.”
Though Lynch said that doesn’t necessarily mean history is going to repeat itself, he added that valuations are — as they were then — a lot more attractive outside of the growth stocks.
“What’s interesting is international stocks are much cheaper,” he said.
Lynch named three stocks he said are cheap right now.
Two of them are Asian stocks: Chinese search engine giant Baidu and Japanese conglomerate Sony.
He said Baidu is “so darn cheap” and will benefit from China’s reopening and the artificial intelligence trend.
“They … already had strong physical search capabilities, the cloud artificial intelligence business, the autonomous driving standard for China, all sorts of research and development that is finally monetizing, and a percentage of the revenues outside of digital search is expanding,” Lynch said.
“So for all those reasons, it’s got some growth metrics.”
Sony is another stock he also said “trades very cheaply.”
Lynch said it’s a good sign that Microsoft offered Sony a 10-year contract to make each new release of Call of Duty available on Sony’s PlayStation console at the same time as the U.S. giant’s Xbox.
“I think investors are really ignoring the tremendous business that’s grown in the last several years on their music publishing assets … They’re making tremendous progress on that,” he said.
Finally, Lynch named American drug distributor McKesson as his third stock pick, saying it’s in the “top one percentile earnings predictability in a recession.”
Visa earnings offer evidence of consumer strength and signals inflation is falling
PUBLISHED WED, APR 26 20239:31 AM EDTUPDATED WED, APR 26 20239:35 AM EDT
With dozens of financial reports on tap each day during this busy earnings week, it’s easy to get lost trying to decide what is worth focusing on and what’s not.
Here’s an easy way to clear your mind: Focus on the health of the consumer.
Visa, which just reported earnings above expectations, is a great window into their behavior.
“We think the consumer is still in good shape,” said Visa CFO Vasant Prabhu on the company’s conference call. “As we said, spending across most categories — other than a couple I mentioned like fuel and some retail goods price cutting — very strong across services, strong across travel and entertainment, strong in nondiscretionary.”
There’s two key drivers for credit cards: Average ticket, or the average amount spent per customer per visit, and transactions, or the number of times the card is used. Put them together, and you have “volume.”
Prabhu noted that volume growth fell in March and through the first three weeks of April. The issue was ticket size. Prabhu said ticket size rose 1% year-over-year in the first quarter, but fell 2% from March 1 to April 21.
Why? Is the consumer suddenly weakening? No.
“Ticket sizes are declining as inflation moderates,” he said.
That is good news for inflation watchers. Gas prices in particular are moderating.
“Starting in March and through the summer, we will be lapping the peaks in fuel prices last year,” Prabhu said. “For example, in March 2023, fuel prices were nearly 20% lower than last year. In 2022, fuel prices continued to rise through spring and peaked in June.”
Another reason ticket prices are lower: Retailers are discounting.
“You have heard various U.S. retailers comment publicly about price cuts they are implementing to clear out inventory or pass on reductions in costs,” he said.
Finally, Prabhu noted that tax refunds were slightly smaller this year. “Refunds are largely spent in the few weeks post receipt,” he said. “We expect this headwind to abate as we get into May.”
Strong consumer. Lower inflation. Retailers discounting. No wonder Visa’s stock is at a 52-week high.
Peter Lynch says his investing strategy still works today, but you have to do your homework
PUBLISHED TUE, APR 25 20238:45 AM EDTUPDATED TUE, APR 25 20238:50 AM EDT
Legendary fund manager Peter Lynch says many investors buying individual stocks today are getting it wrong.
His investment strategy has long been to buy what you know — and look for companies poised to grow. He said he still believes that approach works, but investors must do their homework.
“They are careful when they buy a refrigerator or an airplane flight … but they’ll hear about a stock on a bus and they’ll put $5,000 or $10,000 on it,” Lynch said Tuesday in an interview with CNBC’s “Squawk Box.”
“You really have to be careful,” he said. “Look at the company. Look at the balance sheet. What is the reason the stock should be higher?”
Lynch, 79, managed Fidelity’s Magellan Fund from 1977 to 1990 and is now vice chairman, Fidelity Management & Research. During his time at Magellan Fund, the fund saw annualized return of 29.2% and its assets under management jumped from $20 million to $14 billion.
When looking for the right name, find a company that is going to do well for about the next five years. In addition to those growth stories, look for companies that you expect to turn around. The payoff will come when the bad business improves. As that happens, the stock will rise, he said.
“When companies go from crappy to semi-crappy, the stock goes up. When it goes from semi-crappy to good, they go up. When business gets to be terrific, get out,” Lynch said.
HI Financial Services Mid-Week 06-24-2014