
HI Market View Commentary 04-24-2023
Why do you change what you said you would do in the commentary or Trade findings & Adjustments?
BECAUSE the market is a living, breathing, every changing entity.
What is going on right now in today’s market?
QE from the fed, earnings mixed, layoffs suggest recession,
???? Nobody knows unless you are making something up to get more TV Time
Why are you ALWAYS saying work the numbers? Trust but validate.
Averages are NOT your friend and they don’t EVER equal portfolio growth
The problem with financial plans, insurance that will pay for itself, self funding / infinite banking concepts.
They are based on compounding interest with a fixed average return
I don’t know where the growth is going to come this year?
https://www.sofi.com/learn/content/sp-500-sectors/
What Are the Different S&P 500 Sectors?
By Rebecca Lake · July 11, 2022 · 7 minute read
The S&P sectors represent the different categories that the index uses to sort the companies it follows. S&P refers to Standard & Poor; the S&P 500 index tracks the movements of 500 large-cap US companies. A number of mutual funds and exchange-traded funds (ETFs) use this index as a benchmark.
The Global Industry Classification System (GICS) has 11 stock market sectors in its taxonomy. It further breaks down these 11 sectors into 24 industry groups, 68 industries, and 157 sub-industries.
Understanding how the S&P sectors work and break down further can help both institutional and retail investors manage risk through different economic cycles by allocating their portfolio across multiple sectors. For example, cyclical stocks and cyclical sectors tend to fare well when the economy booms. During a recession, however, defensive stocks may outperform them. However, it’s also possible for all 11 sectors to trend in the same direction.
Examining the 11 Sectors of the S&P
Here’s a look at the S&P Sector list:
- Technology
- Health Care
- Financials
- Real Estate
- Energy
- Materials
- Consumer Discretionary
- Industrials
- Utilities
- Consumer Staples
- Communications
1. Technology
Technology represents the largest S&P sector. This sector includes companies involved in the development, manufacturing, or distribution of tech-related products and services. For example, companies in the technology sector may produce computer software programs or electronics hardware or research and develop of new technologies.
Tech stock investments are typically cyclical, in that they usually perform better in stronger economies. But during the coronavirus pandemic, many tech stocks saw a boost as demand for things like video-conferencing platforms and cloud storage increased as more companies adopted remote work.
The technology sector includes a number of growth stocks, which are companies that reinvest most or all of their profits in expansion versus paying dividends. Examples of the biggest tech stocks include:
2. Health Care
The next largest of the S&P sectors is health care. This sector includes pharmaceutical companies, companies that produce or distribute medical equipment, and supplies and companies that conduct health care-related research.
The health care sector also includes alternative health companies. For example, GW Pharmaceuticals is a drug developer focused on cannabis. The company develops medical marijuana products to treat various health conditions. As such, it’s generally considered part of the health care sector.
Recommended: Cannabis Investing 101
More traditional examples of healthcare sector companies include:
- CVS (CVS)
- Johnson & Johnson (JNJ)
- UnitedHealth Group (UNH)
- Thermo Fisher Scientific (TMO)
- Regeneron (REGN)
Health care stocks are typically non-cyclical, as demand for these products and services usually doesn’t hinge on economic movements.
3. Financials
The financials sector covers a variety of industries, including banking and investing. Banks, credit unions, mortgage companies, wealth management firms, credit card companies and insurance companies are all part of the financial sector.
Financial services companies are usually categorized as cyclical. For example, a credit card issuer’s profit margins may shrink during a recession if unemployment rises and people spend less or can not keep up with credit card payments. But this can be subjective, as mortgage companies may benefit during recessionary periods if lower interest rates spur home-buying activity.
Some of the biggest names in the financial sector include:
4. Real Estate
Real estate is a relatively new addition to the S&P sectors list. This sector includes real estate investment trusts (REITs) as well as realtors, developers and property management companies. REITs invest in income-producing properties and pay 90% of profits out to investors as dividends.
Investing in real estate can be a defensive move as this sector is largely uncorrelated with stocks. So if stock prices fall, for example, investors may not see a correlating drop in real estate investments as property generally tends to appreciate over time.
Examples of real estate companies in the S&P 500 include:
- Digital Realty (DLR)
- American Tower (AMT)
- Prologis (PLD)
- Simon Property Group (SPG)
- Boston Properties (BXP)
5. Energy
The energy sector includes companies that participate in the production and/or distribution of energy. That includes the oil and gas industry as well as companies connected to the development or distribution of renewable energy sources.
Energy stock investments can be more sensitive to economic movements and supply-demand trends compared to other sectors. For example, gas and oil prices declined in 2020 as stay at home orders kept drivers off the roads. Gas prices shot up in 2021, however, following the Colonial Pipeline hack which sparked fears of fuel shortages.
Some of the biggest energy sector companies include:
6. Materials
The materials sector includes companies connected to the sourcing, processing or distribution of raw materials. That includes things like lumber, concrete, glass, and other building materials.
Materials is one of the cyclical S&P sectors, as it can be driven largely by supply and demand. During a housing boom, for example, the materials sector may benefit from increased demand for lumber, plywood and other construction materials.
Material stocks in the S&P 500 include:
- Dupont (DD)
- Celanese (CE)
- Sherwin Williams (SHW)
- Air Products & Chemicals (APD)
- Eastman Chemical (EMN)
7. Consumer Discretionary
The consumer discretionary sector is a largely cyclical sector that includes companies in the hospitality and entertainment sectors, as well as retailers.
Examples of stocks that fit into the consumer discretionary sector are:
Generally, these companies represent things consumers may spend more money on in a thriving economy and cut back on during a downturn. That’s why they’re considered cyclical in nature.
8. Industrials
The industrial sector covers a broad range of industries, including those in the manufacturing and transportation sectors. For example:
Industrials are often considered to be cyclical stocks, again because of how they react to changes in supply and demand. The airline industry, for example, saw a steep decline in 2020 as air travel was curtailed due to the coronavirus pandemic.
9. Utilities
Utilities represent one of the core defensive S&P sectors. This sector includes companies that provide gas, electricity, water, and other utilities to households, businesses, farms, and other entities.
Since these are essentials that people typically can’t do without, they’re generally less sensitive to major shifts in the economic cycle. They also often pay dividends to their investors.
Examples of utilities stocks include:
10. Consumer Staples
Consumer staples stocks represent things consumers regularly spend money on. That includes groceries, household products and personal hygiene products. The consumer staples sector is also a defensive sector because even when the economy hits a rough spot, consumers will continue spending money on these things.
From an investment perspective, consumer staples stocks may not yield the same return profile as other sectors. But they can provide some stability in a portfolio when the market gets shaky.
Companies that are recognized as some of the top consumer staples stocks include:
- General Mills (GIS)
- Coca-Cola (KO)
- Procter & Gamble (PG)
- Conagra Brands (CAG)
- Costco Wholesale (COST)
11. Communications
Last but not least on the list of S&P sectors is communications. This sector spans companies that provide communications services of some kind. That can include landline phone services, cellular phone services, or internet services. Communications also includes companies responsible for producing movies and television shows.
The communications sector can be hard to pin down in terms of whether it’s cyclical or defensive. In a down economy, for example, people may continue to spend money on phone and internet services but cut back on streaming services. So there’s an argument to be made that the communication sector is a little of both.
Companies that belong to this sector include:
- Comcast (CMCSA)
- AT&T (T)
- Dish Network (DISH)
- Discovery Communications (WBD)
- Activision Blizzard (ATVI)
The Takeaway
Knowing what the S&P sectors are and which types of industries or sub-industries they represent can help investors achieve diversification through different types of investments. While some financial experts liken the sectors to a pie, with 11 individual slices, it may be more helpful to think of them as a buffet from which investors can pick and choose. You can either purchase stocks within or across sectors, or look for funds that can provide that diversification for you.
If you’re ready to start building a well-rounded portfolio that includes a sampling of market sectors, it’s easy to open a brokerage account on the SoFi Invest stock trading platform. SoFi Invest offers access to financial planners and educational resources that can help you make informed decisions.
Earnings dates:
AAPL – 5/04 AMC
BA – 4/26 BMO
BIDU – 5/24
CVS – 5/03 BMO
DIS – 5/10 AMC
F – 5/02 AMC
GE – 4/25 BMO
GOOGL – 5/04
KO – 4/24 BMO
LUV – 4/27
SQ – 5/04 AMC
UAA – 5/10
V – 4/25 AMC
VZ – 4/24 AMC
https://www.briefing.com/the-big-picture
The Big Picture
Last Updated: 21-Apr-23 15:36 ET | Archive
Recession is coming, but it will have to wait
The coming week will feature the release of the Advance GDP report for the first quarter. Currently, the Atlanta Fed’s GDP Now model estimate for real GDP growth in the first quarter is 2.5%. That is slightly lower than the 2.6% real GDP growth seen in the fourth quarter but well ahead of the Fed’s longer-run projection for the change in real GDP of 1.8%.
Oh, it is also a long way from a recession, but that makes sense considering that the unemployment rate of 3.5% is at a 54-year low.
The latter point notwithstanding, other indicators, like the inverted yield curve, the Leading Economic Index, a contracting money supply, and faltering manufacturing PMI readings, have led many to conclude that a recession in the U.S. is inevitable.
Cry recession long enough and there will eventually be a recession. The U.S. has had 11 recessions since 1950, according to the National Bureau of Economic Research (NBER). The recession dating by the NBER, however, always happens in hindsight.
What isn’t difficult to predict, though, is that a weak labor market will make for difficult economic times, so a read of the economic future can begin and end there.
A Better Indicator
We are not suggesting the unemployment rate is the be all-end all indicator for predicting a recession. It can’t be. It is a lagging indicator.
Still, it is a signpost that influences perceptions about economic conditions, spending decisions, political decisions, and, ironically, job decisions. If the unemployment rate is rising and/or high, one may be more inclined to stay at one’s current job even if one doesn’t like it for any number of reasons, knowing it could prove difficult to find another job.
The better employment indicator is weekly initial jobless claims. They are timelier, they are published more often, and they offer some insight into where the unemployment rate itself is likely headed.
Therefore, initial jobless claims have been accorded leading indicator status. Given that status, it strikes us that the level of initial jobless claims today (4-wk moving average 239,750) is still well below average levels seen in prior recessions.
| Recession Period | Initial Claims Average | Unemployment Rate Average |
| Jan. 1980 – July 1980 | 512,000 | 7.0 |
| July 1981 – Nov. 1982 | 554,000 | 9.0 |
| July 1990 – March 1991 | 434,000 | 6.1 |
| March 2001 – Nov. 2001 | 416,000 | 4.8 |
| Dec. 2007 – Jan. 2009 | 376,000 | 5.9 |
| Feb. 2020 – April 2020 | 2,405,167 | 7.5 |
Source: NBER; FactSet
Staking a Claim
The COVID recession period was obviously a unique period and one we should all hope is never seen again even though it was the shortest recession on record. Weekly initial jobless claims reached 6.137 million in April 2020 and the unemployment rate spiked to 14.7%, yet it wasn’t long before everything was quickly on the mend in terms of the labor market as fiscal and monetary stimulus efforts took root and COVID vaccines hit the scene.
Prior to that recession, weekly initial jobless claims were running close to 210,000 in January 2020 and the unemployment rate was 3.50%. We have, in a sense, come full circle on both fronts.
Earlier this year, weekly initial jobless claims were just 194,000, and while weekly initial jobless claims have started to trend higher of late, the chart below (which omits the COVID claims spike) shows they are near their lowest level over the last 43 years and certainly still well below average levels seen in every recession since 1980.
The concern in the market is that initial jobless claims are destined to rise further and to keep increasing, partly because of what other indicators are suggesting but mostly because of the Fed’s aim to bring down inflation with higher interest rates aimed at weakening aggregate demand.
The continued strength in the labor market has been a paradoxical source of angst for the Fed, which isn’t necessarily fretting about a wage-price spiral as much as it is fretting about inflation staying persistently high because of a tight supply of labor.
The Fed’s dual mandate is maximum employment and price stability, but with a 3.5% unemployment rate running below the Fed’s longer-run projection of 4.0%, we suspect the Fed feels as if it has overshot on its maximum employment charge, hurting its chances of achieving price stability at its 2.0% target since aggregate demand won’t be tempered quickly with such low unemployment.
The Fed for its part is anticipating that its rate hikes will curtail demand and, in turn, curtail the strength of the labor market as companies adjust to lower demand. That has started to happen, evidenced by the uptick in initial jobless claims and continuing jobless claims reaching their highest level since December 18, 2021.
Nonetheless, initial jobless claims have a lot more ground to cover before they elicit fear of an imminent recession. Those fears are unlikely to resonate until weekly initial jobless claims start printing something in the neighborhood of 350,000 or more on a consistent basis.
What It All Means
The ongoing strength of the labor market is a key reason why the Fed is not discussing any likelihood of cutting rates before the end of the year. In fact, we would argue that it is the basis for why the Fed, which we expect to raise rates again in May, will keep rates higher for longer.
Employed workers are engaged consumers. If there is income coming in from one’s job, there is spending going out from one’s paycheck. With initial jobless claims close to their lowest level in 43 years and the unemployment rate at a 54-year low, consumer spending isn’t going to hit a wall even if it might hit some speed bumps because of inflation and because of the talk about a recession coming.
To be sure, a recession is coming. It is part of the business cycle. When it is coming is open for debate, and what profile it will have — deep or shallow — is going to hinge on labor market trends.
There are other indicators not boding well for the economic outlook, but weekly initial jobless claims — the key indicator — are still running at levels that suggest the recession (and any rate cuts) will have to wait.
—Patrick J. O’Hare, Briefing.com
Where will our markets end this week?
Higher
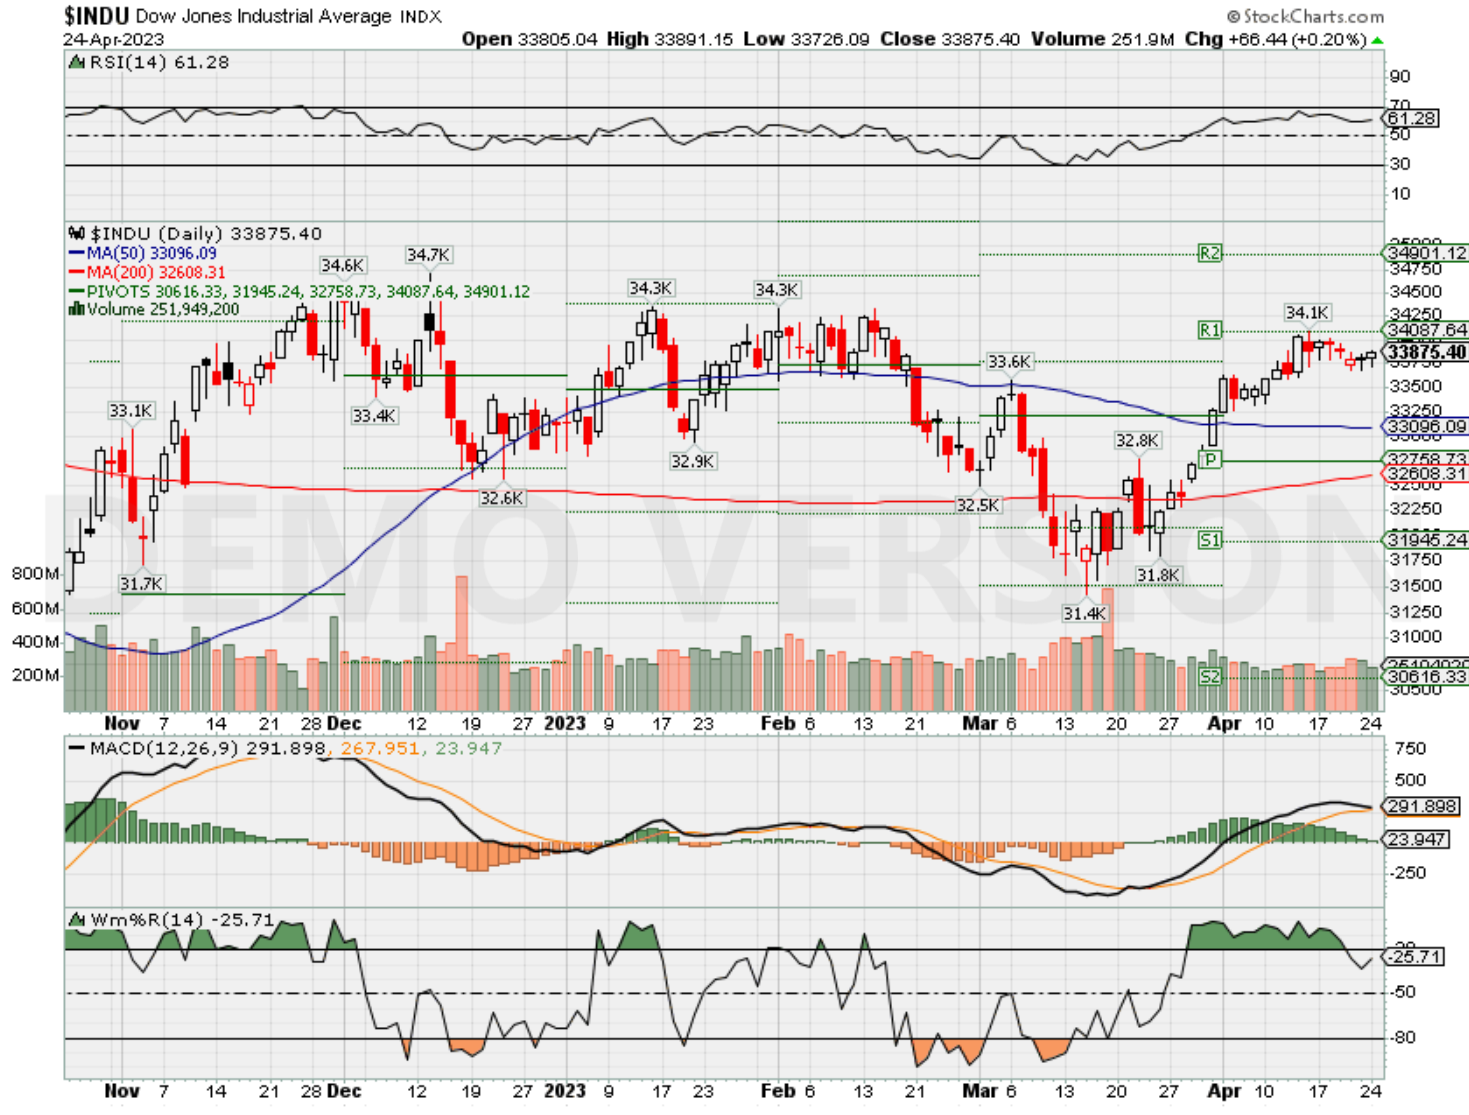
DJIA – Bullish
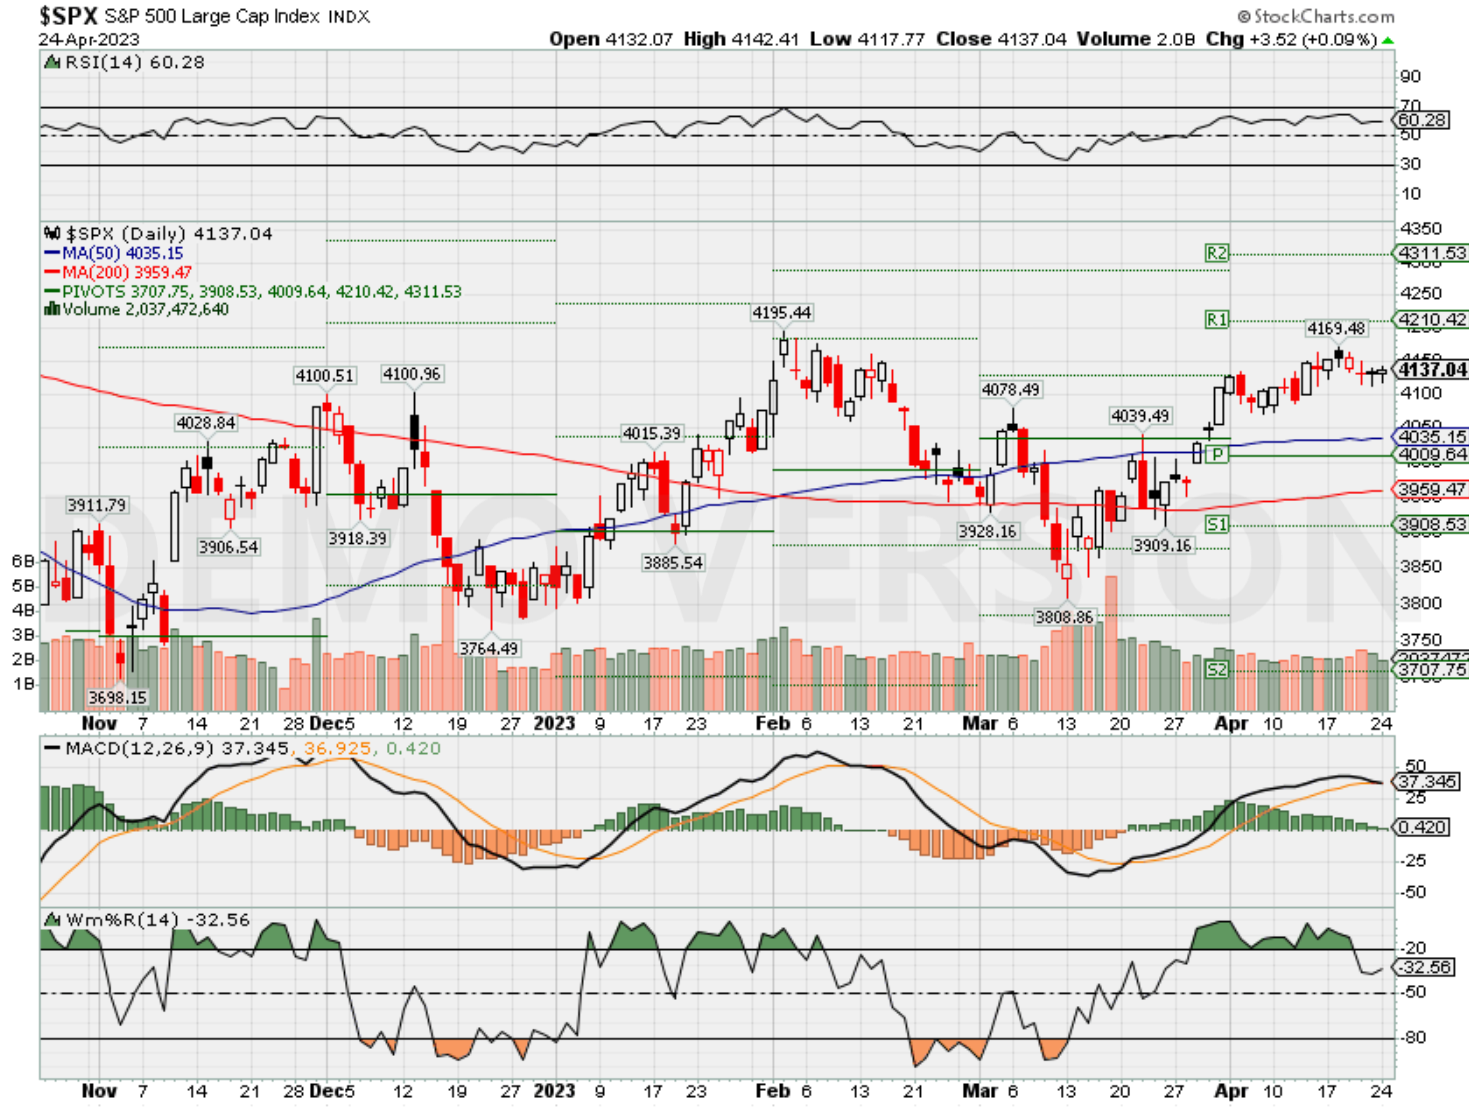
SPX –Bullish
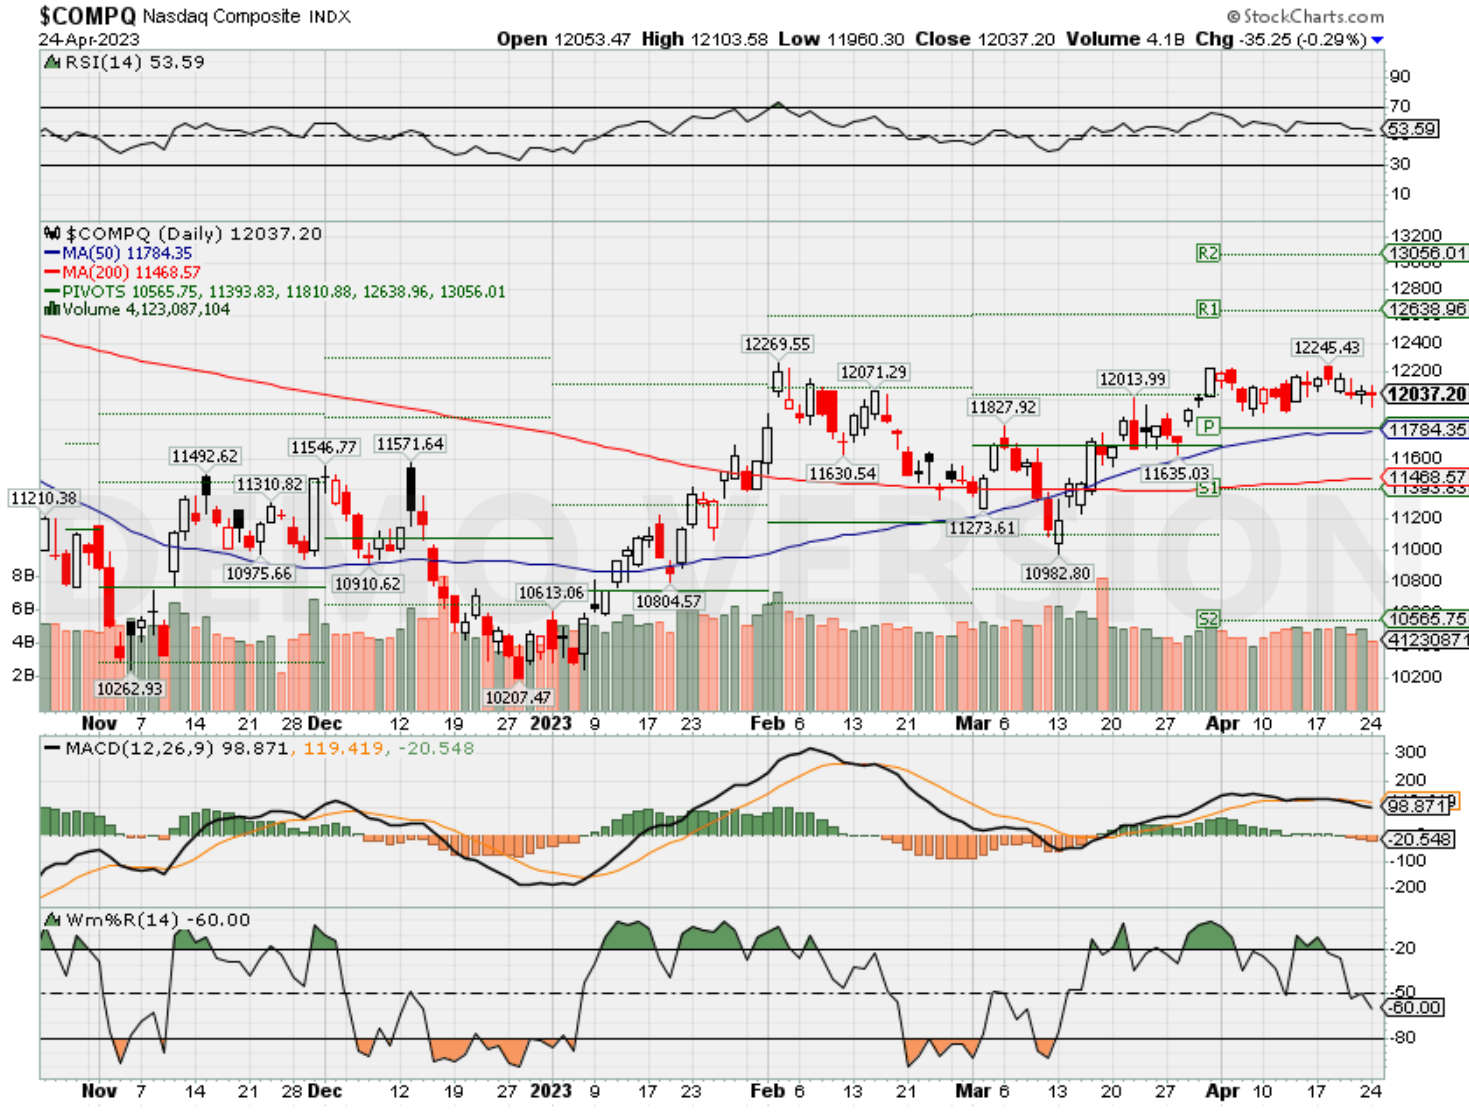
COMP – Bullish
Where Will the SPX end April 2023?
04-24-2023 -2.0%
04-17-2023 -2.0%
04-10-2023 -2.5%
04-03-2023 -2.5%
03-31-2023 -2.0%
Earnings:
Mon: KO, CLF, WHR
Tues: MMM, GLW, GE, GM, HAL, JBLU, KMB, MCD, PEP, PHM, UPS, MSFT, VZ, GOOG, V,
Wed: BSX, CME, GD, HES, HLT, EBAY, MAT, ROKU, WM, BA, META,
Thur: MO, ARCH, BMY, CAT, LLY, HOG, HTZ, HON, MA, LUV, VLO, AVTI, AMZN, FSLR, INTC, TMUS, X
Fri: CL, XOM
Econ Reports:
Mon:
Tue Consumer Confidence, S&P case-Shiller, New Home Sales, FHFA Housing Price Index,
Wed: MBA, Durable Goods, Durable ex-trans
Thur: Initial Claims, Continuing Claims, GDP, Chain Deflator
Fri: Personal Income, Personal Spending, Chicago PMI, PCE Prices, PCE Prices Core, Employment Cost Index, Michigan Sentiment
How am I looking to trade?
www.myhurleyinvestment.com = Blogsite
info@hurleyinvestments.com = Email
Questions???
Is A Rolling Recession Helping The Market?
Last Friday, I was interviewed by Charles Payne on Fox Business, preceded by Liz Ann Sonders from Charles Schwab. I could hear her interview in my earpiece, and she was asked if she was worried about the impending recession, which is widely expected by the financial community. Her answer was quite thought-provoking as she responded (I am paraphrasing):
“We have been discussing the idea of a rolling recession in the economy over the past year, rather than a recession where the bottom falls out of everything at once.“
This idea is important as it aligns with comments we have made previously about the excessively negative sentiment that prevailed in the financial markets. As noted in “No Recession In 2023?”
“But what bothers us with the recession/hard landing view is that everyone thinks the same. As Bob Farrell once said, ‘When all experts agree, something else tends to happen.‘”
With everyone expecting a recession, it wasn’t surprising that we saw extremely “bearish” sentiment in the markets. To wit:
“As a contrarian investor, excesses get built by everyone being on the same side of the trade. Currently, everyone is so bearish that the reflexive trade will be rapid when the shift in sentiment occurs. As Sam Stovall, the investment strategist for Standard & Poor’s, once stated, ‘If everybody’s optimistic, who is left to buy? If everybody’s pessimistic, who’s left to sell?’”
The critical point is that market participants have had a highly bearish view of the economy for over a year. Such has given the markets time to “price in” that view, hence the decline from the January peak. As shown below, each time an event occurred, the market declined, priced in that event, and then rallied.
The importance of the analysis is that, given the spacing out of these events, the market absorbed these small blows. With expectations and positioning extremely bearish, investors had to reposition accordingly when these small blows didn’t turn into a “knockout” punch.
Burning Off Excesses
Looking at a short-term market chart can undoubtedly cause concern. However, a longer-term picture provides some critical context to current market dynamics.
Since 2015, the market has traded in a well-defined bullish trend. Any breakout above or below that channel was quickly resolved. Notably, the market remains well above its 2019 peak. This is why the Fed continues to tighten policy as the “wealth effect” remains well entrenched, supporting inflationary concerns.
In late 2020, the market surged above the bullish trend channel as massive fiscal and monetary interventions fueled enormous speculation.
The reversal of that “speculative greed” to “fear” was expected. As we penned in April 2021:
“There is no way this bull market doesn’t end very badly. We all know that is the reality of this liquidity-fueled market, but we keep investing for “Fear Of Missing Out.”
More importantly, over the past 5-MONTHS, more money has poured into the equity markets than in the last 12-YEARS combined.” – There Is No Way This Bull Market Doesn’t End Badly
The eventual reversal was inevitable as expectations far exceeded the realities of what the market, or the economy, could return. Furthermore, no one considered the inflationary impacts that would come from the massive fiscal and monetary interventions.
The debate, however, is whether the correction from the previous market peak has been completed after successfully retesting and holding the bottom of the long-term trend channel. A look at a weekly chart, and the subsequent confirming buy signals, suggests such may be the case. When the market trades above the 40-week moving average, such tends to remain the case for an extended period. Notably, when the market is more than 10% above its 40-week moving average, that denoted market excesses that eventually reverse.
With the market now trading above the 40-week moving average, despite the bearish headlines and concerns of a recession, such generally suggests a more extended period of higher prices. Such gives credence to this notion of a “rolling recession” that allows the market to absorb negative impacts and continue to “climb a wall of worry.”
Still Potential For Another Correction
Before you think I am getting overly “bullish,” there are plenty of causes for concern.
As discussed last week, yield curves and economic indicators are undoubtedly concerning and suggest an “official” economic recession is likely. The inversion of the Fed Funds rate to the 10-year Treasury is the most inverted since 1986 (roughly 10-months before the 1987 market crash.)
What causes significant market drawdowns, such as we saw in 2008 with the failure of Lehman Brothers, is an exogenous event that unexpectedly impacts the credit markets. So far, credit markets remain exceptionally complacent in terms of risk spreads. While the recent correction from the 2022 peak brought risk spreads up marginally, there is no “concern” of a credit-related event by the markets.
Such gives further credence to the rolling recession scenario, where the economic hits are spread out enough for the credit and financial markets to evaluate, absorb, and “price in” potential event impacts. However, that does not preclude the markets from experiencing recurring 5% to 10% drawdowns as markets continue to adjust for slower economic growth, falling inflation, and weaker earnings.
A correction should be acknowledged and expected. A 10% decline would lead to another retracement to the lows of the bullish trend channel, as noted above. If that support holds, that would be a logical place to add exposure to risk assets from a purely technical perspective.
Whether or not you agree with the idea of a “rolling recession” is up to you. There are certainly plenty of data points that currently argue against such a concept.
As investors, we should consider the possibility that the markets are more resilient to a decline given the massive amount of money supply still sloshing around the financial system.
How will this all work out? I really have no clue.
However, while we remain cautious in our portfolio management process, we need to give the “bullish trend” some acknowledgment considering it continues to hold.
How We Are Trading It
The big challenge for navigating this market is separating the bearish fundamentals from the bullish technicals. As noted, there are plenty of reasons to remain underexposed to equities, given the recession risks, but the bullish technicals suggest otherwise. The only period previously where such an environment existed was during the 1990s, when the markets trended higher during periods of economic weakness, including the 1991 recession and the 1994 bond market crash.
Currently, the bullish technicals suggest higher levels of equity exposure. However, as noted above, the “risk” is an unexpected, exogenous event that causes a sudden shift in sentiment and a spike in the credit markets. Such an event will NOT be the housing market, commercial real estate, or a dollar collapse. These issues are already well recognized by the markets. Even in a rolling recession, the event that creates a downdraft in the market will be something that both financial and credit markets are unaware of. The “surprise” factor always creates a cascade of selling pressure that drops markets sharply.
We must be aware of that potential risk as it most assuredly exists. However, we should be betting that it will occur as it may not. The markets are currently deeply discounting such an event.
Are the markets wrong? Maybe. But they may also be correct. This is the investing challenge that we face in portfolios.
With our buy signals becoming extended, we will likely take profits in our trading positions soon. However, we will continue to maintain exposure to our long-term holdings. We also want to use the recent rise in bond yields to increase our longer-duration bond holdings.
The current market rally has room to move higher. As such, we are looking for opportunities to rebalance exposures and risks accordingly.
- Tighten up stop-loss levels to current support levels for each position.
- Hedge portfolios against significant market declines.
- Take profits in positions that have been big winners.
- Sell laggards and losers.
- Raise cash and rebalance portfolios to target weightings.
Have a great week.
Should investors buy regional bank stocks? A bull and a bear weigh in — and share 3 top picks
PUBLISHED SUN, APR 16 20238:57 PM EDT
U.S. regional banks largely sold off after the collapse of Silicon Valley Bank in March.
Regulators seized its deposits, in what is the largest U.S. bank failure since the global financial crisis.
Although their shares have regained some ground since, after the government said it was ready to provide further guarantee of deposits, the SPDR Regional Banking ETF (KRE) is still down 26% in the year to date.
Should you buy the dip or steer clear of the uncertainty?
A bull and a bear on U.S. regional banks faced off on CNBC’s “Street Signs Asia” on Thursday and shared their stock picks.
‘The worst is behind’
Christopher Marinac, director of research at Janney Montgomery Scott, a financial services firm, said banks are profitable, and he estimates that tangible book value per share this quarter will gain 3% on average despite “all of the noise and worries in March.”
He said the industry still has very good credit quality and reserves are rising.
“The [regional] banks are in very good shape – leverages [are] substantially less today than it was in 2007 and 2008 which positions the banks for a lot less losses than the market realize. So the stocks I think have a chance to bounce and I think the worst is behind,” Marinac told CNBC.
‘Not the environment’ for regional banks
It’s “not the environment” for regional banks right now, said Brian Stutland, portfolio manager at Equity Armor Investments.
He said regional banks rely on a few major economic factors.
First, they need to be able to borrow commercial paper — near or at the U.S. Federal Reserve funds rate — and at the same time lend out to customers at 150 to 200 basis points higher than where they borrowed against deposits.
“That condition is not available,” he said.
“Also, GDP expansion and increasing new business formations with declining unemployment rates are also necessary and that too is in question at the very least as you can see by a flight to safety into the 10 year note,” he said.
A rising 10-year note is another condition — and that’s not present either, Stutland added.
″[The Fed] is expecting a mild recession in the second half of the year. That’s gonna put pressure on the 10-year note, U.S. Treasury to be somewhat suppressed to the downside. I don’t expect it to get back up to 4% by the end of the year. That’s certainly going to hurt regional banks,” Stutland told CNBC.
Deposits, cash levels and growth
The bank crisis in the U.S. has led to only about a 3% decline in deposits in the U.S. system, Marinac said.
He said the decline was less than what investors expected it to be, and although there were “clear” deposit outflows at five banks — SVB, Signature, First Republic, PacWest, and Western Alliance — it was far less for the rest of the industry.
“U.S. deposits are still net 30% higher today than at year-end 2019, pre-pandemic,” he said.
Marinac added that banks have “excellent cash flows” to handle any recession.
However, Stutland argued that the issue of deposits is “levels of risk” when it comes to the regional banks.
“All deposits being protected, I think is a pipe dream,” he told CNBC. “Will we insure depositors beyond what people expect if there’s some failure?”
As for the healthy cash levels that Marinac noted, Stutland asked where growth “is going to come from.”
“Even if the cash reserves hold in there, I’m still worried about things holding up and where’s the growth going to come for these regional banks until the economic macro economic environment improves,” he said.
Stock picks
For investors still keen on regional bank stocks, Marinac said his top two picks are Fifth Third Bancorp and First Citizens. First Citizens announced in late March that it will buy over Silicon Valley Bank’s deposits and loans.
He highlighted “the fact that [regional bank] stocks are down 40% when you’ve had earnings down about 5%. Even though earnings estimates will fall again for 2023 and 2024, as we go through earnings season this month, they’re not going to come down 40%.”
“So overall, I think you have very good value,” Marinac added.
Stutland, for his part, said he would go for bigger banks, preferring JPMorgan to Bank of America.
“We want to be in the bigger bank area, because I think this type of economic environment is going to be favorable for those guys,” he said.
″[I’d] rather own some growth type techie type names as a recovery to this and a push forward in the second half of this year, rather than [own] regional banks and take the risk in that area,” Stutland added.
https://www.cnbc.com/2023/04/24/disney-layoffs-second-larger-wave.html
Disney begins second, larger round of layoffs, bringing total to 4,000 jobs cut
PUBLISHED MON, APR 24 20239:05 AM EDTUPDATED 4 HOURS AGO
KEY POINTS
- Disney is beginning its second round of layoffs Monday. Following this round, 4,000 people will have been laid off from the company.
- A third round is expected to start before the beginning of the summer, Disney officials said.
- Disney plans to reduce its workforce by 7,000 jobs as part of a larger reorganization that will see the company cut $5.5 billion in costs.
Disney began its second, larger wave of layoffs Monday, bringing total job cuts in recent weeks to 4,000 when the latest round is completed.
Earlier this year, Disney said it would slash 7,000 jobs from its workforce as part of a larger reorganization of the company that will see it cut costs by $5.5 billion. The announcement was made during Bob Iger’s first earnings call since returning as CEO.
Disney officials said Monday that they don’t take the departure of so many colleagues lightly. Eliminating 7,000 jobs from its workforce equates to about 3% of the roughly 220,000 people Disney employed as of Oct. 1, according to a securities filing, with roughly 166,000 in the U.S. and about 54,000 internationally.
Disney notified employees of a first wave of layoffs on March 27, which saw cuts in its metaverse strategies unit and part of its Beijing office.
“The senior leadership teams have been working diligently to define our future organization, and our biggest priority has been getting this right, rather than getting it done fast,” reads a note to employees Monday from co-chairmen of Disney Entertainment, Alan Bergman and Dana Walden.
The second round of cuts, which will be completed Thursday, will affect various divisions across the company, including Disney Entertainment and ESPN, as well as Disney Parks, Experiences and Products. The jobs affected will span across the country from Burbank, California, to New York and Connecticut. CNBC reported last week layoffs would soon commence at ESPN.
ESPN is first eliminating off-camera employees in the three rounds of cuts and will do a separate talent evaluation over the summer, which will conclude in additional cuts and non-renewals of contracts, one of said a person familiar with the matter. ESPN is eliminating less than 100 jobs in this round, the person said.
“As we advance as a core segment of Disney, with operational control and financial responsibility, we must further identify ways to be efficient and nimble,” ESPN CEO Jimmy Pitaro wrote in a note to employees obtained by CNBC. “We will act with compassion, respect for our colleagues, and professionalism as we face these hard circumstances.”
Disney said it expects to start its third wave of layoffs before the beginning of the summer in order to reach the 7,000 target. Disney has previously said it doesn’t expect layoffs to affect its hourly workers at its parks and resorts.
Iger said earlier this year Disney’s cost reductions would include cutting $3 billion in content expenses, excluding sports, and the remaining $2.5 billion from noncontent cuts. At that point, Disney executives said about $1 billion in cost-cutting had already been underway since last quarter.
The cost-cutting measures at Disney come as media companies have been pulling back on content spending — and spending in general — as they look to make their streaming businesses profitable. The reorganization was also put into place when Disney was still in the midst of a proxy fight with Nelson Peltz and his firm Trian Management. Soon after the announcement, Peltz called off his proxy war.
Here’s the full memo sent to Disney employees Monday from Bergman and Walden:
Team,
As you all know, a few weeks ago the company began notifying employees whose roles are impacted as part of our overall business realignment and cost-savings efforts. We wanted to share that notifications will continue in many areas of the company over the next several days. In addition, restructuring in various businesses will continue for the next couple of months, and we do anticipate there will be further impacts before the summer, as previously shared. Each team is in a different place in this process, and your leaders will be sharing more context for your group soon.
These are hard decisions and not ones we take lightly – but every decision has been made with considerable thought, and we are doing everything we can to make sure this process is conducted with respect and compassion. The senior leadership teams have been working diligently to define our future organization, and our biggest priority has been getting this right, rather than getting it done fast. We recognize that it has been a period of uncertainty and thank you all for your understanding and patience.
This is a time of transition for Disney, and these changes affect everyone, whether or not your role is impacted. We are committed to supporting you through this period and encourage you to reach out to your leader or HR partner with any questions or for guidance, as needed.
While we are confident that these efforts will better position us for the future, we realize this all takes a toll. We want to acknowledge the impact of this moment and simply reiterate our appreciation for all of you and the passion and dedication you’ve brought to the work we do every day. And for those who will be leaving the company, please know that your contributions are valued and appreciated – you have all played a meaningful role in making Disney what it is today.
With gratitude,
Alan & Dana
https://www.barrons.com/articles/what-to-know-today-547d5190
Apple Expands Financial Services Ambitions. Why It’s Another Blow for Banks.
Apple certainly picked its moment to launch its latest push into financial services.
The tech giant has unveiled a high-yield savings account with an interest rate of 4.15%, in partnership with Goldman Sachs. That rate is more than 10 times the national average, Apple says.
As well as being a sign of Apple’s ambitions, it’s another threat to banks.
Earnings from State Street and Charles Schwab Monday were a reminder, if one were needed, that banks are struggling to keep hold of their customers’ cash—both reported a fall in deposits in the first quarter.
Savers were already moving their dollars into higher-yielding money-market funds, as the Federal Reserve’s aggressive interest-rate hiking has played out over the past year or so. But the recent banking turmoil has only accelerated deposit outflows at regional banks.
Apple, a trusted brand with a huge customer base when it comes to iPhones, adds to the competition and gives consumers another option for where to put their cash. It will also put pressure on the big banks currently offering low rates.
For the company itself, it appears to be a shrewd and well-timed move. It comes after last month’s launch of Apple Pay Later, which allows consumers to split purchases into four payments over six weeks.
Apple is serious about becoming a major player in financial services, and it could shake up the entire sector.
Here’s how much money you’d have if you invested $1,000 in the S&P 500 a decade ago
Published Fri, Apr 21 20233:03 PM EDTUpdated Fri, Apr 21 20233:21 PM EDT
During the Berkshire Hathaway annual meeting in 2020, billionaire and legendary investor Warren Buffett told the audience, “in my view, for most people, the best thing to do is own the S&P 500 index fund.”
It’s a sentiment Buffett has stood by and repeated because he believes it’s a way for investors to help mitigate the risks that come with choosing individual stocks.
“The trick is not to pick the right company. The trick is to essentially buy all the big companies through the S&P 500 and to do it consistently and to do it in a very, very low-cost way,” he told CNBC in 2017.
The S&P 500 is a market index that tracks the stock performance of around 500 large-company U.S. stocks, including Amazon, Google parent company Alphabet, Meta and Visa.
While the index is not immune to overall market downturns, long-term investors have historically earned a nearly 10% average annual return. However, as with all investments, it’s important to note that past performance can’t be used to predict future results.
Here’s how much you’d have now if you’d invested $1,000 in the S&P 500 about one, five and 10 years ago:
If you had invested $1,000 into the S&P 500 about a year ago, your investment would be worth about $942 as of April 20, according to CNBC’s calculations.
Had you invested $1,000 into the S&P 500 about five years ago, your investment would have grown to about $1,689 as of April 20, according to CNBC’s calculations.
And if you had put $1,000 into the S&P 500 about a decade ago, the amount would have more than tripled to $3,217 as of April 20, according to CNBC’s calculations.
Why index funds can be a smart investment
While you can’t directly invest in the index itself, choosing to buy an S&P 500 index mutual fund or exchange-traded fund (ETF) gives you exposure to the index’s underlying stocks.
Financial experts generally consider these types of funds less risky than owning individual shares. By spreading your bets across some 500 companies, you lower the chances that a drawdown in any one particular stock would hurt your portfolio’s performance.
Additionally, because index funds are considered passive strategies, they tend to be low-cost investments. Index funds merely track a benchmark’s performance and therefore don’t employ a manager to run the fund, as is the case with “active” strategies.
As a result, the average passive fund charges an annual fee of 0.12%, compared with a 0.60% average fee among active funds, according to the latest data from Morningstar.
How compounding can help you build wealth
When it comes to investing, the sooner you start, the better. That’s because of compound interest, which can help your money grow.
Here’s how it works: After you make an initial investment, you theoretically earn a return on that principal amount. As interest is added to your balance, you begin to earn interest on that amount as well.
Say you invest $1,000 and earn an annualized return of 4%. A year later, your investment would have grown to $1,040 which is your original $1,000 investment plus four percent.
In year two, you’d earn 4% on the entire total, not just the principal balance of $1,000. By the end of the year, you’d have $1,081.60. In year three, you’d then earn 4% on $1,081.60, and so on.
You can use CNBC Make It’s compound interest calculator to see how it can help your money grow based on your initial deposit, your monthly or annual contributions, interest rate and time horizon.
https://www.macrotrends.net/2526/sp-500-historical-annual-returns
| 2022 | 4,097.49 | 4,796.56 | 4,796.56 | 3,577.03 | 3,839.50 | -19.44% | |||||
| 2021 | 4,273.41 | 3,700.65 | 4,793.06 | 3,700.65 | 4,766.18 | 26.89% | |||||
| 2020 | 3,217.86 | 3,257.85 | 3,756.07 | 2,237.40 | 3,756.07 | 16.26% | |||||
| 2019 | 2,913.36 | 2,510.03 | 3,240.02 | 2,447.89 | 3,230.78 | 28.88% | |||||
| 2018 | 2,746.21 | 2,695.81 | 2,930.75 | 2,351.10 | 2,506.85 | -6.24% | |||||
| 2017 | 2,449.08 | 2,257.83 | 2,690.16 | 2,257.83 | 2,673.61 | 19.42% | |||||
| 2016 | 2,094.65 | 2,012.66 | 2,271.72 | 1,829.08 | 2,238.83 | 9.54% | |||||
| 2015 | 2,061.07 | 2,058.20 | 2,130.82 | 1,867.61 | 2,043.94 | -0.73% | |||||
| 2014 | 1,931.38 | 1,831.98 | 2,090.57 | 1,741.89 | 2,058.90 | 11.39% | |||||
| 2013 | 1,643.80 | 1,462.42 | 1,848.36 | 1,457.15 | 1,848.36 | 29.60% | |||||
| MY NUMBERS | |||||||||||
| 2022 | 4,097.49 | 4,796.56 | 4,796.56 | 3,577.03 | 3,839.50 | -19.44% | $ 2,692.15 | ||||
| 2021 | 4,273.41 | 3,700.65 | 4,793.06 | 3,700.65 | 4,766.18 | 26.89% | $ 3,341.80 | ||||
| 2020 | 3,217.86 | 3,257.85 | 3,756.07 | 2,237.40 | 3,756.07 | 16.26% | $ 2,633.62 | ||||
| 2019 | 2,913.36 | 2,510.03 | 3,240.02 | 2,447.89 | 3,230.78 | 28.88% | $ 2,265.28 | ||||
| 2018 | 2,746.21 | 2,695.81 | 2,930.75 | 2,351.10 | 2,506.85 | -6.24% | $ 1,757.67 | ||||
| 2017 | 2,449.08 | 2,257.83 | 2,690.16 | 2,257.83 | 2,673.61 | 19.42% | $ 1,874.64 | ||||
| 2016 | 2,094.65 | 2,012.66 | 2,271.72 | 1,829.08 | 2,238.83 | 9.54% | $ 1,569.79 | ||||
| 2015 | 2,061.07 | 2,058.20 | 2,130.82 | 1,867.61 | 2,043.94 | -0.73% | $ 1,433.08 | ||||
| 2014 | 1,931.38 | 1,831.98 | 2,090.57 | 1,741.89 | 2,058.90 | 11.39% | $ 1,443.61 | ||||
| 2013 | 1,643.80 | 1,462.42 | 1,848.36 | 1,457.15 | 1,848.36 | 29.60% | $ 1,296.00 | ||||
| $ 1,000.00 | |||||||||||