
HI Market View Commentary 01-09-2023
What is the HI Market View Commentary?= 10-15 Minutes education, 10-15 stock market review for the week, 10-15 of others information , then questions
I AM SO GLAD WE ARE DONE WITH 2023 !!!!!!!!!!!!!!
Thanks only because we didn’t hit the trough of our market most likely= We haven’t hit the low in the cycle
Why haven’t we hit the low in the cycle= Inflation, rising interest rates, low unemployment,
You can’t wait until life isn’t hard anymore before you decide to be happy!!!
Five key questions that need to be answered for us to know if this market will stage a real rebound to start 2023—or test the lows!
Those questions were:
- Where do 2023 S&P 500 earnings estimates settle?
- When do global bond yields peak?
- When does Core CPI fall below 5.0% y/y?
- When does the unemployment rate rise above 4.0%?
- When does 10s-2s bottom?
OUR RECESSION sits on the couch right now – The workers that could work and choose not to is the highest in history
OUR RECESSION is linked to the mortgage rate shock of those who haven’t know double digit mortgage rates
OUR RECESSION is linked to the reopening in China
SO, That’s why we collar trade. We look for the happiness in making up “SOME” of the downside movement and add shares without asking for more money. Two things that no other money managers do for their clients
SO why don’t you just get out and wait for the bottom, or get out on bad days and back in the next week, or time the market
THIS IS why we were up 4.52 last week on a S&P 500 +1.45
Artificial Intelligence (AI) only gathers/calculates the numbers quicker IT DOES NOT predict the future or give you some advantage on stock picking or making money in the stock market. We aren’t at double digit mortgage rates, huge/bigger deficit spending, much more globalized, much higher oil prices, more technology, more information, less nationalism, wars, education, no fracking
There are so many different variables that AI will never predict the future accurately
WHAT is the biggest fault of AI is that exits or closes a position because it has zero BIAS for the future
Last week I got a Webinar invitation : Reminder: Webinar on Concentrated Stock Positions
Is a recession inevitable in the coming new year? Experts deliver 2023 predictions.
January 02, 2023
Like Blaze News? Get the news that matters most delivered directly to your inbox.
Heading into the new year, numerous notable economic experts and financial institutions delivered dire predictions of a recession in 2023.
What is a recession?
In July, the U.S. economy contracted for a second straight quarter – which signals that the country was in a technical recession.
The real gross domestic product (GDP) – the inflation-adjusted value of goods and services for sale produced by an economy – decreased by 0.9% in the second quarter of 2022, the Bureau of Economic Analysis (BEA) declared in July.
Investopedia defines a recession as a “significant, widespread, and prolonged downturn in economic activity. Because recessions often last six months or more, one popular rule of thumb is that two consecutive quarters of decline in a country’s Gross Domestic Product (GDP) constitute a recession.”
Disputes over the definition of a recession
U.S. Treasury Secretary Janet Yellen refuted the notion that the nation is in a recession.
President Joe Biden claimed that the United States’ economic situation “doesn’t sound like a recession.” President Biden declared that a recession “hadn’t happened yet.” He said he didn’t think there would be a recession, and added that there could be a “very slight recession.” Biden proclaimed that Americans don’t need to prepare for a recession.
Experts deliver predictions on a recession in 2023
However, many economic experts and business leaders are warning that a recession will happen next year. The 2023 recession could be brought on by inflation, interest rate hikes, and supply chain issues.
In October, JP Morgan CEO Jamie Dimon warned of a “hard” U.S. recession that begins within the first six months of 2023. In December, Dimon stated, “Inflation is eroding everything.”
Nouriel “Dr. Doom” Roubini – who predicted the 2008 U.S. housing bust – gave a troubling economic forecast for 2023.
“In a short and shallow recession, typically, from peak to trough, the S&P 500 falls by 30%,” Roubini told Bloomberg. “So even if we have a mild recession…you’ll have another 15% leg down.”
“If we have something more severe than a short and shallow recession, but not as severe as the GFC…you have another 25% downside potentially,” said Roubini – a professor emeritus at New York University’s Stern School of Business.
Billionaire investor Carl Icahn said in September, “The worst is yet to come.”
“We printed up too much money, and just thought the party would never end,” Icahn explained. “Inflation is a terrible thing. You can’t cure it.”
Kay Daniel Neufeld – director and head of forecasting at the Center for Economics and Business Research – said this week, “It is likely that the world economy will face a recession next year as a result of the rises in interest rates in response to higher inflation.”
Citi Global Wealth Investments forecasts the U.S. will suffer a “mild” recession in 2023 – which will include 2 million job losses that will push unemployment to 5%.
“We believe that the Fed’s rate hikes and shrinking bond portfolio have been stringent enough to cause an economic contraction within 2023,” the economists declared in the 2023 outlook report. “And if the Fed does not pause rate hikes until it sees the contraction, a deeper recession may ensue.”
KPMG – the fourth-largest accounting firm in the world – released a report that surveyed top executives in October that revealed, “While confidence is up over the next three years, CEOs anticipate challenges in the shorter term. Nearly nine out of 10 (86 percent) CEOs believe a recession will happen over the next 12 months, but three out of five (58 percent) feel it will be mild and short and 76 percent have plans in place to deal with it.”
“Seventy-three percent of CEOs believe a recession will upend anticipated growth over the next 3 years, and three-quarters (75 percent) also believe a recession will make post-pandemic recovery harder,” the report said.
A recent Bloomberg poll of 38 economists found, “Economists say there is a 7-in-10 likelihood that the U.S. economy will sink into a recession next year, slashing demand forecasts and trimming inflation projections in the wake of massive interest-rate hikes by the Federal Reserve.”‘
A global recession could be imminent
In September, the World Bank warned, “As central banks across the world simultaneously hike interest rates in response to inflation, the world may be edging toward a global recession in 2023 and a string of financial crises in emerging market and developing economies that would do them lasting harm.”
In October, the International Monetary Fund (IMF) predicted that global growth would slow to 2.7% in 2023.
“More than a third of the global economy will contract this year or next, while the three largest economies — the United States, the European Union, and China — will continue to stall,” the report warned. “In short, the worst is yet to come, and for many people 2023 will feel like a recession.”
Earnings dates:
AAPL – 1/26 AMC
BA – 1/25 BMO
BAC – 1/13 BM0
BIDU – 3/01
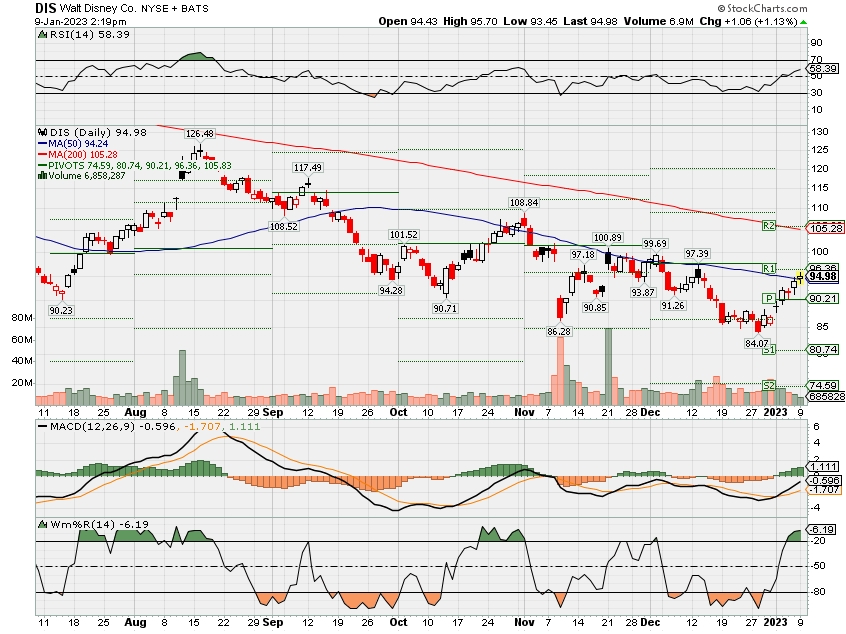
DIS – 2/08 AMC
F – 2/02 AMC
GOOGL – 1/31
JPM – 1/13 BMO
LMT – 1/24 BMO
META – 2/01
MU – 3/29
SQ – 2/23 AMC
UAA – 2/02
USB – 1/25 BMO
V – 1/26
VZ – 1/24 BMO
https://www.briefing.com/the-big-picture
The Big Picture
Last Updated: 06-Jan-23 14:50 ET | Archive
The market is fighting the Fed
Apparently, no one at the December 13-14 Federal Open Market Committee (FOMC) meeting thought it would be appropriate to begin reducing the federal funds rate target in 2023. That is a lot of “no ones” considering there were 19 forecasts provided at that meeting.
Call the market an interested observer of that meeting, the minutes from which were released this past week. You can also call the market an interested doubter of all those no ones.
Hold the Rate Cut
According to the CME FedWatch Tool, there will most likely be a rate cut by the end of the year. We would venture to say that the market also doesn’t believe the Fed’s terminal rate will go beyond a target range of 5.00-5.25%. The prevailing view at the moment is that the peak will be in the 4.75-5.00% range.
Notably, we heard Kansas City Fed President George (non-FOMC voter) say this week that she sees rates reaching 5.00% and staying there “well into 2024.” Atlanta Fed President Bostic (non-FOMC voter) said he has 5.00-5.25% for his projection and holding there “well into 2024.”
St. Louis Fed President Bullard (non-FOMC voter) acknowledged that, “While the policy rate is not yet in a zone that may be considered sufficiently restrictive, it is getting closer.” Note: he didn’t say anything about a possible rate cut in 2023.
And then there was Minneapolis Fed President Kashkari. He is a 2023 FOMC voter, so that distinction alone gives his viewpoint some added weight in the policy outlook. He said that he sees the Fed pausing its rate hikes at 5.40% before cautioning that rates could be taken potentially much higher from wherever the Fed pauses if there is slow progress in lowering inflation after the Fed pauses.
None of these no ones gave the market any reason to think that a pivot to a rate-cut cycle is going to happen anytime soon. The market, seemingly bothered at times by their stubbornness, didn’t give up its own fight to prove these no ones wrong.
We know this looking at the behavior of the Treasury market throughout the week and particularly on Friday following the release of the December Employment Situation Report and the December ISM Non-Manufacturing Index.
A Step in the Pause Direction?
Briefly, the December jobs report was not weak. It just wasn’t as strong as feared. The focal point in that respect was average hourly earnings, which decelerated to 4.6% year-over-year from a downwardly revised 4.8% in November.
The market responded favorably to this deceleration because it knows the Fed is worried about wage inflation keeping aggregate inflation persistently high. Therefore, the downshift in average hourly earnings growth from November was seen as a step in the right direction for tempering the Fed’s hawkish mindset.
The December ISM Non-Manufacturing Index, released 90 minutes after the jobs report, solidified that thinking as it registered the first contraction reading (49.6%) since May 2020. The dividing line between expansion and contraction is 50.0%.
The 2-yr note yield, sitting at 4.48% in front of the release of the December employment report, fell to 4.40% in its wake, but subsequently dropped as low as 4.25% after the ISM Non-Manufacturing Index. The 10-yr note yield, meanwhile, stair-stepped from 3.74% to 3.68% to 3.56%.
That rally — and the one that ensued in the stock market — was catalyzed by the thinking that the Fed won’t be able to take the target range for the fed funds rate much higher before it decides to hit the pause button.
A pause is still a long way from a rate cut, yet a pause beats another rate hike any day for a market that got broadsided in 2022 by a series of aggressive rate hikes.
What It All Means
In effect, what we have is a market that is intent on fighting the Fed even though it has been trained not to fight the Fed. At this juncture, though, the market feels like it has a fight worth fighting because the Fed sucker punched everyone with its prior view that inflation would be transitory.
The market wanted the Fed to start fighting inflation sooner, but all it did was shadow box. Now, the Fed is in the fight, and it is hammering home rate hikes left and right to try to bring inflation back down to its 2.0% target, showing little regard it seems for the long and variable lags of its prior punches.
Hence, when the non-manufacturing sector, which accounts for the largest swath of U.S. economic activity, falls into a state of contraction, it puts the market in a fighting mood, counter punching the Fed with trades that imply the Fed is on course to make a policy mistake.
The market is fighting in a way that it hopes convinces the Fed to go to a neutral corner soon. That is the connection from the inverted yield curve and the steep drop in the 2-yr note yield in particular following the December Employment Report and December ISM Non-Manufacturing Index.
Perhaps the Fed will respect the fight in the market. Then again, the minutes from the last FOMC meeting carried this observation:
“Participants noted that, because monetary policy worked importantly through financial markets, an unwarranted easing in financial conditions, especially if driven by a misperception by the public of the Committee’s reaction function, would complicate the Committee’s effort to restore price stability.”
The market definitely has a fight on its hands to begin 2023 and the Fed does, too. The latter is fighting inflation and the former is fighting the Fed to stand down soon, fearing that economic conditions are going to deteriorate sharply in coming months.
The reaction function in the market, then, will be acute around every major economic release, because each release will be interpreted in terms of what it means for the path of monetary policy. That should translate into a lot of roller-coaster action for a market that knows it typically doesn’t pay to fight the Fed but isn’t going to go down without a fight when it fears a policy mistake is in the making.
—Patrick J. O’Hare, Briefing.com
https://go.ycharts.com/weekly-pulse
| Market Recap |
| WEEK OF JAN. 2 THROUGH JAN. 6, 2023 |
| The S&P 500 index rose 1.45% last week as investors’ worries about rate increases eased amid data showing US job and hourly earnings growth slowed in December.
The S&P 500 ended the first week of 2023 at 3,895.08, up from last week’s closing price of 3,839.50. As of Thursday’s market close, the index was below last Friday’s close, but a 2.3% Friday increase on the December jobs data sent the S&P 500 into positive territory for the week. The market benchmark slid more than 19% in 2022 when climbing inflation prompted the Federal Reserve’s Federal Open Market Committee to raise its benchmark lending rate seven times. Fearing a recession, investors have been hoping the rate increases would slow and eventually lead to rates being reduced, yet the FOMC raised its median rate outlook at its final meeting of 2022. Earlier last week, minutes released from the December FOMC meeting dashed hopes of a reduction in the Federal Reserve’s key lending rate this year. The minutes said the committee’s participants indicated last month that they expected higher interest rates to remain in place for “some time.” In addition, “no participants anticipated that it would be appropriate to begin reducing the federal funds rate target in 2023,” the minutes said. However, investors’ rate worries eased on Friday as the Labor Department’s report of December nonfarm payrolls showed an increase of 223,000, the smallest addition since December 2020, compared with a downwardly revised increase of 256,000 in November. Average hourly earnings growth also slowed. Investors are hoping signs of a slowing labor market may keep Fed officials from raising rates by as much as they otherwise would. Communication services had the largest percentage increase last week, up 3.7%, followed by a 3.5% increase in materials and a 3.3% rise in financials. Healthcare was the only sector in the red, slipping 0.2%. The gainers in communication services included Warner Bros. Discovery (WBD), which said it signed an audience measurement agreement with advertising measurement firm VideoAmp as the media and entertainment company seeks to better represent its audiences for advertisers. Shares rose 19%. In the materials sector, shares of Celanese (CE) rose 14% last week as RBC Capital Markets upgraded its investment rating on the stock to outperform from sector perform. The firm also raised its price target on Celanese’s shares to $125 each from $98. The financial sector’s gainers included shares of MarketAxess Holdings (MKTX), which climbed 13%, as the operator of bond trading platforms reported a year-over-year increase in total average daily volume for December. The healthcare sector’s decliners included shares of Cigna (CI), which received an investment rating downgrade from Wells Fargo to equal weight from overweight. Shares of Cigna fell 8.7%. Economic data in focus next week will include the consumer price index for December, expected to be released on Thursday. Other reports due next week include inflation expectations from the New York Fed on Monday and the import price index for December on Friday. Provided by MT Newswires |
Where will our markets end this week?
Higher
DJIA – Bullish
SPX –Bullish
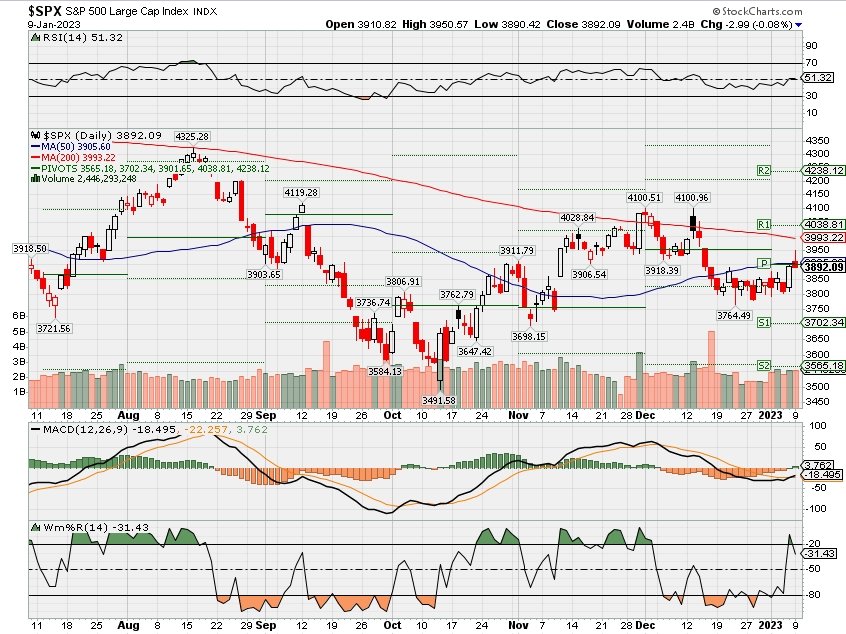
COMP –bearish again
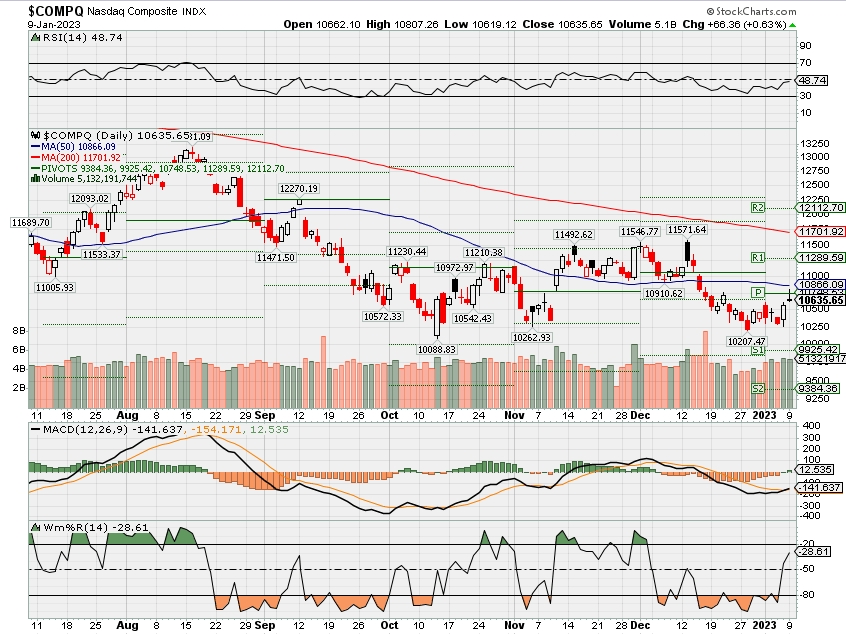
Where Will the SPX end January 2023?
01-09-2023 -4.0%
Earnings:
Mon:
Tues: BBBY
Wed: KBH
Thur:
Fri: JPM, BAC, BLK, C, DAL, UNH, WFC, BK
Econ Reports:
Mon: Consumer Credit
Tue Wholesale Inventories, NFIB Small Business Index
Wed: MBA,
Thur: Initial Claims, Continuing Claims, CPI, Core CPI, Treasury Budget
Fri: Import, Export, Michigan Sentiment
How am I looking to trade?
Currently running mostly stocks without protection but getting ready for earning by protective puts and full collar trades
www.myhurleyinvestment.com = Blogsite
info@hurleyinvestments.com = Email
Questions???
The Dow’s yearly performance is beating the S&P 500 by the most in decades. Here’s why
PUBLISHED WED, DEC 21 20221:13 PM ESTUPDATED 3 HOURS AGO
The Dow Jones Industrial Average is about to end the year in the red alongside the other two major stock indexes, but here is a silver lining: The 30-stock index is outperforming the S&P 500 by the largest margin in decades.
The Dow is the best performer of the three major indexes this year, even though all three are well on pace to end 2022 with losses. On a total-return basis, the Dow is down nearly 8% this year, as of Tuesday’s close. The S&P 500 has shed more than 18% on the same basis, and the Nasdaq Composite is down more than 32%.
It’s rare that the Dow would beat out the S&P 500 on a total-return basis at all. The margin by which it beat the larger index — by about 10 percentage points — makes this year’s performance increasingly notable: It’s the widest margin by which the Dow has beaten the S&P 500 since 1958.
There are two other instances in which the year-end difference between the two indexes was about as wide – 1980 and 1998 – but the S&P 500 was the leading index in both cases.
“Over time, the Dow correlates with the S&P 500,” said Howard Silverblatt, senior index analyst for S&P Dow Jones Indices. “But as you can tell this year, it’s apples and oranges.”
Breaking down the Dow Jones Industrial Average
The Dow Jones Industrial Average is one of the oldest indexes that investors track. It was first developed in 1896 and started including 30 stocks — which it still does today — in 1928, according to the Library of Congress.
The initial stocks were chosen to represent major parts of the U.S. economy. Today, the blue-chip stocks in the index are selected by a committee at S&P Dow Jones Indices who pick them based on performance and to balance the index. That’s different from how stocks are added to the S&P 500 and Nasdaq Composite, which require shares to meet certain parameters such as market capitalization.
Beyond having a much smaller number of companies in the index than the S&P 500 and Nasdaq, the Dow also calculates its weighting differently. The Dow price-weights the stocks in its index, different from the market capitalization weighting used by the S&P and Nasdaq.
This price weighting means that stocks with a higher price have a greater impact on the index, even if they have fewer shares. This also affects the sector weightings of the Dow, which means that it has a different breakdown than the S&P 500.
Still, the Dow is an often cited index because of its straightforward nature. Many investors can probably name a few companies on the index, and it still represents major parts of the U.S. economy as it did in its inception.
“The Dow is a simple thing to understand,” said Silverblatt, adding that this year, simple beat out complex.
Of course, its simplicity also means that many strategists don’t see the Dow as a good representation of the current stock market.
“It’s very limited in its scope,” said Liz Young, head of investment strategy at SoFi. “And it obviously isn’t a comprehensive representation of the American economy.”
Why it outperformed in 2022
The wonky composition of the Dow ended up being one of the reasons it outperformed its more complex index peers in 2022.
“The Dow has done better because it was underweighted in those areas that fell the furthest and overweighted in those areas that did better,” said Sam Stovall, chief investment strategist at CFRA.
In the Dow, health care, consumer discretionary, financials, communication services and information technology sectors contributed positively to the annual performance. At the same time, sectors that were hit hard, such as technology, are under-represented in the index and thus didn’t weigh it down as much compared to the S&P 500 and Nasdaq.
“Those top five names in the S&P 500 had a really rough time of it this year and are really the primary laggards across portfolios,” said Rob Haworth, senior vice president and senior investment strategist at U.S. Bank. “Whereas the more classic industrial names have done much better this year.”
What stocks led and lagged the Dow
The strongest performers in the Dow – health-care and energy stocks – also helped lift it more than the other indexes, which were in contrast slammed by underperformers such as tech and real estate. The top performers included oil name Chevron, which is up more than 47% this year, and Merck, which has surged more than 43%.
The laggards in the Dow didn’t weigh on the index as much as the S&P 500. Tech names Salesforce and Intel shed more than 48% this year, but those were the worst performances on the index. On the flipside, large tech names in the S&P 500 have done much worse. For example, Meta has shed 65% year to date.
“A lot of that pain was felt in growth sectors of the market, like tech and communications and consumer discretionary,” said SoFi’s Young.
Of course, while the sector weights of the Dow largely boosted its performance, some stocks did push and pull the index more than the S&P 500, Silverblatt noted.
For example, a stock such as Apple – which has shed 25% this year – had a very different impact on the two indexes.
“Apple took a much smaller component [on the Dow] than the S&P,” said Silverblatt. “The bottom line is that it comes down to the issue makeup and the weightings.”
Salesforce, which was added to the Dow in August 2020 to rebalance the index after Apple’s 4-for-1 stock split, also accounted for a much larger portion of the 30-stock index’s loss than it did for the S&P 500. Salesforce has shed nearly 50% this year.
Interestingly, it replaced Exxon Mobil in the index, which has surged more than 70% this year – a performance that would’ve boosted the Dow’s total return if it were still included.
Even if Exxon were still included in the Dow, it wouldn’t have lifted the index from a negative yearly return, Silverblatt said.
What’s to come for stocks
To be sure, the outperformance of the Dow is more of an interesting fact signaling the stock market’s year than a piece of investing advice, according to experts.
“It’s not something where you would say the Dow is a better index or that the Dow is more resilient,” than others, said Young, adding that she wouldn’t tell investors to own the 30-stock benchmark in this market cycle as the S&P 500 is much broader.
In addition, Wall Street analysts say it is unlikely that the Dow will again outperform the S&P 500 in 2023.
“I think 2023 will be much more of a stock picker’s market,” said Young, adding that in such a market, looking at the S&P 500 is a better choice because it has so many more options than the Dow.
Still, the performance is yet another sign of how 2022 upended what investors had come to expect in the stock market – increasing prices, tech outperforming and a negative correlation between stocks and bonds.
“Even if you can’t find relevance in it, it’s significant,” said Silverblatt.
2023 should be a brighter year for the traditional 60/40 portfolio
PUBLISHED WED, DEC 21 20223:23 PM ESTUPDATED AN HOUR AGO
Investors who stuck to the traditional portfolio breakdown of 60% allocated to stocks and 40% allocated to bonds were hit hard this year as both asset classes shed value.
The S&P 500 has slumped about 18.6% year to date and remains in a bear market. Technology stocks, which had been high flyers in previous years, plummeted — the tech-heavy Nasdaq Composite is down more than 32% in the same period.
Bonds also lost value for investors this year, going against the traditional correlation where they act as a hedge to stock market volatility. The Bloomberg U.S. Aggregate, a bond benchmark, has slipped more than 12.2% year to date.
The reason? A combination of economic uncertainty in the post-Covid world coupled with high inflation, which prompted the Federal Reserve to hike interest rates by the most in decades. That weighed on stocks and pushed up bond yields, which are inverse to price.
It amounted to a “perfect storm,” Ed Clissold, chief U.S. market strategist at Ned Davis Research, wrote in a Dec. 6 note. In addition, 60/40 portfolios saw their worst annual return since 1926, he said.
Now, investors may be wondering what the new year brings. There’s still a lot of economic uncertainty in the U.S. as the Federal Reserve continues to hike interest rates — albeit at a slower pace — to tame high inflation. Traders are bracing for a recession and some companies have already started to trim their ranks in preparation for leaner times ahead.
Still, most analysts don’t expect the year to yield a worse performance than 2022 for the standard 60/40 portfolio. That bodes well for investors who still have a traditional portfolio balance.
“For folks who have weathered the storm, you can start to see the clouds clearing on the horizon,” said Ross Mayfield, an investment strategy analyst at Baird. “We would say think long term and stick to your plan.”
What’s to come
Part of the reason that experts anticipate better returns in 2023 is that 2022 has been an unusual year for markets, between economic uncertainty, rising interest rates, global political unrest and more.
“2022 was a pretty big anomaly in the sense that it was only the fifth time since the 1920s that both stocks and bonds were down in the same year,” said Liz Young, head of investment strategy at SoFi. “So, the likelihood of that happening again is very slim.”
We need the Fed to win the inflation war to get back to more normal returns.”
Rob Haworth
SENIOR INVESTMENT STRATEGIST, U.S. BANK
In addition, though the U.S. could be heading for a recession in the second half of the year, it doesn’t mean that stocks are going to fall again — the stock market often leads the broader economic cycle by a half of a year or more.
Part of the reason that stocks have slipped this year is the Federal Reserve’s aggressive path of rate hikes to tame high inflation. At some point — and potentially as soon as next year — the central bank may have to pivot from its agenda.
“Historically when the 60/40 has done really poorly, it has often been associated with an aggressive hiking cycle,” said Mayfield. “In the years following, you usually get a reversal of the Fed rates, and fixed income has a really nice running performance, and then longer term, you get the stock performance as well.”
Of course, as the Fed continues to hike rates, even at a slower pace, it could lead to more volatility in the first half of 2023. That pain is worth the long-term payoff, however.
“We need the Fed to win the inflation war to get back to more normal returns,” said Rob Haworth, senior investment strategist, wealth management at U.S. Bank.
Will negative stock and bond correlation return?
Another reason that 60/40 portfolios were hit so hard in 2022 was that the correlation between equities and bonds flipped — instead of balancing each other, the asset classes both shed value at the same time.
“Many investors now wonder if the once-normal negative correlation between equities and bonds will ever return,” Galina Pozdnyakova of Deutsche Bank wrote in a December note. “That adds to concerns over several other market correlations that have not worked out as many investors expected, such as gold and inflation.”
Generally, it is expected that the negative correlation between stocks and bonds will return over time — in the last part of 2022, the asset classes again started moving in opposite directions more frequently.
But investors often miss an important point in this debate, according to Pozdnyakova. That is that the overall split of the portfolio between stocks and bonds may matter less than the risk exposure of assets and how volatile they’re likely to be in an uncertain market.
“The market drops this year mainly highlight the fact that while the market weights of equities and bonds are split as 60/40, the risk exposure within the portfolio is much more highly weighted towards equities – often close to 90 percent,” she said.
That means that what stocks you have in your equity portfolio and how risky they are is more important than the balance between risk assets and fixed income – though most financial planners would recommend you have both.
What investors should do now
Investors may still want to review their portfolios and rebalance for the year ahead. It may be a good idea to check allocations to different sectors to ensure you’re set up for success next year and beyond.
“I really don’t think tech is going to be the star of the show, at least for the first half of 2023,” said Young. “If you’re accustomed to having a big overweight to technology or being even market weight technology, I would maybe consider going a little underweight and spreading it across some more value-oriented sectors.”
After the yearly performance, some of your allocations might be out of balance, or you may want to increase the diversity of the stocks you invest in to shield yourself going forward.
“Diversification benefits you when you have a common factor that is so painful for markets,” such as high inflation, said Haworth.
That also applies to asset classes, meaning that investors should look at their balance of stocks to bonds as well. Going into a recession, the fixed income space may be a safer place to hold money than stocks.
Of course, no investor has a crystal ball to determine what exactly will happen in markets in 2023. Financial experts recommend that people invest with a long-term time horizon so that in the end, one year’s performance isn’t as important.
And even though the traditional 60/40 portfolio had a dismal 2022, investors shouldn’t write it off. They also shouldn’t discount it if the beginning of 2023 is volatile, as it’s likely to be before the market finds its footing.
“We wouldn’t throw that out in the long term, but in the near term it’s been a challenge,” said Haworth.
Apple’s market cap falls under $2 trillion as sell-off continues
PUBLISHED TUE, JAN 3 202312:43 PM ESTUPDATED TUE, JAN 3 20237:21 PM EST
KEY POINTS
- Apple shares fell more than 3% during intraday trading Tuesday, giving it a market value under $2 trillion for the first time since May.
- Apple first hit that valuation in August 2020, as the pandemic boosted sales of products for remote work and school. It briefly hit a $3 trillion valuation in January 2022.
- Apple struggled with iPhone 14 Pro shipments during the holiday season because of Covid restrictions on its primary factory in China.
Apple shares fell more than 3% trading on Tuesday, giving the iPhone maker a market capitalization under $2 trillion for the first time since May.
Apple fell $3.74% to a price of $130.20 per share, a 52-week low, giving the company a valuation of $1.99 trillion at market close on Tuesday.
Apple first hit a $2 trillion valuation in August 2020, as the pandemic boosted its sales of computers and phones for remote work and school. It briefly hit a market value over $3 trillion during trading in January 2022.
Apple struggled with iPhone 14 Pro shipments during the holiday season because of Covid restrictions on its primary factory in China. Investors are also wary of rising interest rates and declining consumer confidence, which could hurt demand for Apple’s premium-priced products.
A recent report from supply chain analyst Trendforce said it saw Apple’s iPhone shipments declining 22% in the December quarter. Apple has told suppliers to make fewer components for products including AirPods, Apple Watch and MacBook laptops, according to Nikkei.
Apple is the last big company to give up its $2 trillion valuation. Previously, Microsoft hit the $2 trillion mark but retreated from it in 2022.
The broader market was down Tuesday, with the S&P 500 index falling nearly under 1% during trading.
In 2022, Apple underperformed the S&P 500 index, which declined more than 18%. Apple’s share price fell nearly 27% in 2022.
https://www.ksl.com/article/50548249/sp-500-closes-out-dismal-year-with-worst-loss-since-2008
S&P 500 closes out dismal year with worst loss since 2008
By Damian J. Troise and Alex Veiga, Associated Press | Posted – Dec. 30, 2022 at 10:01 p.m.
A man rides his bicycle past monitors showing Japan’s Nikkei 225 index at a securities firm in Tokyo, Friday. Asian stock markets followed Wall Street higher on Friday following encouraging U.S. employment data but were headed for double-digit losses for the year. (Hiro Komae, Associated Press )
NEW YORK — Wall Street capped a quiet day of trading with more losses Friday, as it closed the book on the worst year for the S&P 500 since 2008.
The benchmark index finished with a loss of 19.4% for 2022, or 18.1%, including dividends. It’s just its third annual decline since the financial crisis 14 years ago and a painful reversal for investors after the S&P 500 notched a gain of nearly 27% in 2021. All told, the index lost $8.2 trillion in value, according to S&P Dow Jones Indices.
The Nasdaq composite, with a heavy component of technology stocks, racked up an even bigger loss of 33.1%.
The Dow Jones Industrial Average, meanwhile, posted an 8.8% loss for 2022.
Stocks struggled all year as inflation put increasing pressure on consumers and raised concerns about economies slipping into recession. Central banks raised interest rates to fight high prices. The Federal Reserve’s aggressive rate hikes remain a major focus for investors as the central bank walks a thin line between raising rates enough to cool inflation, but not so much that they stall the U.S. economy into a recession.
The Fed’s key lending rate stood at a range of 0% to 0.25% at the beginning of 2022 and will close the year at a range of 4.25% to 4.5% after seven increases. The U.S. central bank forecasts that will reach a range of 5% to 5.25% by the end of 2023. Its forecast doesn’t call for a rate cut before 2024.
Rising interest rates prompted investors to sell the high-priced shares of technology giants such as Apple and Microsoft as well as other companies that flourished as the economy recovered from the pandemic. Amazon and Netflix lost roughly 50% of their market value. Tesla and Meta Platforms, the parent company of Facebook, each dropped more than 60%, their biggest-ever annual declines.
Russia’s invasion of Ukraine worsened inflationary pressure earlier in the year by making oil, gas and food commodity prices even more volatile amid existing supply chain issues. Oil closed Friday around $80, about $5 higher than where it started the year. But in between oil jumped above $120, helping energy stocks post the only gain among the 11 sectors in the S&P 500, up 59%.
China spent most of the year imposing strict COVID-19 policies, which crimped production for raw materials and goods, but is now in the process of removing travel and other restrictions. It’s uncertain at this point what impact China’s reopening will have on the global economy.
The Fed’s battle against inflation, though, will likely remain the overarching concern on Wall Street in 2023, according to analysts. Investors will continue searching for a better sense of whether inflation is easing fast enough to take pressure off of consumers and the Fed.
If inflation continues to show signs of easing, and the Fed reins in its rate-hiking campaign, that could pave the way for a rebound for stocks in 2023, said Jay Hatfield, CEO of Infrastructure Capital Advisors.
“The Fed has been the overhang on this market, really since November of last year, so if the Fed pauses and we don’t have a major recession, we think that sets us up for a rally,” he said.
There was scant corporate or economic news for Wall Street to review Friday. That, plus the holiday-shortened week, set the stage for mostly light trading.
The S&P 500 fell 9.78 points, or 0.3%, to finish at 3,839.50. The index posted a 5.9% loss for the month of December.
The Dow dropped 73.55 points, or 0.2%, to close at 33,147.25. The Nasdaq slipped 11.61 points, or 0.1%, to 10,466.48.
Tesla rose 1.1%, as it continued to stabilize after steep losses earlier in the week. The electric vehicle maker’s stock plummeted 65% in 2022, erasing about $700 billion of market value.
Southwest Airlines rose 0.9% as its operations returned to relative normalcy following massive cancellations over the holiday period. The stock still ended down 6.7% for the week.
Small company stocks also fell Friday. The Russell 2000 shed 5 points, or 0.3%, to close at 1,761.25.
Bond yields mostly rose. The yield on the 10-Year Treasury, which influences mortgage rates, rose to 3.88% from 3.82% late Thursday. Although bonds typically fair well when stocks slump, 2022 turned out to be one of the worst years for the bond market in history, thanks to the Fed’s rapid rate increases and inflation.
Several big updates on the employment market are on tap for the first week of 2023. It has been a particularly strong area of the economy and has helped create a bulwark against a recession. That has made the Fed’s job more difficult, though, because strong employment and wages mean it may have to remain aggressive to keep fighting inflation. That, in turn, raises the risk of slowing the economy too much and bringing on a recession.
The Fed will release minutes from its latest policy meeting on Wednesday, potentially giving investors more insight into its next moves.
The government will also release its November report on job openings Wednesday. That will be followed by a weekly update on unemployment on Thursday. The closely-watched monthly employment report is due Friday.
Wall Street is also waiting on the latest round of corporate earnings reports, which will start flowing in around the middle of January. Companies have been warning investors that inflation will likely crimp their profits and revenue in 2023. That’s after spending most of 2022 raising prices on everything from food to clothing in an effort to offset inflation, though many companies went further and actually padded their profit margins.
Companies in the S&P 500 are expected to broadly report a 3.5% drop in earnings during the fourth quarter, according to FactSet. Analysts expect earnings to then remain roughly flat through the first half of 2023.
U.S. stock markets will be closed Monday in observance of the New Year’s Day holiday.
China reopening earlier than expected could hit supply chains in the short term, but boost growth in 2023
PUBLISHED THU, DEC 29 202212:06 AM EST
KEY POINTS
- Goldman Sachs economists warn of a temporary labor shortage and supply chain disruptions.
- The economists predict the Chinese yuan will only see marginal weakening to maintain 6.90-levels against the U.S. dollar for the next 12 months.
- Leisure travel to mainland China will likely resume by Easter of 2023, ING said in a note.
Mainland China’s reopening came sooner than expected for investors, and Goldman Sachs warns it will lead to short-term strains in the workforce and supply chains.
According to mobility data analyzed by economists at Goldman Sachs, China is likely to see “weaker growth momentum during the frontloaded ‘exit wave’ on the back of surging infections, a temporary labor shortage and increased supply chain disruptions,” it said in a note Tuesday.
Goldman basket of U.S. stocks linked to China is starting to beat the market — Here’s what’s in it
“Amid the rapid reopening, the challenge to China’s medical system may have been significantly escalated, especially for less developed inland and rural areas amid the upcoming Lunar New Year holiday,” Goldman economists including Lisheng Wang and Hui Shan wrote, adding that they expect mainland China’s daily new cases to reach a peak in late December or early January.
On Saturday, Shanghai’s Tesla factory reportedly suspended production as the company faced a fresh wave of Covid cases within its Chinese workforce. The company’s stock dipped more than 10% lower Tuesday and continued to hover around 2022 lows.
Tesla’s Asia suppliers LG Chem in South Korea and China’s Contemporary Amperex Technology fell more than 3% in Asia’s trade on Wednesday. Japan’s Panasonic also fell marginally.
According to economists polled by Reuters, China’s factory activity is expected to have contracted in December when its National Bureau of Statistics releases its manufacturing Purchasing Managers’ Index on Saturday.
Economists predict the reading will come in at 48, below the 50-point mark that separates growth from contraction and in line with levels seen in the previous month.
Near-term pressure on medical system
Goldman Sachs added that the abrupt pivot from China’s zero-Covid policy creates headwinds for China’s health care system.
“We view the new guidelines as a major step towards the full reopening, but caution on the increased challenges to China’s medical system in the near term,” the economists said in the note.
“This highlights the urgency of more and faster policy efforts to boost elderly vaccination and other medical resource supply,” such as intensive care unit beds, oral medication and medical staff, the note said.
Health authorities earlier this week said the nation’s ICU beds and resources are nearing capacity as infections soar.
Positive outlook for GDP, Chinese yuan
Despite shorter-term concerns for China’s reopening, economists have a rosy outlook for China’s growth in the long run.
“Improved growth expectations in 2023 might outweigh unfavorable factors such as deterioration in goods and services trade balances,” the Goldman Sachs note said.
The economists added the latest developments for reopening supports the firm’s previous forecasts for China’s economy to grow 5.2% in 2023, after expanding 1.7% in the fourth quarter of 2022 on an annualized basis.
The latest outlook was revised in mid-December, when it raised its forecast for 2023′s full-year growth from a previous prediction of 4.5%.
“Although we are confident that growth should accelerate meaningfully on reopening, significant uncertainties remain on Covid evolution, consumer behavior, and policymakers’ reactions, which in turn determine the pace and the magnitude of the Chinese economy’s recovery next year,” it said in the Dec. 16 note.
The firm added that the country’s reopening measures are positive for the onshore yuan as well, adding it only expects marginal weakening of the currency over the next year to maintain 6.90-levels against the U.S. dollar.
International travel to resume
The economists at Goldman Sachs said the latest measures will likely benefit the surrounding region’s growth as travel normalizes.
In a Dec. 11 note, the economists said Hong Kong and Singapore are likely to benefit the most, with their GDP increasing by 2.7% and 1% respectively – a halo effect from China’s reopening boosting its own domestic final demand by 5 percentage points.
Taiwan, Australia, and Malaysia will also see a moderate boost, of about 0.4 percentage points, to their economies, the note said.
Iris Pang, chief China economist at ING, said she expects leisure travel to mainland China to resume around the Easter holiday.
“The positive impact of these easing measures should go beyond international travelers,” Pang said in a note.
She said an increase in overall international travel flow will boost related industries, such as airlines, hotel accommodations and catering.
“The easing could also reduce the level of worries of Covid among the general public, and gradually they would not perceive Covid as a big threat – this should increase mobility within the country from the first quarter of 2023, and therefore consumption as well,” she said.
Why you may miss the market’s best days if you sell amid high volatility
PUBLISHED WED, MAR 9 20221:58 PM ESTUPDATED WED, MAR 9 20223:14 PM EST
KEY POINTS
- As conflict between Russia and Ukraine shocks the markets, investors in retirement may wonder what moves they should make now.
- Many professionals advise that it’s best to stay the course.
- Research shows that big market drops tend to precede large gains. If fears prompt you to sell, you could miss the upside.
As conflict between Russia and Ukraine continues to send shock waves through the markets, many investors may be questioning what, if anything, they should do next.
The most common advice is to stay the course.
That can be difficult on days like Tuesday, when fresh losses prompted both the Dow Jones Industrial Average and the S&P 500 Index to fall deeper into correction territory.
Yet those who held on were greeted with sharp gains on Wednesday that helped both of those indexes break a four-day losing streak.
10 BEST DAYS IN THE MARKET FROM 2002 THROUGH 2022*
| RANK | Date | Return |
| 1 | Oct. 13, 2008 | 11.6% |
| 2 | Oct. 28, 2008 | 10.8% |
| 3 | March 24, 2020 | 9.4% |
| 4 | March 13, 2020 | 9.3% |
| 5 | March 23, 2009 | 7.1% |
| 6 | April 6, 2020 | 7.0% |
| 7 | Nov. 13, 2008 | 6.9% |
| 8 | Nov. 24, 2008 | 6.5% |
| 9 | March 10, 2009 | 6.4% |
| 10 | Nov. 21, 2008 | 6.3% |
*Source: J.P. Morgan Asset Management analysis using data from Bloomberg. Returns are based on the S&P 500 Total Return Index, an unmanaged, capitalization-weighted index that measures the performance of 500 large capitalization domestic stocks representing all major industries.
This is actually a pattern, it turns out. The market’s worst days tend to be followed by its best days, according to research from J.P. Morgan Asset Management.
If you sell when the markets hit the skids, you’ll likely miss the upside.
“We often feel like we can take control of the markets by selling out of them,” said Katherine Roy, chief retirement strategist at J.P. Morgan.
“As a result, you lock in those losses and you really are likely to miss some of those best days that are going to follow very shortly thereafter,” she said.
According to J.P. Morgan’s analysis, the 10 best days over the past 20 years occurred after big declines amid the 2008 financial crisis or the 2020 pullback during the onset of the Covid-19 pandemic.
Had someone invested $10,000 in the S&P 500 on Jan. 1, 2002, they would have a balance of $61,685 if they stayed the course through Dec. 31, 2021.
If instead, they missed the market’s 10 best days during that time, they would have $28,260.
Why having a cash buffer can help
Staying the course may also help retirement savers reach their goals in other ways.
By contributing automatically to your 401(k) through your employer, it gives you the discipline to continue to invest through volatile markets, Roy said.
Additionally, investing enough to get a full employer match — what many call “free money” — can help increase your investment growth.
If you take out a loan during down markets, you’re losing the number of shares that can help you in that rebound or when those best days do occur.
Katherine Roy
CHIEF RETIREMENT STRATEGIST AT J.P. MORGAN
Retirement savers tend to sabotage that potential growth by taking early withdrawals, which can come with a 10% penalty if you’re under age 59½, in addition to the taxes you will have to pay on the income.
Alternatively, they may take out loans, though many people misunderstand the terms of these deals, which come with their own disadvantages, Roy said. You will lose value by selling shares in order to take the loan and later will have to buy them back as you repay the loan.
If that happens as the market recovers, you may be paying a higher price.
“It’s an additional setback,” Roy said. “If you take out a loan during down markets, you’re losing the number of shares that can help you in that rebound or when those best days do occur.”
One way to avoid to having to dip into your retirement investments is to have a sufficient sum of cash set aside to cover your near-term income needs.
Having that extra cash may help you stay the course during volatile markets, Roy said.
Moreover, other research has shown it may actually make you happier.
‘No One Saw It Coming’ – Should You Worry About The 10 Best Days
Mar. 24, 2020 9:03 AM ETSPY, QQQ, DIA, SH, IWM, TZA, SSO, TNA, VOO, SDS, IVV, SPXU, TQQQ, UPRO, PSQ, SPXL, UWM, RSP, SPXS, SQQQ, QID, DOG, QLD, DXD, UDOW, SDOW, VFINX, URTY, EPS, TWM, SCHX, VV, RWM, DDM, SRTY, VTWO, QQEW, QQQE, FEX, ILCB, SPLX, EEH, EQL, QQXT, SPUU, IWL, SYE, SMLL, SPXE, UDPIX, JHML, OTPIX, RYARX, SPXN, HUSV, RYRSX, SCAP, SPDN, SPXT, SPXV55 Comments49 Likes
Summary
- The S&P 500’s largest percentage gain days tend to occur in clusters during the worst of times for investors.
- For an investor trying to catch the markets best 10-days, they wound up losing almost 30% of their portfolio, an astounding -9,254 points over the span of 3 weeks.
- Despite two major bear market declines, and working its third, investors still believe they can invest their savings into a risk-based market, without suffering the eventual consequences of risk itself.
Pippa Stevens via CNBC recently had some advice:
“Panic selling not only locks in losses, but also puts investors at risk for missing the market’s best days.
Looking at data going back to 1930, Bank of America found that if an investor missed the S&P 500′s 10 best days in each decade, total returns would be just 91%, significantly below the 14,962% return for investors who held steady through the downturns.”
But here was her key point, which ultimately invalidates her entire premise:
“The firm noted this eye-popping stat while urging investors to ‘avoid panic selling,’ pointing out that the ‘best days generally follow the worst days for stocks.’”
Think about that for a moment.
“The best days generally follow the worst days.“
The statement is correct, as the S&P 500’s largest percentage gain days tend to occur in clusters during the worst of times for investors.
Here is another way to look at this through Friday’s close. For an investor trying to catch the markets best 10-days, they wound up losing almost 30% of their portfolio, an astounding -9,254 points over the span of 3 weeks.
The analysis of “missing out on the 10-best days” of the market is steeped in the myth of the benefits of “buy and hold” investing. (Read more: The Definitive Guide For Investing.) Buy and hold, as a strategy works great in a long-term rising bull market. It fails as a strategy during a bear market for one simple reason: Psychology.
I agree investors should never “panic sell,” as such “emotional” decisions are always made at the worst possible times. As Dalbar regularly points out, individuals always underperform the benchmark index over time by allowing “behaviors” to interfere with their investment discipline.
In other words, investors regularly suffer from the “buy high/sell low” syndrome.
Such is why investors should follow an investment discipline or strategy which mitigates volatility to avoid being put into a situation where “panic selling” becomes an issue.
Let me be clear; an investment disciple does NOT ensure your portfolio against losses if the market declines. This is particularly the case when it plummets, as we’ve seen in the last couple of weeks. However, in any event, it will work to minimize the damage to a recoverable state.
The Market Timing Myth
We previously stated, that when the “crash” came, the mainstream media’s response would be: “Well, no one could have seen it coming.”
Simply always being “bullish,” like Mr. Santolli, is what leads investors into being blindsided by rising risks in the market.
Yes, you can see, and predict, when risks exceed the grasp of rationality.
This brings us to the basic argument from the financial media which is simply you are smart enough to manage your investments, so your only option is to “buy and hold.”
In 2010, Brett Arends wrote an excellent commentary entitled: “The Market Timing Myth” which primarily focused on several points we have made over the years. Brett really hits home with the following statement:
“For years, the investment industry has tried to scare clients into staying fully invested in the stock market at all times, no matter how high stocks go or what’s going on in the economy. ‘You can’t time the market,’ they warn. ‘Studies show that market timing doesn’t work.’
He goes on:
“They’ll cite studies showing that over the long-term investors made most of their money from just a handful of big one-day gains. In other words, if you miss those days, you’ll earn bupkis. And as no one can predict when those few, big jumps are going to occur, it’s best to stay fully invested at all times. So just give them your money… lie back, and think of the efficient market hypothesis. You’ll hear this in broker’s offices everywhere. And it sounds very compelling.
There’s just one problem. It’s hooey.
They’re leaving out more than half the story.
And what they’re not telling you makes a real difference to whether you should invest, when and how.”
The best long-term study relating to this topic was conducted a few years ago by Javier Estrada, a finance professor at the IESE Business School at the University of Navarra in Spain. To find out how important those few “big days” are, he looked at nearly a century’s worth of day-to-day moves on Wall Street and 14 other stock markets around the world, from England to Japan to Australia.
Correctly, the study did find that if you missed the 10-best days of the market, you did indeed give up much of the gains. What he also found is that by missing the 10-worst days, you did remarkably better.
(The blue highlight shows, as of Friday’s close, investors will need a more than 40% return just to get back to even.)
Clearly, avoiding major drawdowns in the market is key to long-term investment success. If I am not spending the bulk of my time making up previous losses in my portfolio, I spend more time compounding my invested dollars towards my long term goals.
Over an investing period of about 40 years, just missing the 10-best days would have cost you about half your capital gains. But successfully avoiding the 10-worst days would have had an even bigger positive impact on your portfolio. Someone who avoided the 10-biggest slumps would have ended up with two and a half times the capital gains of someone who simply stayed in all the time.
As Brett concluded:
“In other words, it’s something of a wash. The cost of being in the market just before a crash, are at least as great as being out of the market just before a big jump, and may be greater. Funny how the finance industry doesn’t bother to tell you that.”
The reason that the finance industry doesn’t tell you the other half of the story is because it is NOT PROFITABLE for them. The finance industry makes money when you are invested – not when you are in cash. Since a vast majority of financial advisors can’t actually successfully manage money, they just tell you to “stay the course.”
However, you DO have options.
A Simple Method
Now, let me clarify. I do not strictly endorse “market timing,” which is specifically being “all-in” or “all-out” of the market at any given time. The problem with market timing is consistency.
You cannot, over the long term, effectively time the market. Being all in, or out, of the market will eventually put you on the wrong side of the “trade,” which will lead to a host of other problems.
However, there are also no great investors in history who employed “buy and hold” as an investment strategy. Even the great Warren Buffett occasionally sells investments. True investors buy when they see the value, and sell when value no longer exists.
While there are many sophisticated methods of handling risk within a portfolio, even using a basic method of price analysis, such as a moving average crossover, can be a valuable tool over the long term holding periods. Will such a method ALWAYS be right? Absolutely not. However, will such a method keep you from losing large amounts of capital? Absolutely.
The chart below shows a simple 12-month moving average crossover study. (via Portfolio Visualizer)
What should be obvious is that using a basic form of price movement analysis can provide a useful identification of periods when portfolio risk should be REDUCED. Importantly, I did not say risk should be eliminated; just reduced.
Here are the comparative results.
Again, I am not implying, suggesting, or stating that such signals mean going 100% to cash. What I am suggesting is that when “sell signals” are given, that is the time when individuals should perform some basic portfolio risk management such as:
- Trim back winning positions to original portfolio weights: Investment Rule: Let Winners Run
- Sell positions that simply are not working (if the position was not working in a rising market, it likely won’t in a declining market.) Investment Rule: Cut Losers Short
- Hold the cash raised from these activities until the next buying opportunity occurs. Investment Rule: Buy Low
By using some measures, fundamental or technical, to reduce portfolio risk by taking profits as prices/valuations rise, or vice versa, the long-term results of avoiding periods of severe capital loss will outweigh missed short term gains.
Small adjustments can have a significant impact over the long run.
As Brett continues:
Let’s be clear what it doesn’t mean. It still doesn’t mean you should try to ‘time’ the market day to day. Mr. Estrada’s conclusion is that a small number of big days, in both directions, account for most of the stock market’s price performance. Trying to catch the 10-biggest jumps, or avoid the 10-big tumbles, is almost certainly a fool’s errand. Hardly anyone can do this sort of thing successfully. Even most professionals can’t.
But, second, it does mean you that you shouldn’t let scare stories dominate your approach to investing. Don’t let yourself be bullied. Least of all by someone who isn’t telling you the full story.”
There is little point in trying to catch each twist and turn of the market. But that also doesn’t mean you simply have to be passive and let it wash all over you. It may not be possible to “time” the market, but it is possible to reach intelligent conclusions about whether the market offers good value for investors.
There is a clear advantage of providing risk management to portfolios over time. The problem, as I have discussed many times previously, is that most individuals cannot manage their own money because of “short-termism.”
Despite their inherent belief that they are long-term investors, they are consistently swept up in the short-term movements of the market. Of course, with the media and Wall Street pushing the “you are missing it” mantra as the market rises – who can really blame the average investor “panic” buying market tops, and selling out at market bottoms.
Yet, despite two major bear market declines, and working its third, it never ceases to amaze me that investors still believe they can invest their savings into a risk-based market, without suffering the eventual consequences of risk itself.
Despite being a totally unrealistic objective, this “fantasy” leads to excessive speculation in portfolios, which ultimately results in catastrophic losses. Aligning expectations with reality is the key to building a successful portfolio. Implementing a strong investment discipline, and applying risk management, is what leads to the achievement of those expectations.
Editor’s Note: The summary bullets for this article were chosen by Seeking Alpha editors.