RECORDING Market Commentary 05-24-2016
HI Financial Services Commentary 05-24-2016
What are my choices in the stock market because everything I look at seems to be the same? Hurley Investments Client
What’s going on in the stock market this year? I don’t know
If you’re down are you making anything to the downside? YES
Stocks are doing something they haven’t done in 20 years
Bollinger Bands are a tool occasionally used by technical analysts to determine how high or low prices currently are, as compared to a combination of their moving average and their standard deviation over a certain number of periods.
Since volatility on a monthly basis has been declining precipitously, and the market is trading closely in line with its recent average prices, those bands currently have a width of 12 percent, which is the narrowest they’ve been since 1995. Besides 1994-1995 and today, there have been three other periods when the bands have been this tight: 1977, 1960 and 1948.
The historical reaction to these conditions is mixed, but when this happened about 20 years ago, the S&P 500 found itself 23 percent higher in a year’s time.
Using Bollinger Bands to make trading decisions has a few obvious problems: They generally don’t include enough periods to lend any statistical significance, the non-normal distribution of market returns means that standard deviation measures are of limited use and there is no evidence that a Bollinger Band-based strategy outperforms buying and holding.
Yet what the current state of the S&P’s monthly Bollinger Bands may speak to is the sense of vague uncertainty and malaise that has spread like kudzu among investors.
According to the American Association of Individual Investors Sentiment Survey released Thursday, neutral sentiment among investors has been above 40 percent for 10 straight weeks; neutrality has been above its historical average of 31 percent for 68 weeks out of the past 72.
While the market always has “unknowns” to contend with, two key events in the next month could explain this neutral miasma. The U.K.’s referendum on whether to leave the European Union is being held June 23, and many strategists and economists have warned that a decision to exit could take a substantial bite out of risk appetites and global growth.
In the week prior, the Federal Reserve‘s June policy statement is destined to be a major event, as the U.S. central bank either raises rates, sets investors up for a hike in July, or pushes tightening off into the future.
According to Oppenheimer technical analyst Ari Wald, any worries about a rate hike may be misplaced. He pointed out Monday on CNBC’s “Trading Nation” that stocks tend to rise, rather than fall, in the year after the first rate increase.
Still, until the uncertainty breaks and the risk environment appears more easily understood, quiet and neutral may continue to be the labels that stick to this market.
Interesting Data point but it means…….A breakout but we don’t know if it is going to be higher or lower.. It means a lot of nothing
Right now important dates are June 13th FOMC meeting and June 21st (possibly) Grexit – Great Britain Exiting the Euro
MONDAY next week the US Stock market is closed – Expect Wednesday to be the last average volume day of the week in the stock market
What’s happening this week and why?
New Home Sales 619 vs est 521
Very flat lowest volume S&P 500 day on Monday
PMI overseas numbers DE:FR:EMU
Where will our market end this week?
Lower
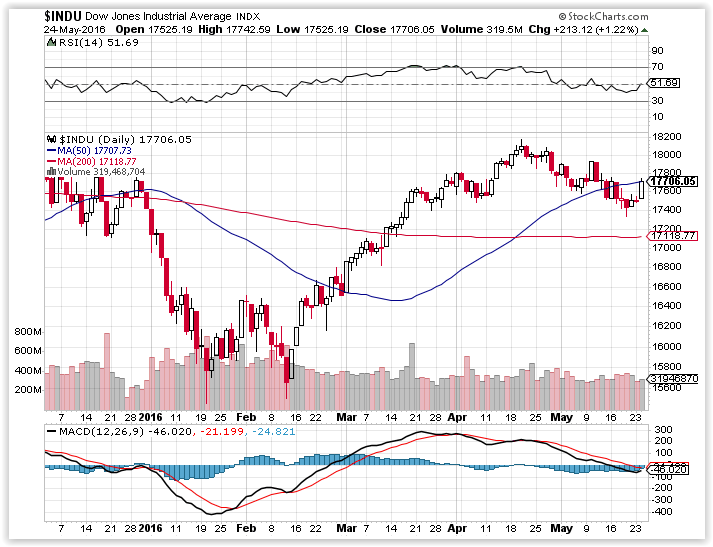
DJIA – Still Technically Bearish – VERY Close to turning bullish and breaking the 50 SMA
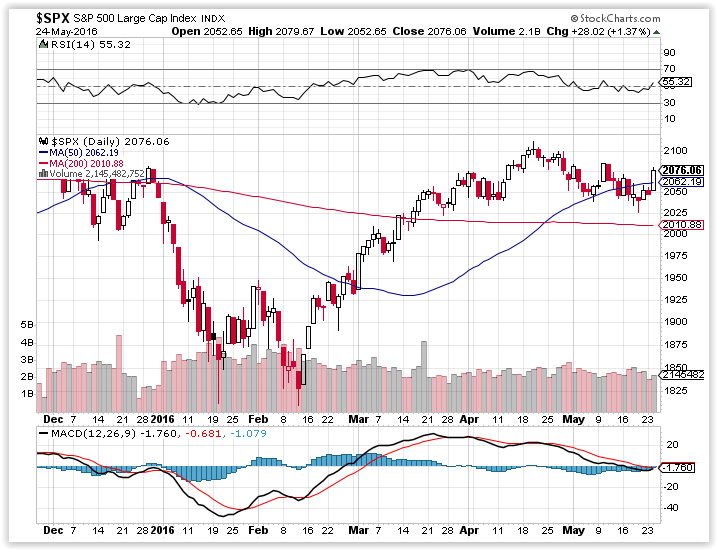
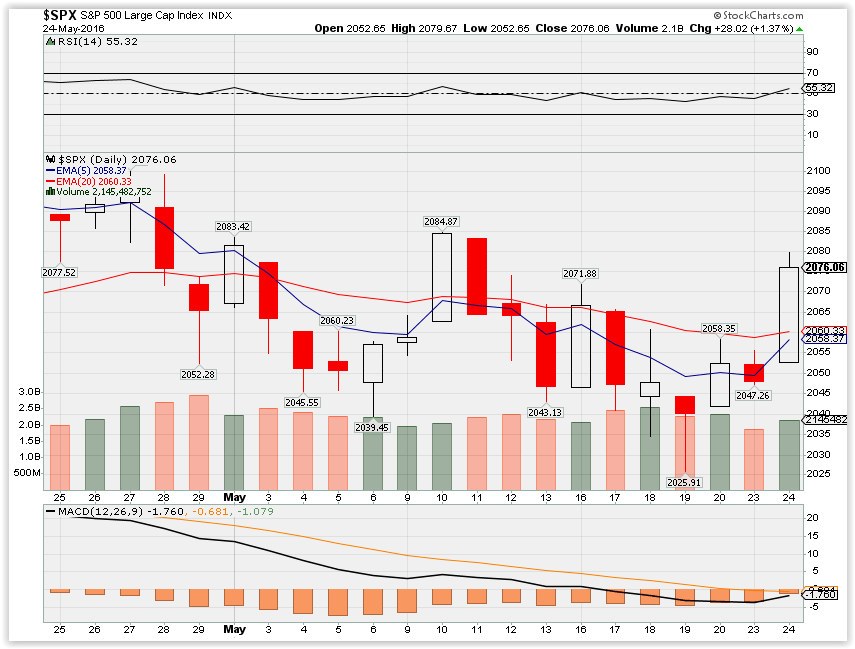
SPX – Close to going bullish but not there yet on 5/20 or the MACD but be broke above the 50 SMA
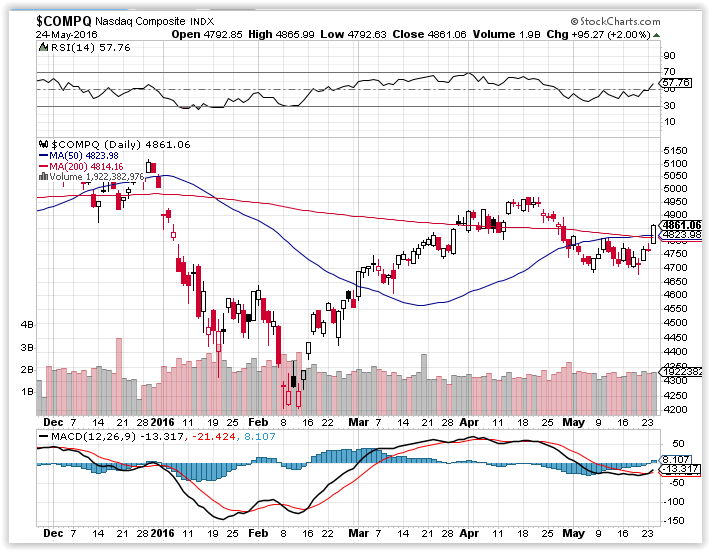
COMP – Technology is bullish and need to take off some long puts
Where Will the SPX end May 2016?
05-24-2016 -2.5%
05-17-2016 -2.5%
05-11-2016 -2.5%
05-04-2016 -2.5%
What is on tap for the rest of the week?=
Earnings:
Tues: AZO, BBY, INTU
Wed: COST, HPQ, TIF
Thur: ANF, BURL, CHS, DG, DLTR, GME
Fri: BIG
Econ Reports:
Tues: New Home Sales
Wed: MBA, Crude, FHFA Housing Price Index
Thur: Initial, Continuing Claims, Durable Goods, Durable ex-tran, Pending Home Sales
Fri: GDP-2nd Estimate, GDP Deflator, Michigan Sentiment
Int’l:
Tues – FR: Business Climate
Wed –
Thursday – JP: CPI, GB: GDP
Friday – Yellen Speaks at Harvard
Sunday – JP: Retail Sales
How I am looking to trade?
Taking off some long put protection especially on bullish tech stock.
Options expiration on Friday and I feel like I need to sell some more premium
To sell premium short puts against long puts and roll covered calls or add new covered calls as volatility has picked up
Questions???
Core portfolio components = AAPL, BIDU, DIS, V, F, NVDA
750 K or higher = AAPL, BIDU, V, DIS, FB looking for a bank stock to insert into the portfolio
250K to 750 K -= DIS, BIDU, AAPL , V and looking to move out of AAPL in FB
250K or Less – F, NVDA, SNDK, BAC, ZION, XLF,
www.myhurleyinvestment.com = Blogsite
customerservice@hurleyinvestments.com = Email