Trade Findings and Adjustments 01-26-2020
General Electric shares pop on better-than-expected industrial cash flow, rosy outlook
PUBLISHED TUE, JAN 26 20217:19 AM ESTUPDATED TUE, JAN 26 202112:31 PM EST
SHAREShare Article via FacebookShare Article via TwitterShare Article via LinkedInShare Article via Email
KEY POINTS
Shares of General Electric jumped after the company reported better-than-expected industrial free cash flow for the fourth quarter.
The company also projected it would generate between $2.5 billion and $4.5 billion in industrial free cash flow for 2021, largely dependent on the recovery in aviation.
GE stock has been on a tear in recent months, driven by a surprise third-quarter profit and positive Covid-19 vaccine news.
Shares of General Electric were up more than 2% in mid-day trading Tuesday after the company reported better-than-expected industrial free cash flow for the fourth quarter and a rosy outlook for this year.
The stock briefly jumped by more than 10% just before the markets opened Tuesday, but shed much of those gains throughout the day.
The company closed the fourth quarter with $4.37 billion in industrial free cash flow, a surprise after CEO Larry Culp projected at least $2.5 billion for the last three months of the year. The strong quarter pushed the company’s industrial free cash flow into positive territory for the year.
GE also projected it would generate $2.5 billion to $4.5 billion in industrial free cash flow for 2021.
The company also reported a revenue for the fourth quarter ended Dec. 31 that slightly beat analyst expectations while its profits fell short of estimates as the industrial giant continues to weather the coronavirus pandemic.
Here’s how GE performed compared with what Wall Street expected, based on average analysts’ estimates compiled by Refinitiv:
- Adjusted EPS: 8 cents versus 9 cents expected.
- Revenue: $21.93 billion vs $21.83 billion
The company’s better-than-anticipated revenue for the quarter was down 16% from a year earlier. On an unadjusted basis, the company reported diluted net earnings per share of 27 cents.
“As 2020 progressed, we significantly improved GE’s profitability and cash performance despite a still-difficult macro environment,” Culp said in a statement. “The fourth quarter marked a strong free cash flow finish to a challenging year, reflecting the results of better operations as well as strong and improving orders in Power and Renewable Energy.”
The 129-year-old industrial conglomerate makes jet engines, gas turbines and more and provides some financial services. It no longer manufactures the appliances and lightbulbs it made its household name on in the 20th century, as the company slims down and focuses on turning profits.
Culp said on a conference call with analysts the Covid pandemic “hit us hard,” but the company managed to strengthen its financial position through the year. He added that the company plans to “play more offense in 2021.”
JPMorgan analyst, Steve Tusa, who called GE’s fall years ago, said in a note to clients Tuesday that the company’s fundamentals were largely in line with expectations for the quarter, though free cash flow was surprisingly high.
“Bottom line, FCF carries the day on earnings as usual, but the underlying performance here is not too far outside the realm of what we had been expecting,” he said.
Gordon Haskett analyst John Inch, who has a hold rating on GE and price target of $7, was unimpressed by the beat on cash flow. He told clients that “strong free cash has been a hallmark of the recession for almost all industrial companies that have released working capital due to weak sales.”
The company’s fourth-quarter performance was driven largely by a rise in orders in its power and renewable energy businesses, which offset declines in aviation and health care. GE CFO Carolina Dybeck Happe told analysts that all segments except for aviation improved cash flow and “ended the year stronger than they began.”
GE’s power business reported a 26% year-over-year rise in orders to $5.62 billion for the quarter, driven largely by strong sales of gas power equipment. The company was able to lower fixed costs in its gas power business by 12%, allowing it to deliver positive cash flow for 2020, a year ahead of schedule.
The renewable energy segment reported $6.29 billion in orders, up 34% from a year earlier. Revenue in the segment fell about 6% from a year earlier to $4.44 billion.
Orders in the beleaguered aviation unit, once the company’s cash cow, fell 41% from a year earlier as the pandemic wrecked air travel in 2020. GE noted in its 2021 outlook that it “assumes Aviation revenue being flat to up year-over-year, which is dependent on the Commercial Aviation market recovery accelerating in the second half of 2021 as well as the timing of aircraft deliveries.”
The health-care segment reported $4.98 billion in orders, down by about 15% year over year. But GE attributed the decline mostly to the sale of its biopharma business in March.
“Over the past year our team proved resilient, and momentum is growing across our businesses,” Culp said. “We are in leading positions to capture opportunities in the energy transition, precision health, and the future of flight.”
GE’s financial services arm, GE Capital, reported a net loss of almost $200 million, driven largely by the company’s $200 million settlement with the Securities and Exchange Commission. Without admitting or denying wrongdoing, the company agreed to pay the fine for allegedly misleading investors by failing to disclose accounting changes in its power and insurance divisions that made its earnings look better.
Culp said on Tuesday’s call that the range of its 2021 performance will be largely determined by its performance in aviation.
GE was doubly exposed to the pandemic’s impact on air travel through aviation, a longtime jewel, that makes and services aircraft engines, and its aircraft leasing unit. The company is betting on an increase in deliveries in 2021 as Boeing 737 Max deliveries resume. GE and French company Safran make the planes’ engines through their CFM joint venture. Federal regulators late last year cleared the jets to fly again after Boeing made a series of safety-related changes following two fatal crashes and began delivering the planes last year.
But efforts to predict the recovery of air travel have proven largely inaccurate. Airline executives in recent weeks have warned they face a difficult start to 2021. Bookings dropped from the end-year holiday peak along with a spike in Covid infections and more contagious strains of the virus that have prompted new travel restrictions spanning the U.K. to the U.S. to South Africa.
Culp warned on Tuesday that the whiplash of volatile demand for GE’s jet engines and maintenance services has strained its supply chain.
“Our supply chain has been through a roller coaster,” he said. “We are working as closely as we can with the supply base to help them do what we’re doing, and that is work through the near term when we have these volume pressures, but also be ready for a number of scenarios by which we see a return toward more normal volumes.”
The stock has been on a tear in recent months, sparked by a surprise third-quarter profit reported in October that sent the stock surging by more than 70% over the fourth quarter. Positive vaccine news, which bodes well for aviation, has sustained the rise.
And some investors are bullish on the company’s turnaround under Culp, especially as he forecasts positive cash flow for 2021. GE has continued to pay down its debt during the pandemic and cut costs through, for example, layoffs in its aviation business.
CFO Dybeck Happe said the company reduced headcount by 11% in 2020 and noted that the company continues to shore up its finances by selling off its stake in Baker Hughes. The company reduced debt by $16 billion in 2020 and ended the year with $37 billion in liquidity.
— CNBC’s Leslie Josephs contributed to this report.
Watch: Why most short sellers lose money
Visa Vs. Mastercard: Battle Of The Payment Giants
Jan. 25, 2021 9:00 AM ETMastercard Incorporated (MA), V32 Comments34 Likes
2.51K Followers
Bio
Follow
Summary
- Visa and Mastercard are synonymous with payments globally, facilitating over $17 tln in payment volumes and commanding over half of the market share.
- While both companies have similar and stable business models, we examined which company is the better stock to buy when pit against each other.
- In doing this, we compared them across 5 areas: market share, financials, partnerships, business strategy, and valuation.
- Inadvertently, we identified UnionPay as a dark horse, which has emerged from the rise of the Chinese market through its links with the Chinese government.
Source: Visa, Mastercard
Dubbed the ‘crown jewels of payments’ by analysts, Visa (V) and Mastercard (MA) have become synonymous with payments globally. These companies operate payment networks, which facilitate authorization, clearing, and settlement of payment transactions. Both companies have a similar four-party business model and have very stable earnings and margins. Combined, they processed over $18 tln of payment volumes with a market share of 54%. As we believe the shift towards cashless transactions and rising global consumer spending are tailwinds for growth, we expect both companies to be beneficiaries. However, they are not alone, competing against a handful of companies, including UnionPay and American Express (AXP).
Between the two, Visa is the larger company by volume and earnings but we examine which has better growth and profitability. We also look at which company has better baking partnerships, as well as their transaction values per card.
In terms of business strategy, Visa is implementing Visa Direct for expansion into new markets such as P2P which is a $20 tln market opportunity. Meanwhile, Mastercard has made acquisitions to foray into the B2B market. We also examined UnionPay, a surprise contender, which has benefitted from the rise of China’s cashless payments.
Finally, our valuation accounted for projections of both companies’ revenues based on their transaction-based and volume-based revenues.
Dominance of the Global Card Payments Network
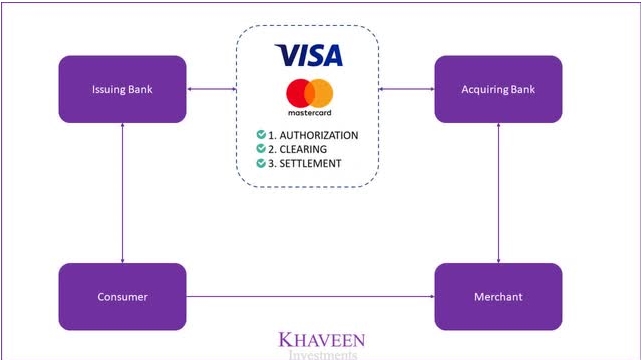
In essence, a card scheme is a central payments network, which facilitates electronic forms of payments. Contrary to popular belief, card networks do not issue cards. Instead, its primary role is to manage payment transactions in a typical four-party model illustrated below. The model consists of a cardholder, merchant, acquiring and issuing bank. The cardholder is issued a payment card by an issuing bank and uses it to transact with the merchant.
At the point of sale, payment details are sent to and processed by the acquiring bank. Payment processors such as PayPal (PYPL) and Square (SQ) also are intermediaries facilitating the transaction between the merchant and acquiring bank. The acquiring bank sends the payment details to the issuing bank through the card scheme such as Visa and Mastercard. The issuing bank confirms the transaction and completes the payment from the cardholder’s account.
Source: Khaveen Investments
These card networks generate revenues from fees charged based on the transaction volumes. They also operate in tremendous scale with over $30 tln in transaction value processed by the major card networks in 2019. Besides that, card networks also earn additional revenues from fees charged for value-added activities such as data analytics, security, and risk management.
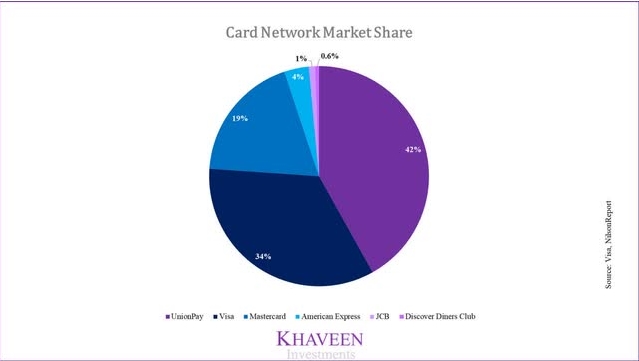
The most notable card schemes are UnionPay, Visa, Mastercard, and American Express. UnionPay has the largest market share of payment volumes at 42% followed by Visa at 34% and Mastercard at 19%. Compared to Visa and Mastercard, American Express operates in a 3-party model whereas Visa and Mastercard follow a 4-party model. The difference is that in a 3-party model, financial institutions are not involved as American Express issues and processes the cards themselves. While UnionPay has the largest market share, virtually all of the payment volumes are concentrated in China.
Source: Visa, NilsonReport
In terms of market share, Visa (34%) beats Mastercard (19%) hands down. However, it is by no means the crown jewel. UnionPay’s massive 42% market share makes it the surprise winner.
Solid Financials
Visa and Mastercard both have very similar and stable business models with solid revenue growth and profit margins. Their core businesses are to facilitate the flow of general purpose payment card transactions such as credit and debit cards. Both companies derive revenues by providing payment data processing, authorisation, and payments settlement. There are two components of revenues – transaction-based and volume-based revenues.
1) Transaction-based revenues are derived from fixed fees based on the number of transactions processed.
2) Volume-based revenues are derived as a percentage of the total value of each transaction including domestic and cross-border transactions.
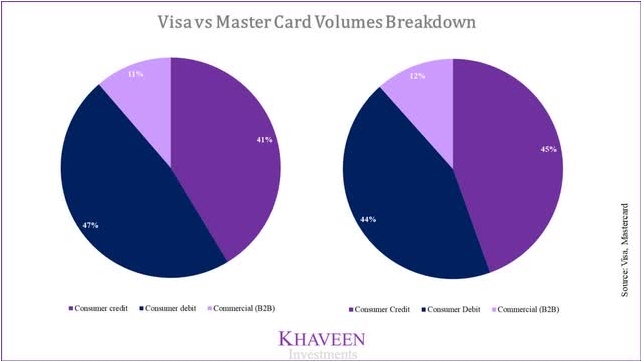
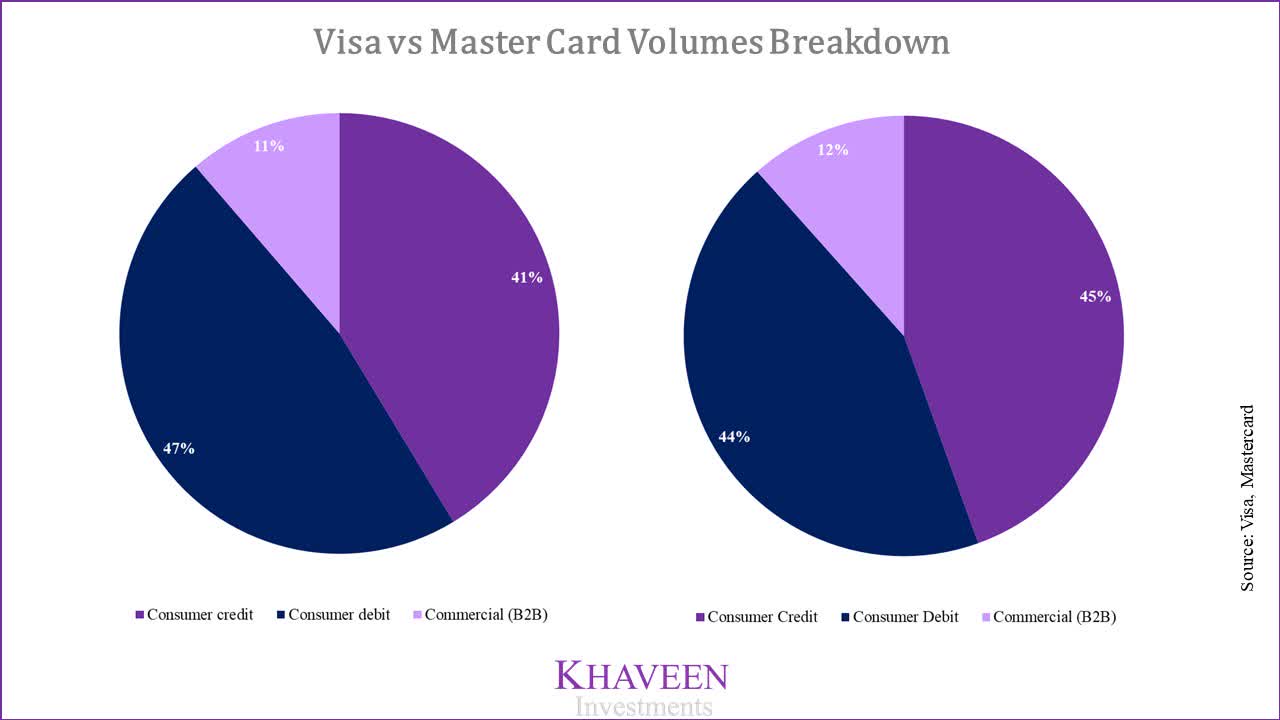
Source: Visa, Mastercard
In terms of transaction payments volume, Visa and Mastercard both have been able to grow its volumes steadily. Visa is the larger company with a higher payments volume of $11,757 bln, but is growing at a slower rate with an average growth rate of 4.9%. Whereas Mastercard has processed $6,468 bln of payment volumes with an average growth rate of 9.1%.
| Visa and Mastercard Transaction Payments Volume ($ bln) | 2015 | 2016 | 2017 | 2018 | 2019 |
| Visa Payments Volume ($ bln) | 9,905 | 8,872 | 10,516 | 11,380 | 11,757 |
| Visa Payments Volume Growth % | -10% | 19% | 8% | 3% | |
| Mastercard Payments Volume ($ bln) | 4,564 | 4,827 | 5,242 | 5,901 | 6,468 |
| Mastercard Payments Volume Growth % | 5.8% | 8.6% | 12.6% | 9.6% |
Source: Visa, NilsonReport
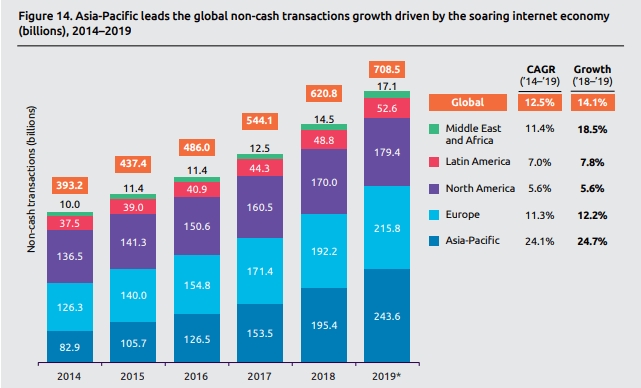
Both companies’ transaction payment volumes have been growing steadily in line with the secular trend of cashless transactions. From 2014 to 2019, cashless transactions grew at a 12.5% CAGR. The global market opportunity presented to Visa and Mastercard remains incredibly large. Visa estimates around $17.5 tln of consumer cash transactions conversion opportunity globally.
Source: Capgemini
Visa and Mastercard both have steady revenue growth on top of volume growth. Between the two, Visa has slightly lower revenue growth but has higher profitability compared to Mastercard. While revenue had dipped in 2020 as global consumer spending is believed to have decreased by 8.6%, the long-term growth outlook remains buoyant as the secular shift away from cash towards digital payments remains intact.
Earnings and Profitability
Visa’s revenue and earnings stability is depicted in the chart below. It has an average 5-year revenue growth rate of 9.8%. In terms of profitability, it has high gross profit margins and net margins at 96.7% and 44.29% respectively on average in the past 5 years.
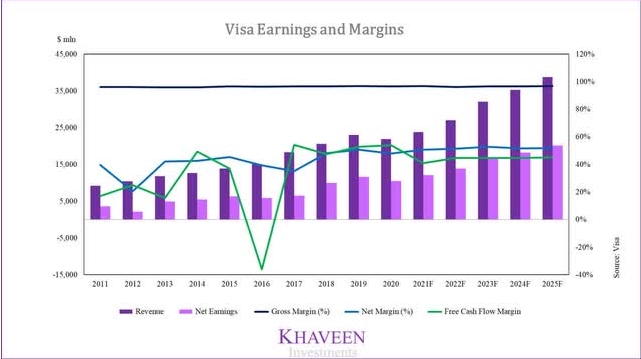
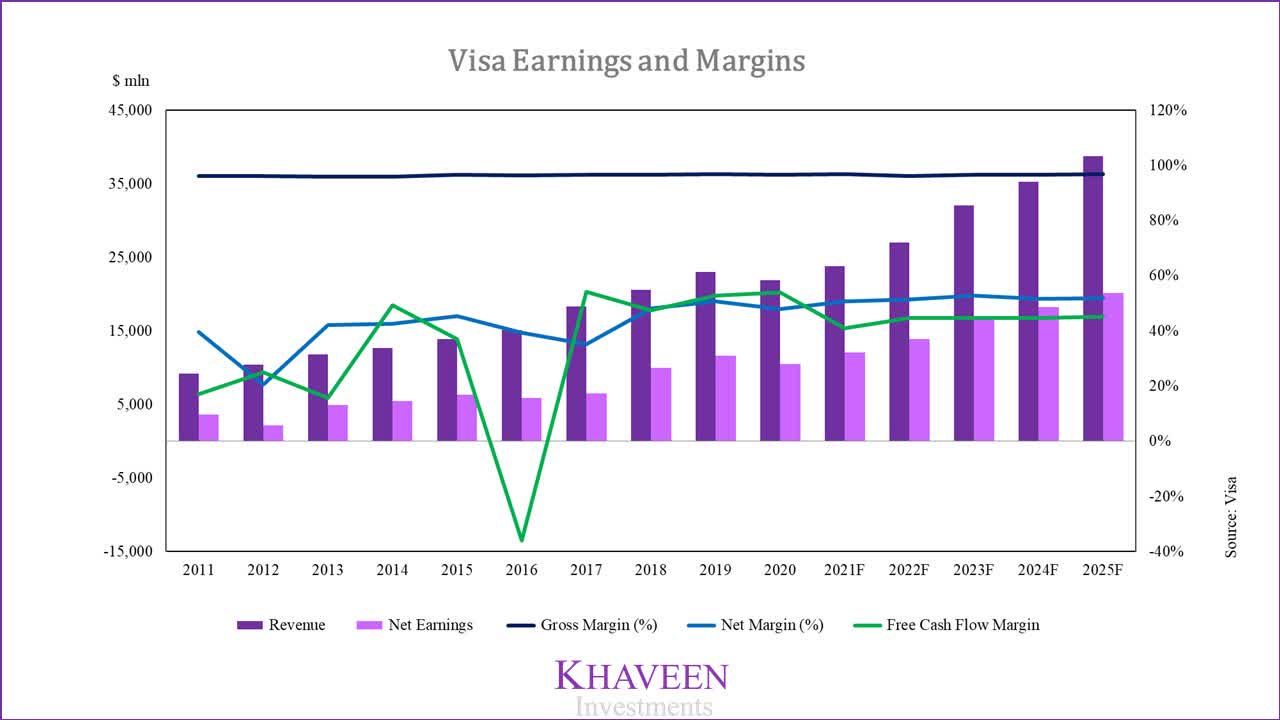
Source: Visa, Khaveen Investments
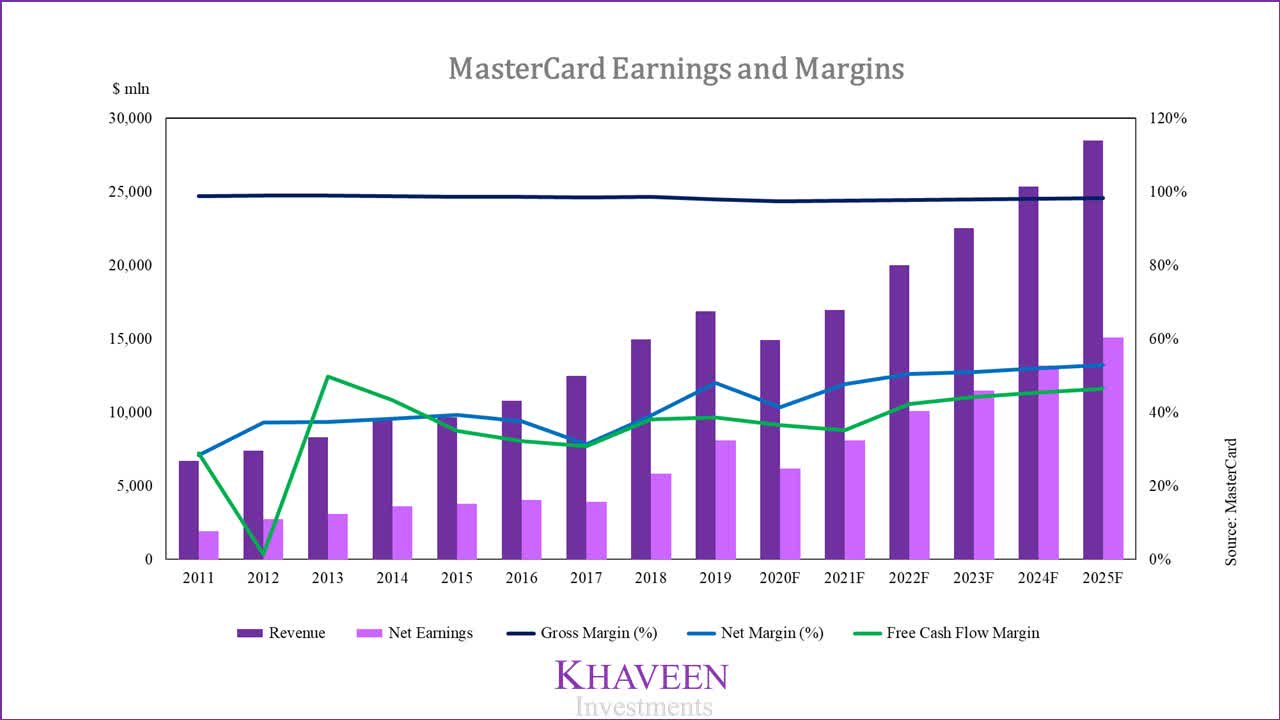
Mastercard also has very stable revenues and earnings. It has a slightly higher 5-year average revenue growth rate of 12.5%. In terms of profitability, it has an average gross margin and a net margin of 98.2% and 39.53% respectively.
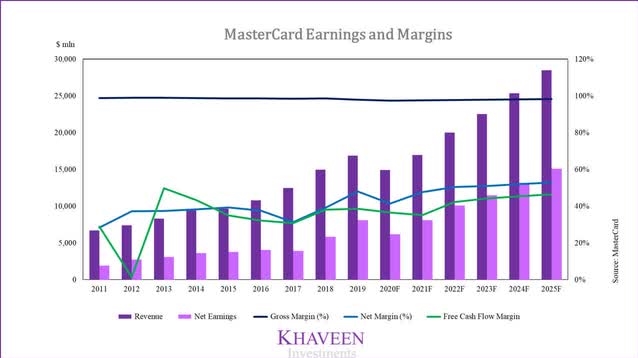
Source: Mastercard, Khaveen Investments
Cash Flow
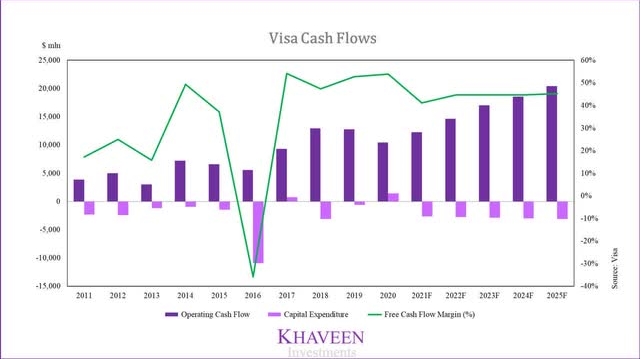
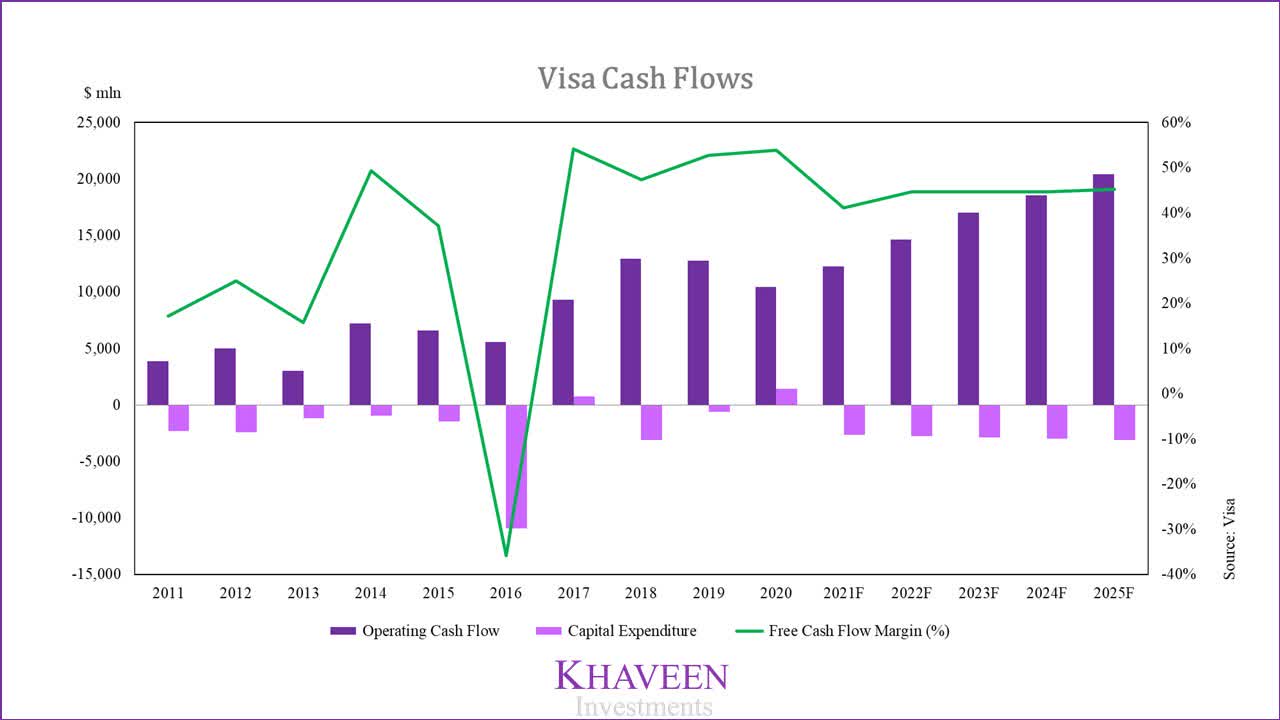
Besides stable revenue and earnings, Visa also has stable free cash generation abilities. Apart from 2016 where it had reacquired Visa Europe to consolidate its operations, it has positive cash flows in all years with an average FCF margin of 31.68% in the past 10 years.
Source: Visa, Khaveen Investments
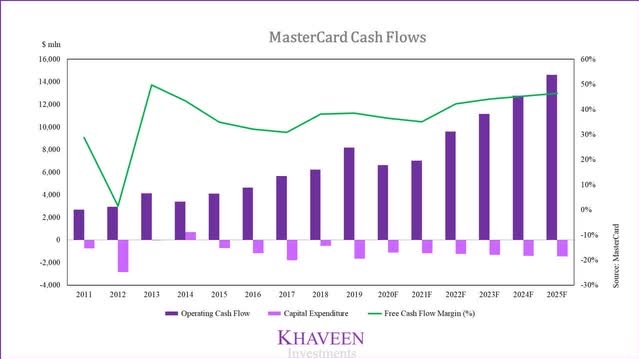
Similar to Visa, Mastercard also generates strong free cash flows. It has positive cash flows in all years, and higher than Visa with an average FCF margin of 33.49% in the past 10 years.
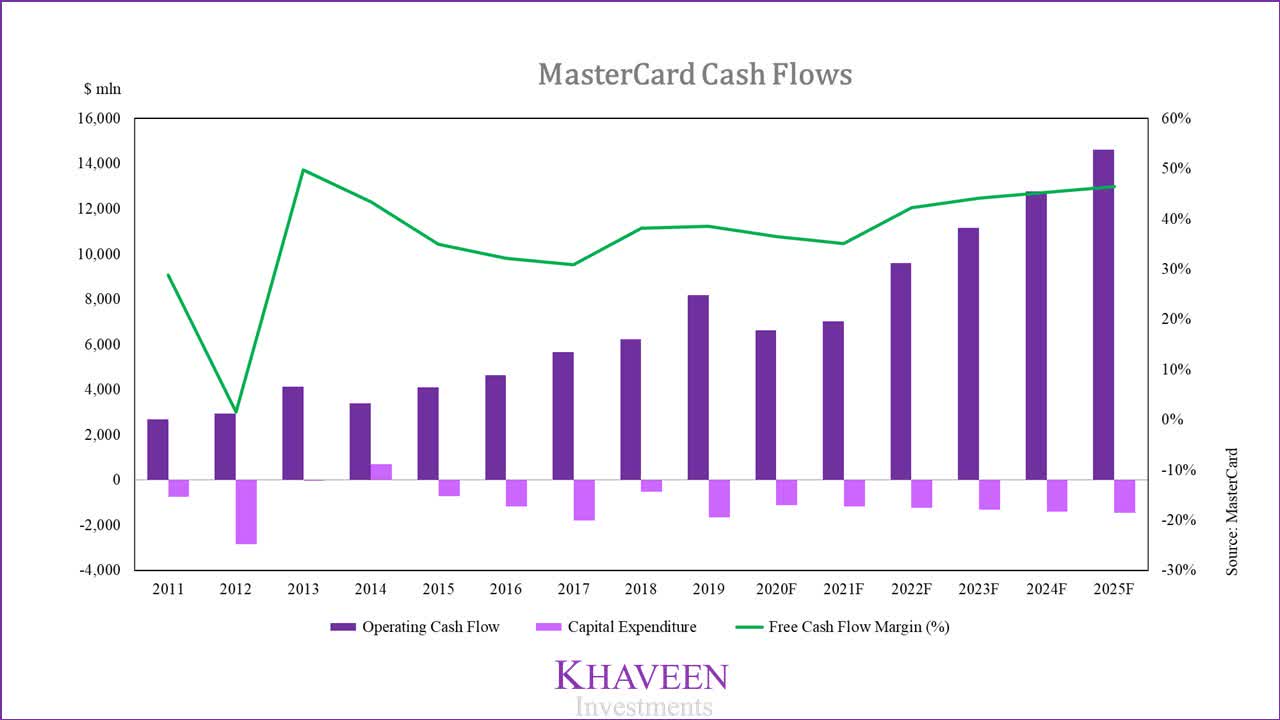
Source: Mastercard, Khaveen Investments
| Comparison of Visa and Mastercard | 5-average Revenue Growth Rate | Net Margin | FCF Margin |
| Visa | 9.80% | 44.29% | 31.68% |
| MasterCard | 12.50% | 40% | 34.06% |
Source: Visa, Mastercard
Overall, Visa and Mastercard have similar business models, which facilitates card payments. Both companies continue to grow their transactions, which they earn revenues from transaction-based and volume-based fees. Between the two, Mastercard has higher top-line growth. While Visa has a higher net profit margin, Mastercard’s cash flow margin is also higher than Visa. While both have solid financials, Mastercard wins this round.
Banking Partnerships
Whether or not a consumer uses Visa or Mastercard depends on the issuing bank. As explained in the four-party model, the issuing bank is the party, which issues a Visa or Mastercard card to the cardholder. The issuing bank earns an interchange fee when a payment transaction occurs via the cards. Therefore, Visa and Mastercard work closely with issuing banks to expand their market reach.
As discussed, Visa is the larger card network processing in terms of transactions and volumes processed as well as revenues and earnings. Visa operates on a larger scale compared to Mastercard. Although both have extensive coverage of the card payments market globally, Visa has wider exposure owing to its partnerships with key banks. Visa is longstanding partner of several of the largest issuing banks including JPMorgan Chase (JPM), Bank of America (BAC), Wells Fargo (WFC), and more.
Visa claims it has a leading share of partnerships with 8 of the top 10 US largest issuing banks. For example, it is a partner of JPMorgan Chase which contributes up to 10% of revenues and has deals, which have been continuously extended since 2013 for at least 10 years. Based on data from the CreditCardValidator, almost 70% of JPMorgan’s cards are Visa-issued cards. As one of the largest issuing banks in the world, JPMorgan Chase has one of the largest credit card portfolios in the world. In the US, JPMorgan accounts for 20% of card transaction volumes. In addition, other large issuers also skew towards Visa with Bank of America and Wells Fargo’s share of Visa issued cards at 63% and 90% respectively.
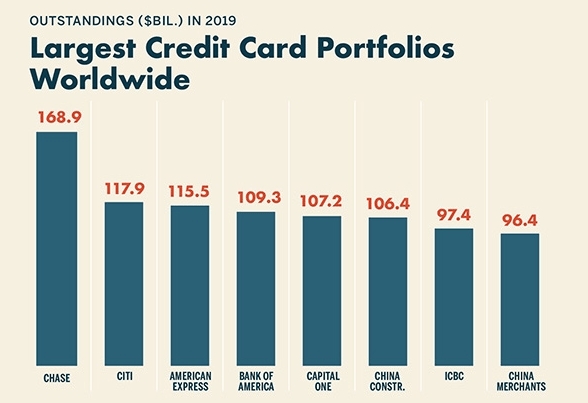
Source: NilsonReport
We believe the skewness towards Visa cards by issuing banks will continue to enable Visa to maintain the leading share of the number of cards issued. This is further highlighted by Visa’s higher transaction value per card compared to Mastercard. Based on data from Visa and Nilson Report, Visa has 14% higher transaction values per card compared to Mastercard. This means that Visa card customers spend more on Visa cards. As an issuing bank, this bodes well as it would translate to higher card processing revenues for the bank. Thus, we believe Visa’s higher transaction value per card would enable it to sustain its card leadership.
| Visa and Mastercard Transaction Value per Card | Visa | Mastercard |
| Total Card Transaction Volumes ($ bln) | 11,757 | 6,468 |
| Cards (‘mln’) | 3,454 | 2,172 |
| Transaction value per card | $3,404 | $2,978 |
Source: Visa, NilsonReport
In the tug-of-war for key banking partners, Visacomes out the winner with its key partnerships with some of the largest banks in the world, including JPMorgan Chase, Bank of America, and Wells Fargo.
Business Strategy: Visa (Consumer) vs. Mastercard (B2B)
Visa and Mastercard are continuously expanding to reap the benefits from the shift to cashless transactions. However, both companies have contrasting strategies with Visa more focused on consumer payments and Mastercard making strides to break the B2B market with notable acquisitions. Visa and Mastercard have been acquiring several companies to strengthen their core network capabilities and advance their expansion. They are consistently building and enhancing their core platform around technology in wake of disruption from Fintech.
Visa is leveraging its consumer segment advantage and is seeking to strengthen its capabilities with Visa Direct, a global real-time push payments platform for the P2P and B2C markets where a payment is initiated and authorised by the consumer. A pull payment in contrast is between consumers and merchants where the payment is initiated by the merchant.
The process is illustrated in the model below. Simply, Visa Direct provides financial institutions and payment service providers such as P2P operators with a mechanism to enable customers to send payments to other Visa account holders. The key benefit of Visa Direct is that the real-time nature of the platform enables instantaneous payments and provides greater convenience when compared to traditional payment rails.
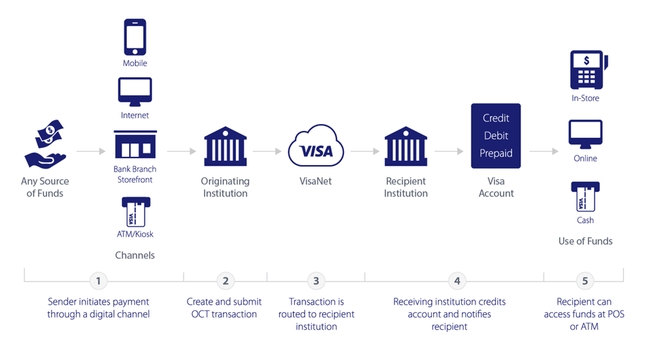
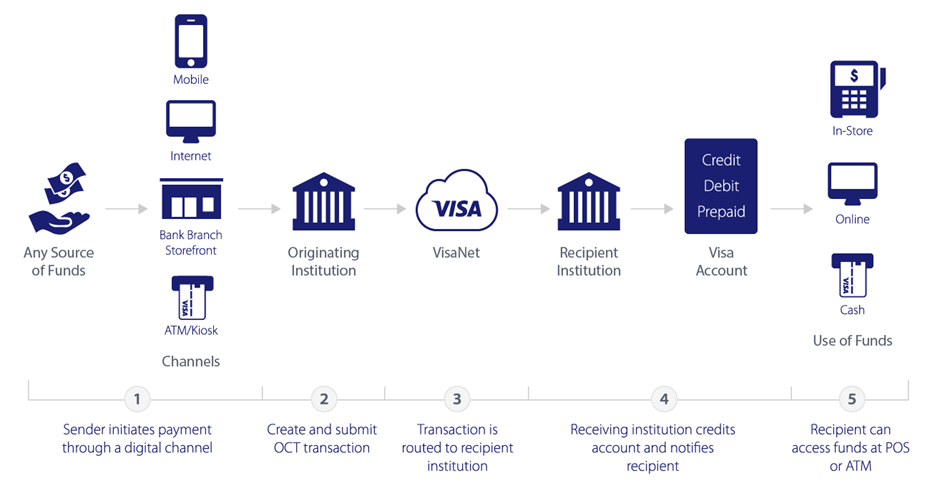
Source: Visa
A particular use case of this platform is in the P2P market. Visa has partnered with more than 100 P2P providers globally including major providers such as PayPal and Square. Visa Direct is the engine of popular P2P platforms such as Venmo and Cash App and Zelle. Visa Direct enables P2P, which involves sending money from one user to another instantly and conveniently. Overall, the Visa Direct network expands Visa’s consumer payment capabilities with real-time and convenient fund transfers, which could provide a large growth opportunity.
According to Visa, the company is seeing a market opportunity of $20 tln in the P2P market with Visa Direct. In 2020, Visa Direct accounted for 3.5bln or 1% of its total transactions, but is growing rapidly, led by a 75% increase in P2P transactions by Visa.
One of the most significant acquisitions by Visa has been Earthport, a cross-border payment service provider. The acquisition connects Visa to ACH and real-time networks in over 85 countries, allowing the cardholders to transfer funds to other account holders without Visa cards. It also complements Visa Direct, which previously needed to users to have a Visa card. With the acquisition of Earthport, Visa Direct can now also push directly to 1.5 billion additional bank accounts. This allows Visa to expand and scale Visa Direct’s applications such as with P2P.
Moreover, Visa’s other acquisitions include Payworks, a payment gateway software for POS. This is to integrate with Visa’s CyberSource digital payment management platform to offer a single point of integration for acquirers, merchants, and payment service providers. It also acquired Verifi, a dispute resolution tool with Visa’s suite of risk and fraud management services. Moreover, it acquired Smart Card Software Ltd., which offers a suite of tokenization solutions to enable secured mobile payments. Overall, Visa’s acquisitions have been concentrated on enhancing its consumer payments strategy.
| Company Acquired by Visa | Application | Acquisition Costs ($ mln) |
| Payworks GmbH | Internet Software and Services | n/a |
| Verifi Inc. | Payments Fraud Management | n/a |
| Smart Card Software Ltd. | Application Software | 75 |
| Earthport PLC | Payment Processors | 321.6 |
| Fraedom Holdings Ltd. | Payment Processors | 197.3 |
| CardinalCommerce Corp. | Payments Fraud Management | n/a |
Source: S&P Global Market Intelligence
On the other hand, Mastercard’s acquisitions have highlighted its strategy to expand its B2B market base. Mastercard is focusing on making traditional ACH payments faster and close to real-time, ACH is the primary payment rail for B2B transactions. This could enable it to tap the $125 tln B2B market. One of its most significant acquisitions is Nets A/S. Its largest deal adds instant payment services and accelerates its real-time payments strategy providing a better alternative to traditional ACH, cash, and check.
Furthermore, Mastercard also acquired Vyze, a POS lending platform for SMBs. In addition, it acquired Ethoca Inc., an acquiring payment security services provider as well as Transfast, a B2B cross-border payment provider. Lastly, it acquired VocaLink Holdings Ltd, which operates a payments technology for UK schemes with software to run on real-time payments networks.
| Company Acquired by Mastercard | Application | Acquisition Costs ($ mln) |
| Finicity | Banking Technology | 825 |
| RiskRecon Inc. | Internet Software and Services | n/a |
| SessionM Inc. | Internet Software and Services | 215 |
| Nets A/S | Banking Technology | 3,188.6 |
| Transacts Inc. | Payment Processors | n/a |
| Automatic Bank Services Ltd. | Payment Processors | 9.0 |
| Vyze Inc. | Application Software | n/a |
Source: S&P Global Market Intelligence
With two contrasting strategies deployed by Visa and Mastercard, it is tough to determine the winning strategy. Both companies have had solid growth, and with the payment market continuing to expand, both their strategies are likely to deliver. Until we see some weakness in growth in one of these 2 companies, we are going to call this a draw.
Emergence of UnionPay
We believe UnionPay to be the dark horse of card networks. Its emergence could potentially pose a threat to the Visa Mastercard duopoly. Its rise has been driven by the rapid expansion of the Chinese card payment network growing at a CAGR of 20% in the past 5 years. On top of that, the Chinese market had been restricted to overseas companies such as Visa and Mastercard until recent reforms to open up the market last year.
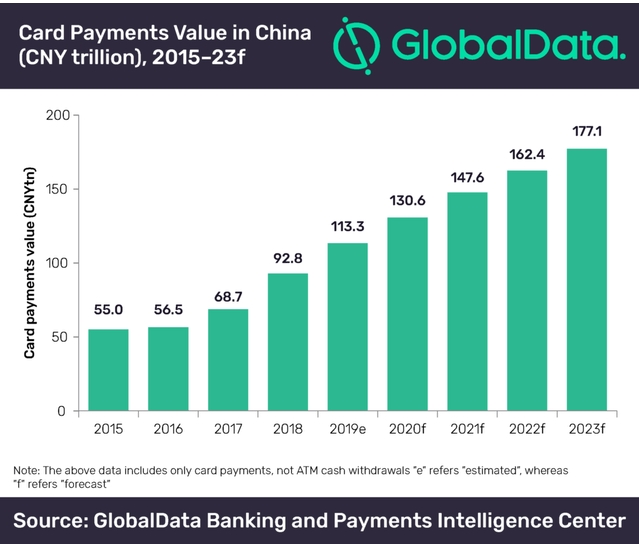
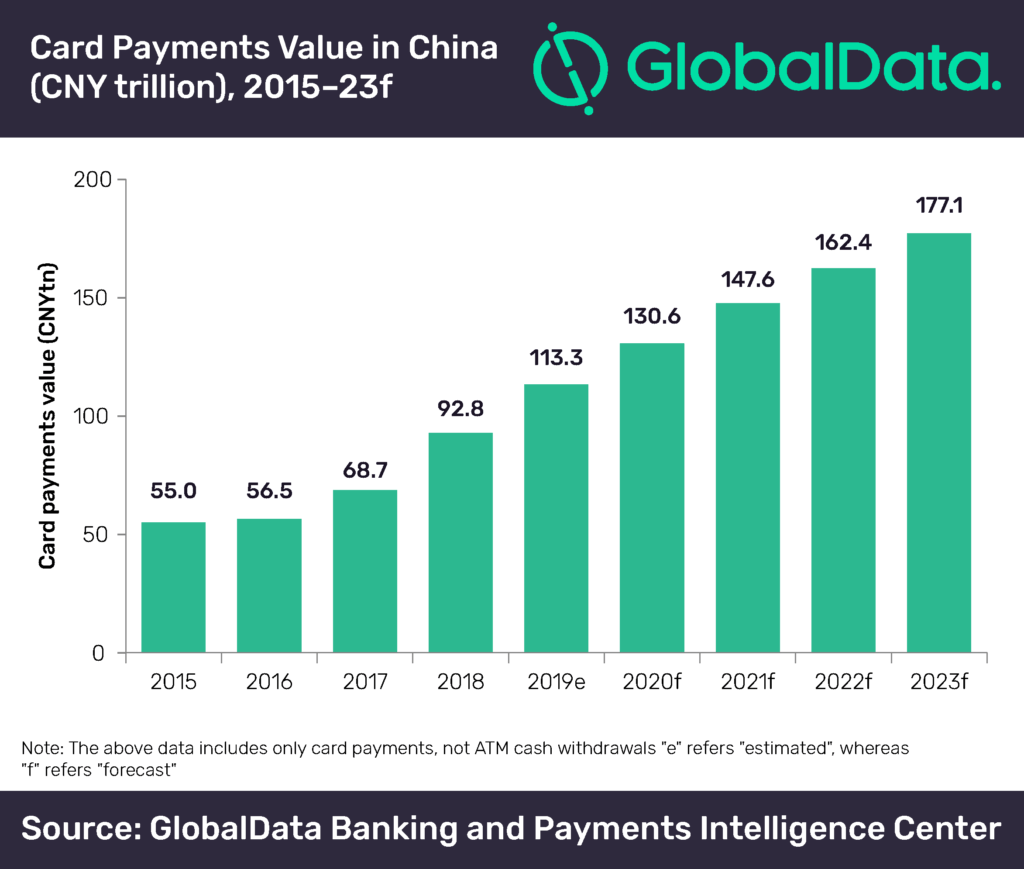
A unique characteristic of UnionPay is its affiliation with the Chinese government as a state-linked entity. The downside is that authorities have greater control over UnionPay and has directed the company to restrict overseas purchase activities by Mainland consumers in the past to curb capital outflows. According to Global Data, the Chinese cards payment market is valued at $16 tln, double that of the US and UK combined. It is forecasted to grow a further 11.8% CAGR and could be valued at $26 tln by 2023.
Source: GlobalData
Globally, UnionPay has wide merchant acceptance in 179 countries. However, the adoption of UnionPay by consumers outside China remains tepid as only 1% of cards are issued outside China. Furthermore, we believe UnionPay faces political risks as a state-linked company which limits its expansion opportunity, especially in developed markets. Due to reforms to open up the Chinese market, Visa and Mastercard have both made efforts to expand in the Chinese market.
Visa has partnered with 7 of the top 8 issuers including China Construction Bank (OTCPK:CICHY), China Merchant’s Bank (OTCPK:CIHKY), Agricultural Bank of China (OTCPK:ACGBY), and more. Meanwhile, Mastercard is also collaborating with the Bank of China (OTCPK:BACHF) after having won approval last year. That said, we remain wary of Visa and Mastercard’s ability to make a significant presence in the Chinese market, which is already dominated by UnionPay.
Convincingly, UnionPay appears as a dark horse in the card network market, but its global reach could be limited. However, the clout of the Chinese government cannot be ignored as no other country has the ability to mobilise state-owned enterprises at as scale the Chinese government can. That said, UnionPay could perhaps pose a threat to the Visa and Mastercard duopoly as the elephant in the room.
Valuation
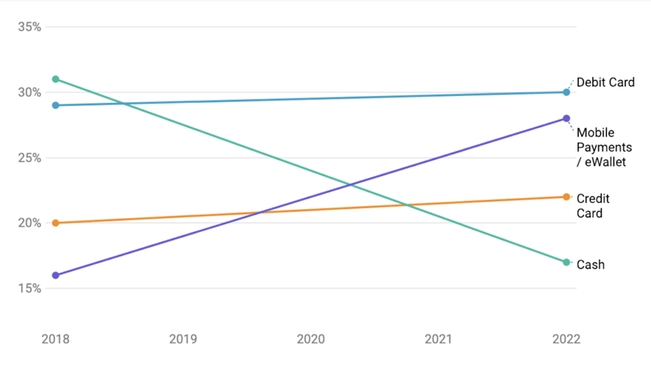
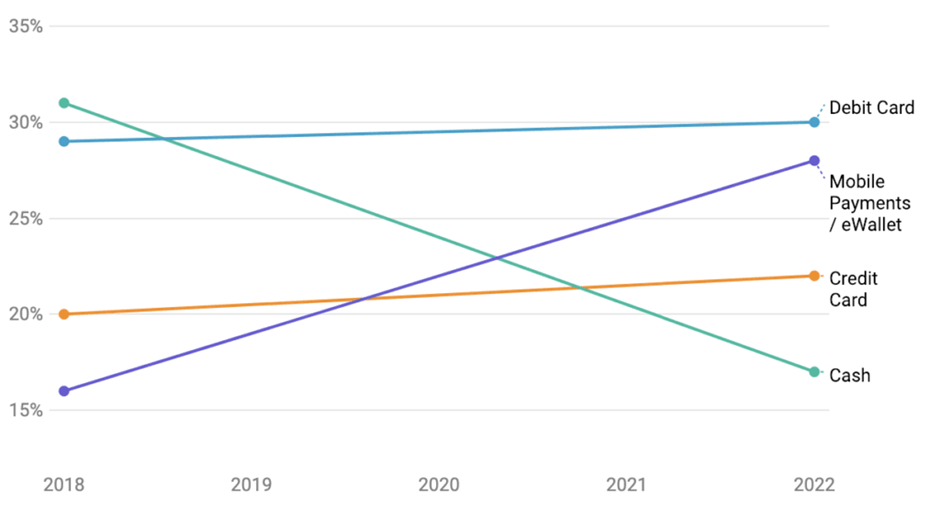
As discussed, Visa and Mastercard derive revenues from transaction-based and volume based-revenues. Firstly, we forecasted the growth of the number of global card transactions. According to Capgemini, the number of non-cash transactions globally is projected to increase to 1.1 tln in 2023 from 0.7 tln in 2019. Throughout the period, debit and credit cards are expected to maintain their share of payments of methods from Merchant Savvy. However, mobile payments or eWallets are gaining a greater share of non-cash transactions. These forms of payment methods compete with card payments, though Visa and Mastercard are also seeking to enter the market with contactless payments. That said, mobile wallet providers could bypass card payment networks altogether as a threat to Visa and Mastercard.
Source: Merchant Savvy
Accounting for the rise of mobile wallets, we derived the global number of card transactions growth rate by proportioning the overall non-cash transaction growth to the share of card-based payments. We used this projection as Visa and Mastercard’s transaction-based revenues growth forecasts.
| Global Number of Card Transactions Growth | 2019 | 2020F | 2021F | 2022F | 2023F |
| Number of Non-Cash Transactions (‘bln’) (‘a’) | 708.5 | 766.1 | 839.5 | 946.9 | 1093.9 |
| Credit and Debit Card Share (‘b’) | 50.0% | 51.0% | 52.0% | 53.0% | 55.0% |
| Mobile Wallets Share (‘c’) | 17.0% | 22.0% | 26.0% | 29.0% | 31.0% |
| Credit and Debit Card Transactions (‘bln’) (‘d’) | 528.7 | 535.2 | 559.7 | 612.0 | 699.6 |
| Global Number of Card Transactions Growth | 1.2% | 4.6% | 9.4% | 14.3% |
*(‘d’)=[a*b/(b+c)]
Source: Merchant Savvy, Capgemini
Next, we forecasted their volume-based revenues based on the total card network payment volumes and global consumer spending forecasts. By 2025, global consumer spending is expected to $72 tln at a CAGR of 4.8%. However, we anticipate a recovery in consumer spending after the contraction in 2020 of 8.6% as vaccine rollout began since 2021, but a full recovery would likely be prolonged in the following year as countries return to lockdowns.
| Global Consumer Spending Growth Forecasts | 2020F | 2021F | 2022 | 2023 | 2024 | 2025 | Average CAGR |
| Global Consumer Spending ($ tln) | 49.6 | 53.3 | 60.0 | 64.2 | 67.8 | 72 | – |
| Global Consumer Spending Growth % | -8.60% | 7.50% | 12.50% | 7.00% | 5.60% | 4.80% | 4.80% |
Source: Iorma
Based on this, we estimated the aggregate global transaction volumes and assumed it grows at the rate of consumer spending. Then, we calculated the total transaction volumes for cards based on the share of card payments above.
| Transaction Volumes in $ | 2019 | 2020F | 2021F | 2022F | 2023F |
| Aggregate Global Transaction Volumes ($ bln) | 68,760 | 62,847 | 67,560 | 76,005 | 81,326 |
| Global Consumer Spending Growth | -8.60% | 7.50% | 12.50% | 7.00% | |
| Card Transaction Volumes ($ bln) | 34,380 | 32,052 | 35,131 | 40,283 | 44,729 |
| Card Transaction Volume Growth % | -6.77% | 9.61% | 14.66% | 11.04% |
Source: Visa, NilsonReport, Iorma
Thus, we are seeing a market wide recovery in card transaction volumes. But for Visa and Mastercard, their transaction volumes are expected to grow at a higher rate. This follows an expected decline in their market shares in 2020 as Visa and Mastercard transaction volumes could fall by 5% and 14% respectively due to the impact of their cross-border volumes.
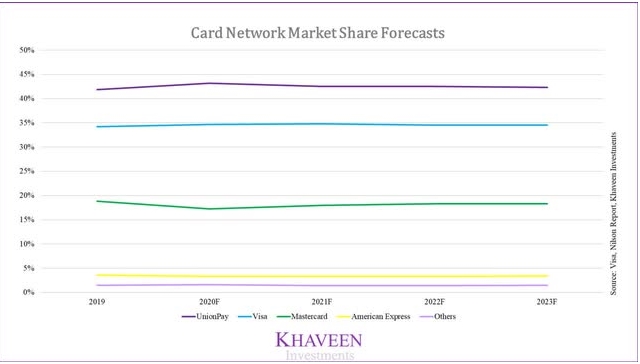
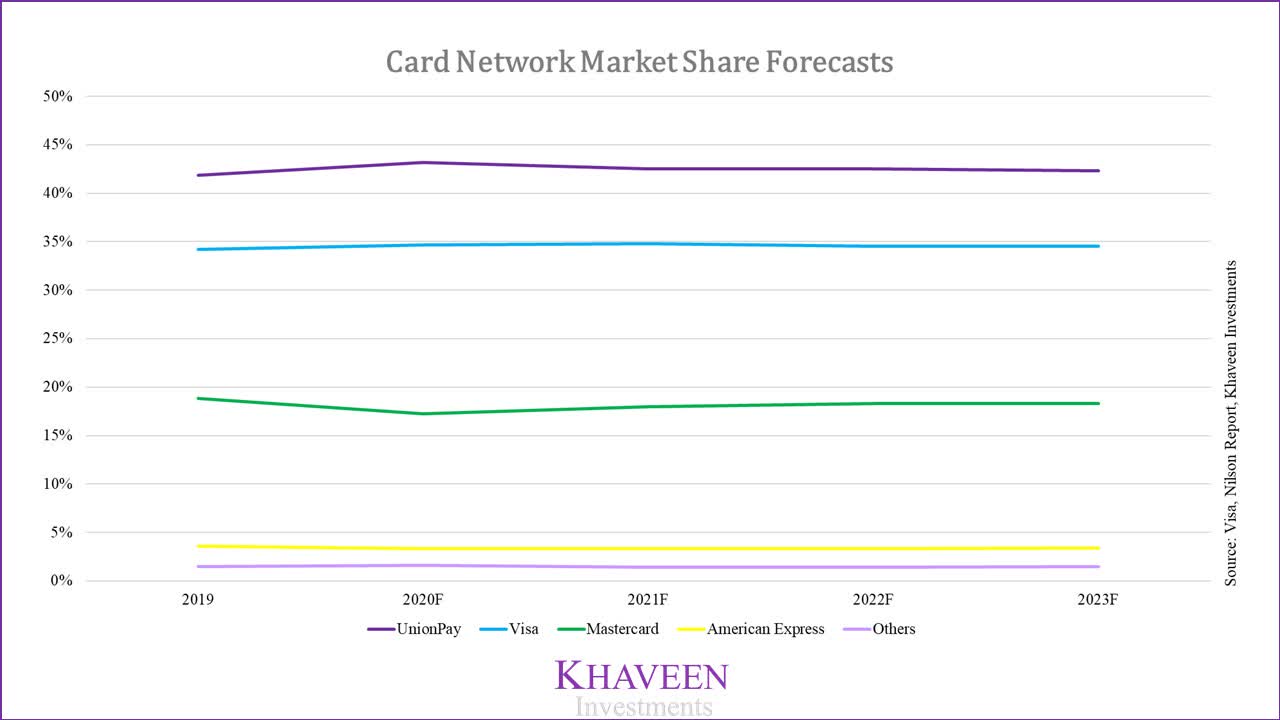
Source: Visa, NilsonReport, Khaveen Investments
Based on its market share of card transaction volume forecasts, we obtained the transaction volumes for Visa and Mastercard which shows a recovery in volumes starting from 2021.
| Visa and Mastercard Transaction Volumes ($ bln) | 2019 | 2020F | 2021F | 2022F | 2023F |
| Visa Transaction Volume ($ bln) | 11,757 | 11,110 | 12,226 | 13,897 | 15,431 |
| Visa Transaction Volume Growth % | -5.5% | 10.0% | 13.7% | 11.0% | |
| Mastercard Transaction Volume ($ bln) | 6,468 | 5,537 | 6,324 | 7,372 | 8,185 |
| Mastercard Transaction Volume Growth % | -14.4% | 14.2% | 16.6% | 11.0% |
Source: Visa, NilsonReport, Khaveen Investments
Applying our number of transaction growth and transaction volume growth, we forecasted Visa’s revenues based on its breakdown by transaction and volume. For other revenues, we based our assumption its average 5-year growth rate of 12.5%.
| Visa Revenue Forecasts ($ mln) | 2020 | 2021F | 2022F | 2023F |
| Transaction-based revenues | 10,975 | 11,476 | 12,550 | 14,345 |
| Transaction-based revenues growth % | 4.6% | 9.4% | 14.3% | |
| Volume-based revenues | 16,103 | 17,719 | 20,143 | 22,366 |
| Volume-based revenues growth % | 10.0% | 13.7% | 11.0% | |
| Other value-added services | 1,432 | 1,611 | 1,812 | 2,039 |
| Other value-added services growth % | 12.50% | 12.50% | 12.50% | |
| Visa Gross Revenues | 28,510 | 30,807 | 34,505 | 38,750 |
| Visa revenue growth % | 8.1% | 12.0% | 12.3% |
Source: Visa, Khaveen Investments
For Mastercard, we applied its derived revenue projections on its revenue breakdown. For the other revenues, we assumed a growth rate of 17.2%, which is the segment’s 5-year average growth rate.
| Mastercard Revenue Forecasts ($ mln) | 2020F | 2021F | 2022F | 2023F |
| Transaction-based revenues | 8,469 | 8,856 | 9,685 | 11,070 |
| Transaction-based revenues growth % | 4.6% | 9.4% | 14.3% | |
| Volume-based revenues | 10,069 | 11,501 | 13,407 | 14,887 |
| Volume-based revenues growth % | 14.2% | 16.6% | 11.0% | |
| Other value-added services | 4,381 | 5,135 | 6,018 | 7,053 |
| Other value-added services growth % | 17.20% | 17.20% | 17.20% | |
| Gross revenues | 22,920 | 25,492 | 29,110 | 33,010 |
| Mastercard revenue growth % | 11.2% | 14.2% | 13.4% |
Source: Mastercard, Khaveen Investments
Discounted Cash Flow
Both companies have formidable FCF, thus we applied a DCF analysis for our valuation. For the comparable companies within the card networks industry, we only selected Visa and MasterCard as both have unique advantages as dominant global leaders operating on a massive scale. The card network industry has an average EV/EBITDA of 35.76x.
For Visa, we applied the card network payment volume growth as revenue projections. Based on a discount rate of 11.1% (company’s WACC), our model shows an upside of 10.67%.
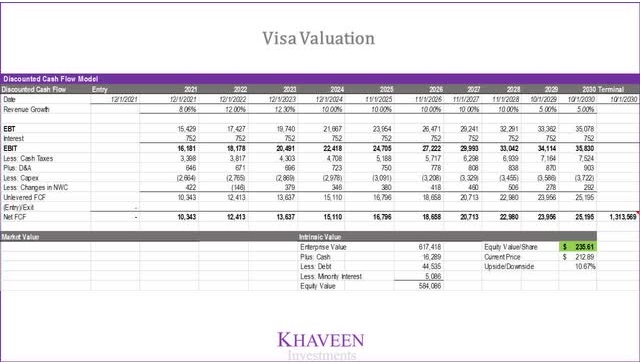
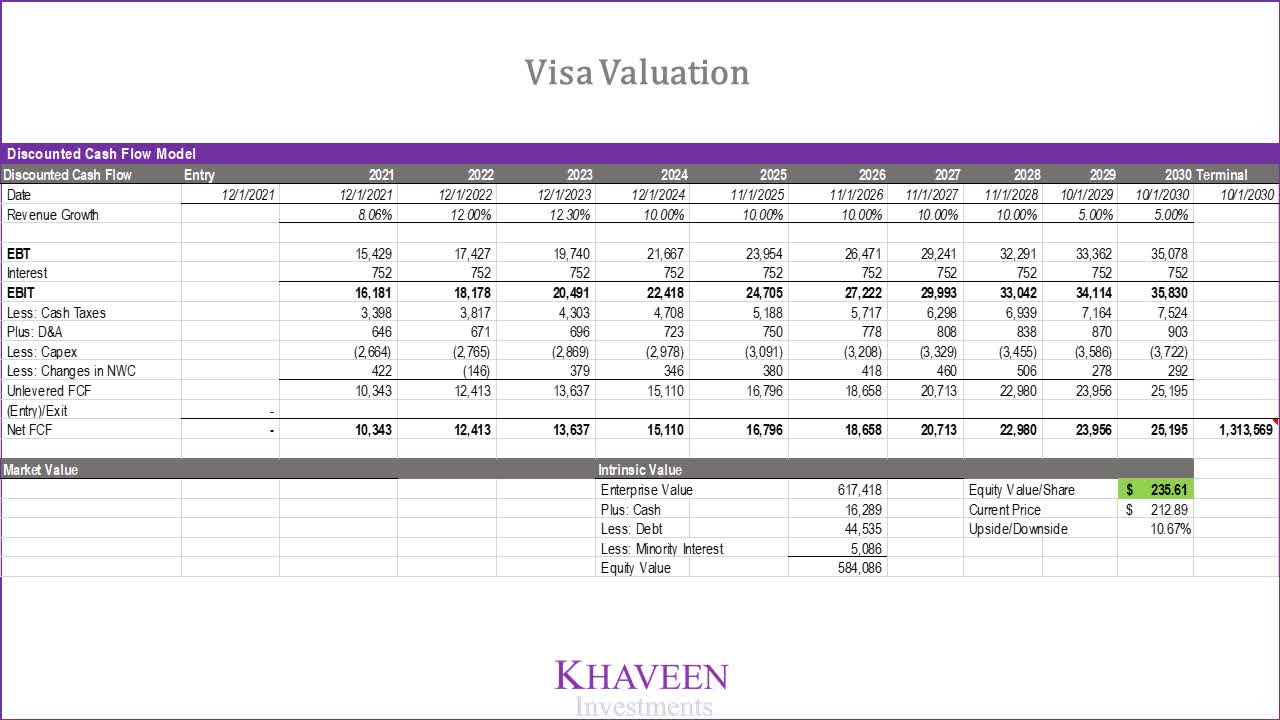
Source: Khaveen Investments
For Mastercard, we applied its revenue growth projections calculated above but tapering off from 2023. Based on a discount rate of 12.8% (company’s WACC), our model shows an upside of 9.46%.

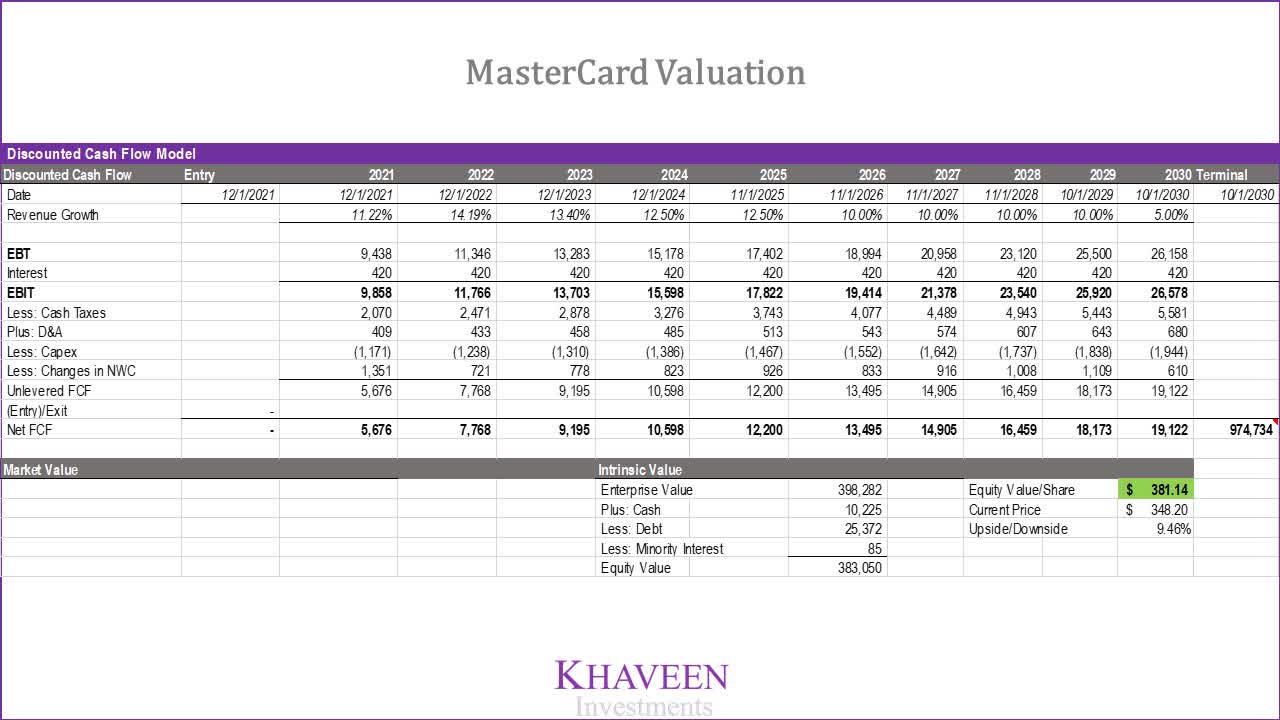
Source: Khaveen Investments
With both companies having similar upsides of around 10%, we are calling this a draw.
Verdict
Visa and Mastercard are synonymous with payments and are recognized globally. They facilitate card payments through a four-party model and operate on a tremendous scale with processing $18 tln of payment volumes with a market share of 54% combined.
Both companies have solid financials, but we believe Mastercard has an edge over Visa, with higher revenue growth and free cash flow margins. Visa, on the other hand, has stronger partnerships with large issuers such as JPMorgan and Bank of America, which could provide better expansion opportunities. Visa’s dominant scale is attributed to its long-standing relationships with leading issuing banks. And the higher transaction value per card for Visa is advantageous for it to remain the primary choice for banks.
In terms of strategy, Visa is expanding with Visa Direct to enable faster payments and is utilized by major P2P providers. Meanwhile, Mastercard is seeking to unlock the B2B market opportunity with its acquisitions. Both companies’ strategy seems to be paying off continuous revenue growth for both companies.
In terms of market share, Visa leads Mastercard, but UnionPay trounces both of them. Despite the rise of UnionPay, we remain optimistic on Visa and Mastercard as leading global card networks, which benefit from tailwinds including the secular shift away from cash and recovery in global consumer spending. Topping off our analysis, both companies have similar valuation upsides of around 10%. This leads us to conclude that both companies are very close investment opportunities and we are indifferent in the choice between the two.
Overall, we rate Visa as a Buy with a target price of $235.61 and Mastercard as a Buy with a target price of $381.14.
www.hurleyinvestments.comwww.myhurleyinvestment.comwww.KevinMhurley.com