Trade Findings and Adjustments 01-14-2019
https://en.wikipedia.org/wiki/Pivot_point_(technical_analysis)
In financial markets, a pivot point is a price level that is used by traders as a possible indicator of market movement. A pivot point is calculated as an average of significant prices (high, low, close) from the performance of a market in the prior trading period. If the market in the following period trades above the pivot point it is usually evaluated as a bullish sentiment, whereas trading below the pivot point is seen as bearish.
It is customary to calculate additional levels of support and resistance, below and above the pivot point, respectively, by subtracting or adding price differentials calculated from previous trading ranges of the market.
A pivot point and the associated support and resistance levels are often turning points for the direction of price movement in a market.[1][page needed] In an up-trending market, the pivot point and the resistance levels may represent a ceiling level in price above which the uptrend is no longer sustainable and a reversal may occur. In a declining market, a pivot point and the support levels may represent a low price level of stability or a resistance to further decline.
Calculation
Several methods exist for calculating the pivot point (P) of a market. Most commonly, it is the arithmetic average of the high (H), low (L), and closing (C) prices of the market in the prior trading period:
P = (H + L + C) / 3.
Sometimes, the average also includes the previous period’s or the current period’s opening price (O):
P = (O + H + L + C) / 4.
In other cases, traders like to emphasize the closing price, P = (H + L + C + C) / 4, or the current periods opening price, P = (H + L + O + O) / 4.
Support and resistance levels
Price support and resistance levels are key trading tools in any market. Their roles may be interchangeable, depending on whether the price level is approached in an up-trending or a down-trending market. These price levels may be derived from many market assumptions and conventions. In pivot point analysis, several levels, usually three, are commonly recognized below and above the pivot point. These are calculated from the range of price movement in the previous trading period, added to the pivot point for resistances and subtracted from it for support levels.[4]
The first and most significant level of support (S1) and resistance (R1) is obtained by recognition of the upper and the lower halves of the prior trading range, defined by the trading above the pivot point (H − P), and below it (P − L). The first resistance on the up-side of the market is given by the lower width of prior trading added to the pivot point price and the first support on the down-side is the width of the upper part of the prior trading range below the pivot point.
- R1= P + (P − L) = 2×P − L
- S1= P − (H − P) = 2×P − H
Thus, these levels may simply be calculated by subtracting the previous low (L) and high (H) price, respectively, from twice the pivot point value:[5]
The second set of resistance (R2) and support (S2) levels are above and below, respectively, the first set. They are simply determined from the full width of the prior trading range (H − L), added to and subtracted from the pivot point, respectively:
- R2= P + (H − L)
- S2= P − (H − L)
Commonly a third set is also calculated, again representing another higher resistance level (R3) and a yet lower support level (S3). The method of the second set is continued by doubling the range added and subtracted from the pivot point:
- R3= H + 2×(P − L) = R1 + (H − L)
- S3= L − 2×(H − P) = S1 − (H − L)
This concept is sometimes, albeit rarely, extended to a fourth set in which the tripled value of the trading range is used in the calculation.
Qualitatively, the second and higher support and resistance levels are always located symmetrically around the pivot point, whereas this is not the case for the first levels, unless the pivot point happens to divide the prior trading range exactly in half.
Trading tool
The pivot point itself represents a level of highest resistance or support, depending on the overall market condition. If the market is directionless (undecided), prices may fluctuate greatly around this level until a price breakout develops. Trading above or below the pivot point indicates the overall market sentiment. It is a leading indicator providing advanced signaling of potentially new market highs or lows within a given time frame.[5]
The support and resistance levels calculated from the pivot point and the previous market width may be used as exit points of trades, but are rarely used as entry signals. For example, if the market is up-trending and breaks through the pivot point, the first resistance level is often a good target to close a position, as the probability of resistance and reversal increases greatly.
5-day pivot point chart of the SPDR Gold Trust (GLD) for intra-day trading in October 2009
Many traders recognize the half-way levels between any of these levels as additional, but weaker resistance or support areas.[5][6][page needed][citation needed] The half-way (middle) point between the pivot point and R1 is designated M+, between R1 and R2 is M++, and below the pivot point the middle points are labeled as M− and M−−.[citation needed] In the 5-day intra-day chart of the SPDR Gold Trust (above) the middle points can clearly be identified as support in days 1, 3, and 4, and as resistance in days 2 and 3.
Trades to create a portfolio from scratch
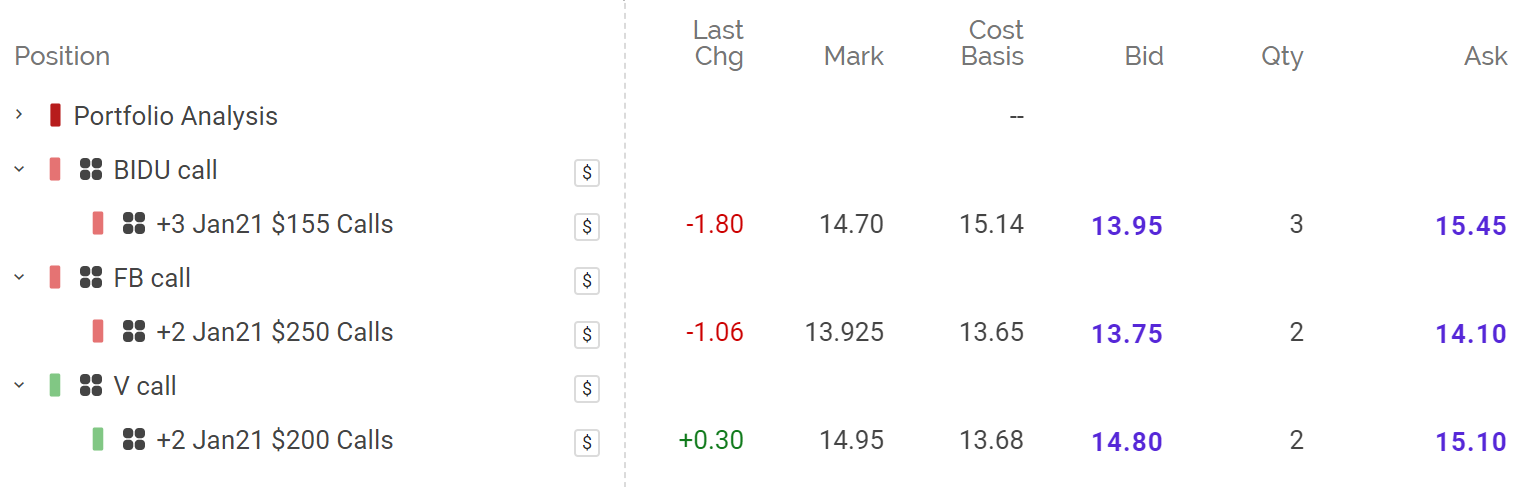
BIDU, V & FB One Year Leap Long Calls
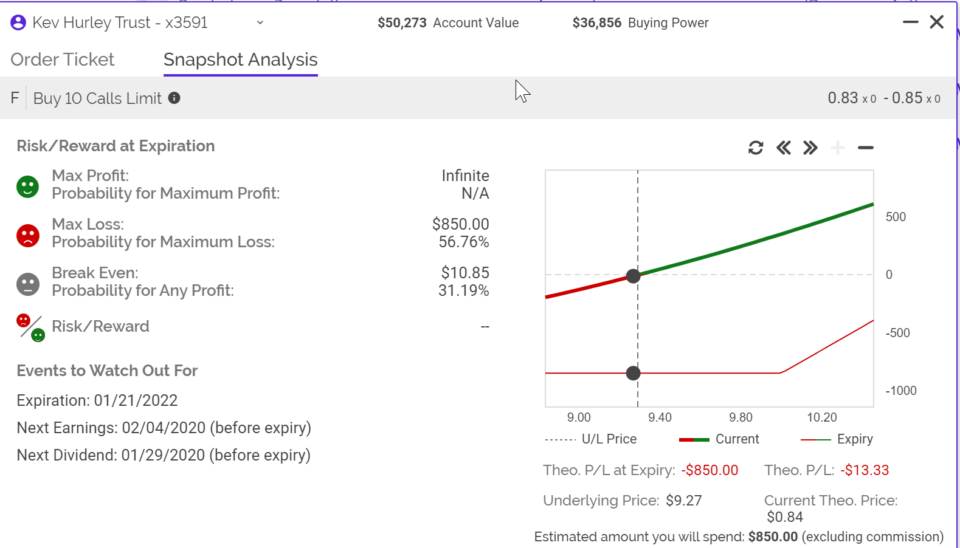
 F Leap Jan 22 $10 Calls

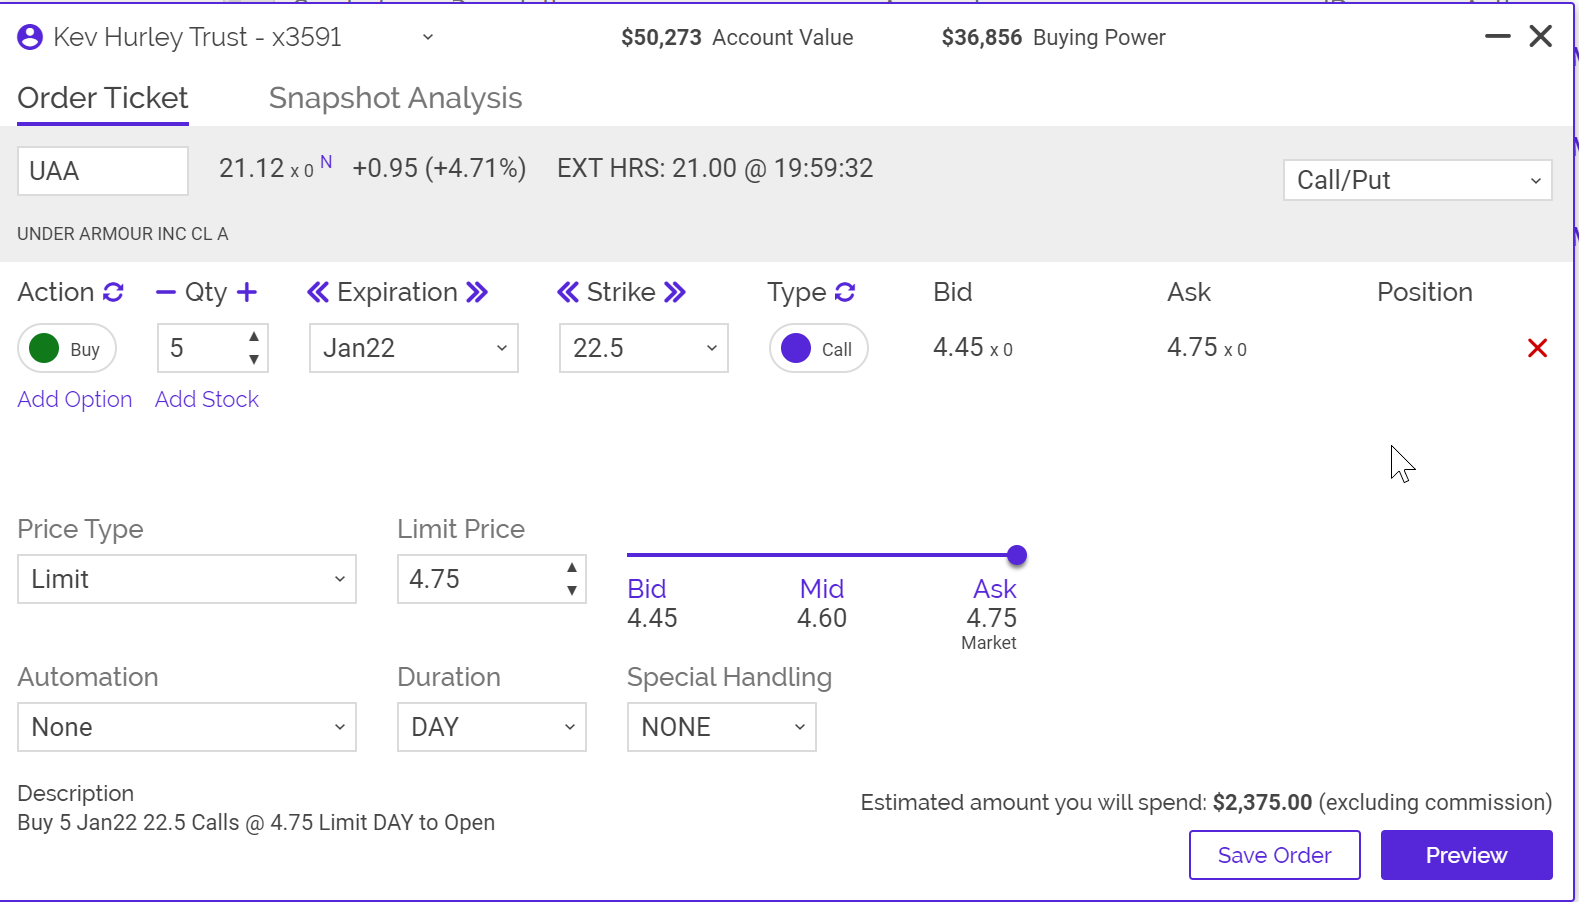
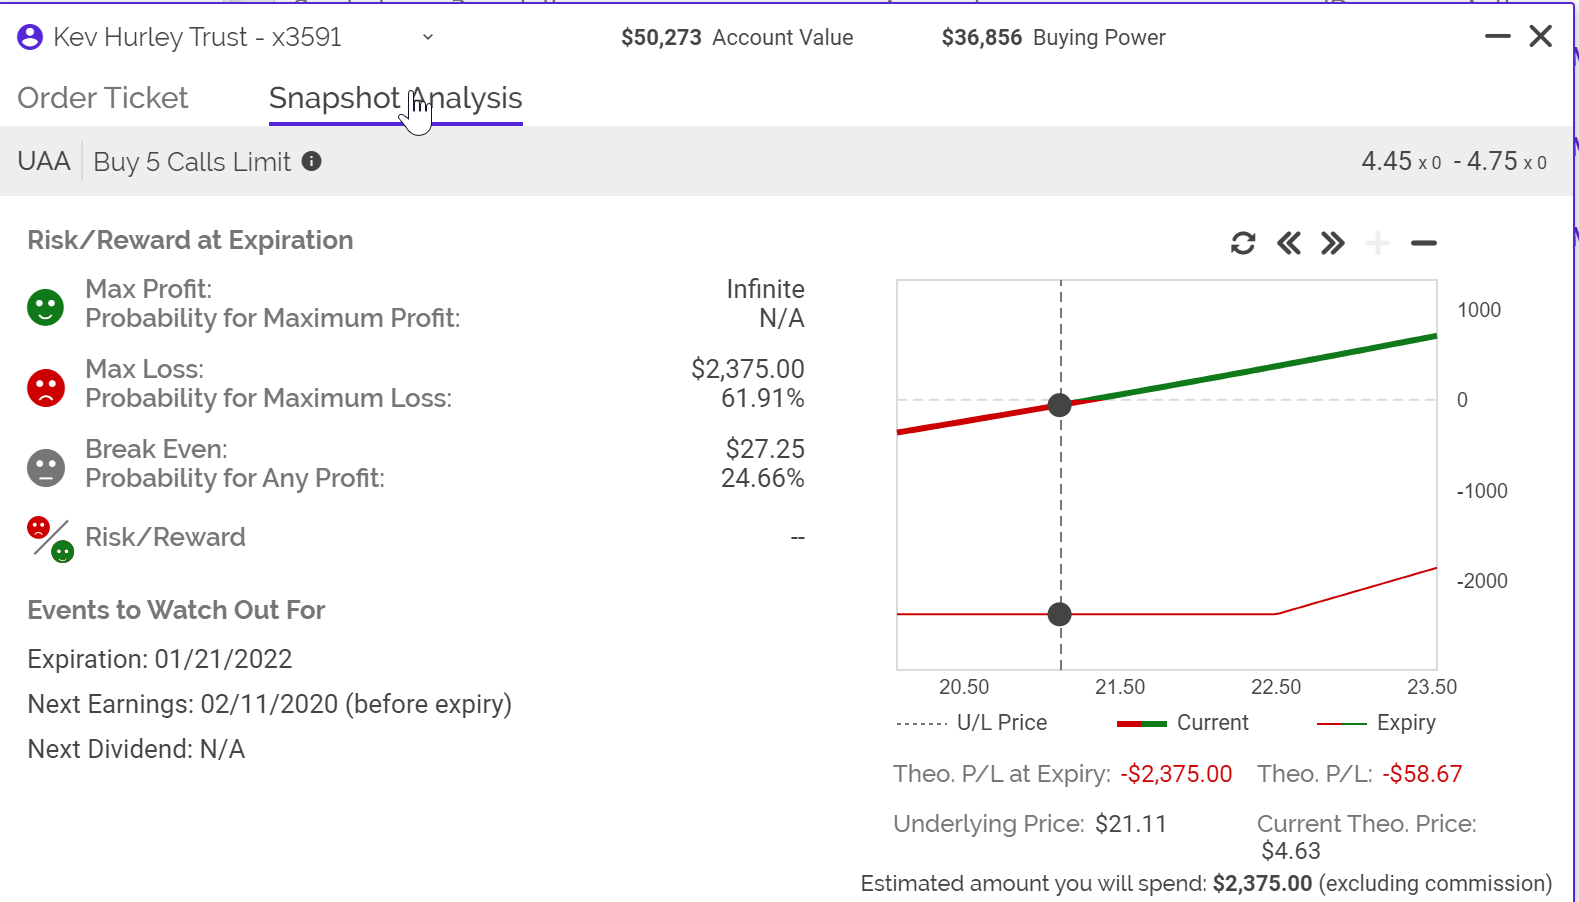
 UAA Leap Jan 22 $22.50 Calls
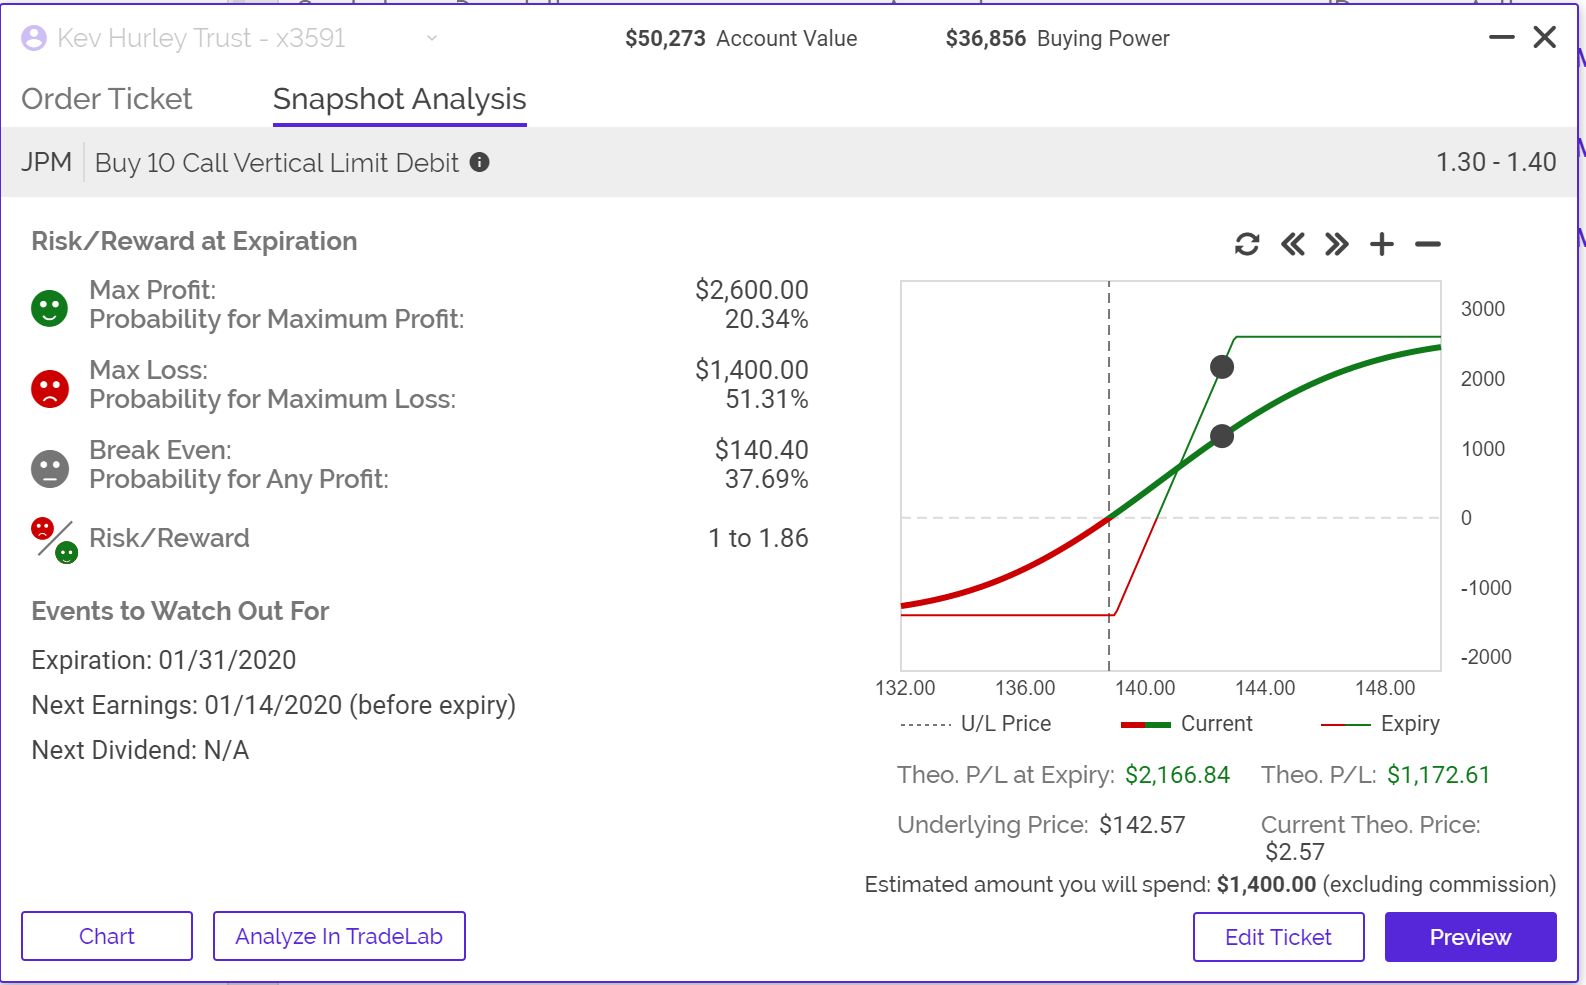
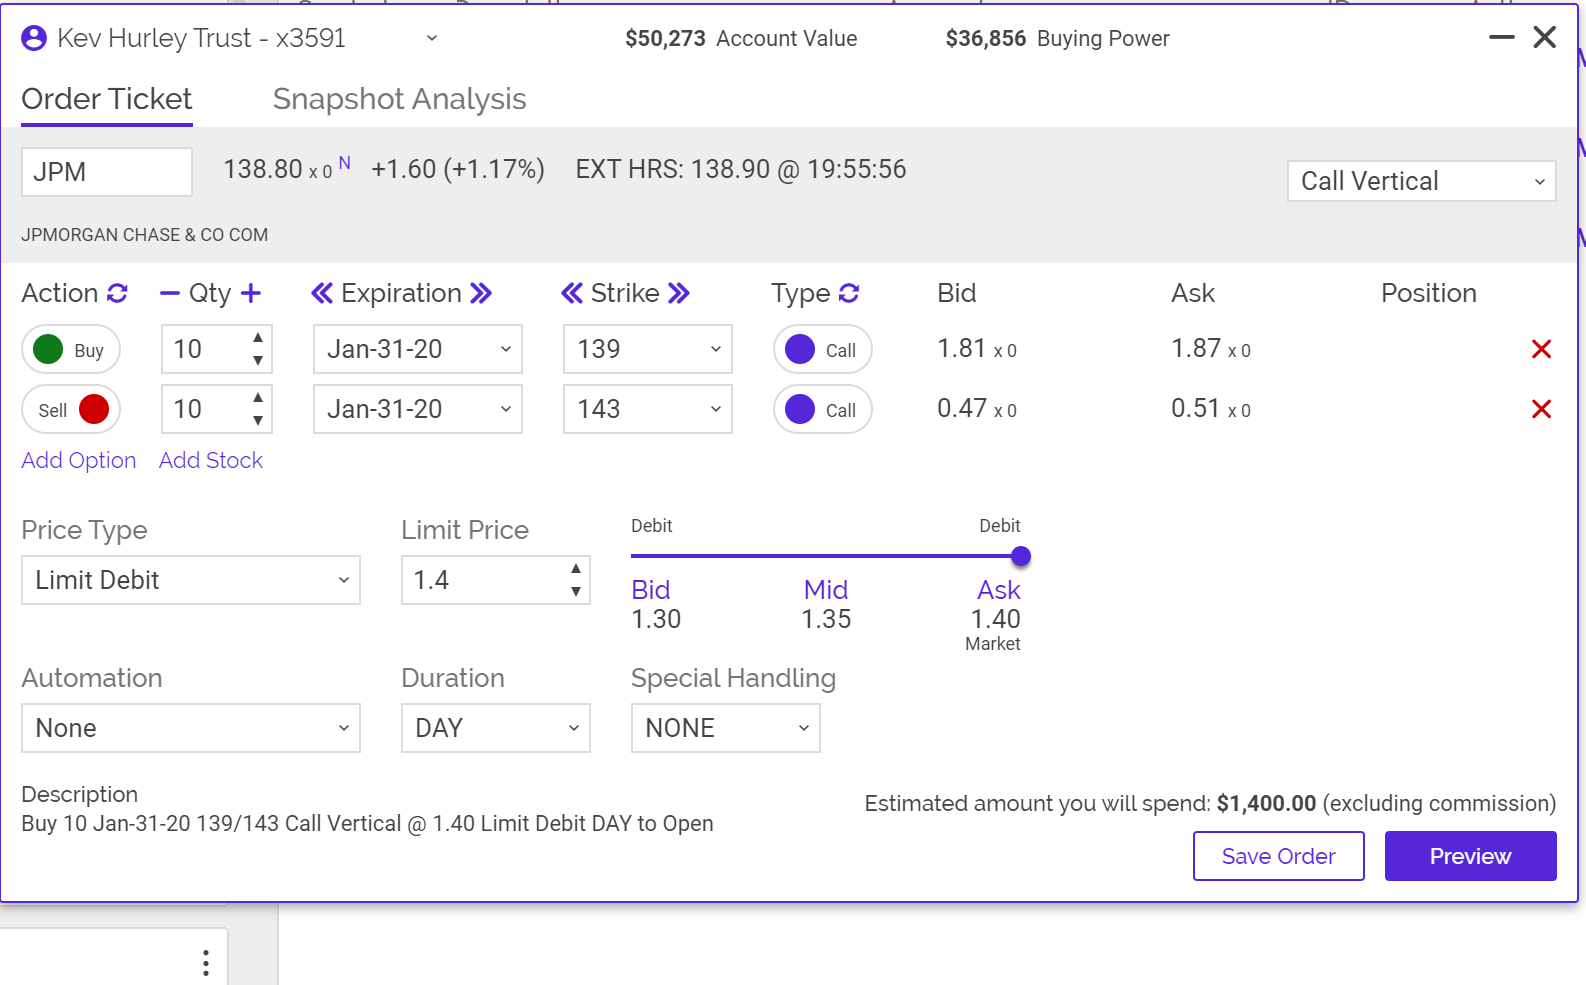
JPM Short term Bull call
139/143 Jan 31-20
Debit $1.35 = Risk in trade
Max return $4.00 – $1.35 = 2.65
R1 Pivot Point is 142.54
www.hurleyinvestments.com www.myhurleyinvestment.com www.KevinMhurley.com