
Trade Findings and Adjustments 01-06-2022
WELCOME BACK to 2022
Today is going to be a two part series on three important points of successful investing”
#1 – Work your own numbers and never take someone else work as your own
#2 – Once you’ve proven your methodology and enjoy the process
#3 – Understand we live in a variable market where averages are NOT your friend.
Successful investing is making money over a period of time
I’m ok with losing IF I am gain shares to come back later
If you show me a good loser I will show you a loser
How to Pick Stocks Using Fundamental and Technical Analysis
Fundamental and technical analysis are two common ways to sort and pick stocks. How and when to use them can be a matter of personal style, but each has its strengths.
Fundamental analysis attempts to identify stocks offering strong growth potential at a good price by examining the underlying company’s business, as well as conditions within its industry or in the broader economy. Investors have traditionally used fundamental analysis for longer-term trades, relying on metrics such as earnings per share, price-to-earnings ratio, price-to-earnings growth, and dividend yield.
Technical analysis, on the other hand, bypasses the underlying company’s fundamentals and instead looks for statistical patterns on stock charts that might foretell future price and volume moves. The idea here is that stock prices already reflect all the publicly available information about a particular company, so there’s nothing to be gained from poring over a balance sheet. Given the focus on price and volume moves, traders have traditionally used technical analysis for shorter-term trades.
But does it have to be an either/or proposition?
Which type of analysis is right for you?
Both forms of analysis can reveal potentially valuable information, and focusing on just one style could cause you to miss important clues about a stock’s value. And since the intended duration of a trade may change, employing both forms of analysis might be your best approach.
Why not deploy them so their strengths complement each other? Use fundamental factors to select the candidate, and technical factors to dictate the ideal entry or exit price.
First, focus on fundamentals
Investors who use fundamental analysis generally use one of two fundamentals-oriented strategies:
- Growth investors focus on the future prospects of a particular company.
- Value investors focus on whether the current stock price makes sense given the health of a particular company.
Growth investor’s strategy
Corporations are generally built to grow and turn a profit—and eventually return some of that profit to shareholders. Very few new companies are immediately profitable. But if a company reports strong revenue growth initially—even if it fails to turn a profit in its early days—growth investors may still decide it’s a good prospect for the future. When investors decide a young company has an innovative product or compelling competitive advantage, they may start to drive the stock’s price higher. The more investors who join the party, the higher the company’s stock price is likely to rise. Such investors typically focus on metrics such as a company’s historical and projected revenue growth rates when buying shares of relatively new companies.
Value investor’s strategy
Value investors seek out larger, more established companies that appear to be priced below what their revenues or earnings per share would suggest. Such investors often focus on industry-leading companies, which are generally past their peak revenue growth years, because such companies often pay steady dividends. Value stocks tend to have low price-to-earnings ratios and pay above average dividends, but trade at a price that is very low or below their book value (total tangible assets minus total liabilities). Sometimes value investing is described as investing in great companies at a good price, not simply buying cheap stocks.
Screening for growth or value
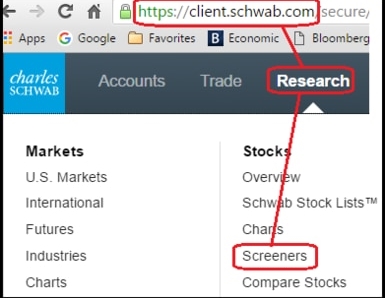
Schwab clients can use the stock screening tool on Schwab.com to help narrow down a collection of stocks to a manageable list of quality growth or value candidates.
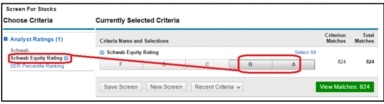
When screening for fundamental factors, consider focusing on stocks rated A or B by Schwab Equity Ratings® (SER), as these are considered “buy” candidates. In the example below, this step alone narrows the list of possible stocks from 2,800 candidates to 824 candidates.
Growth screening
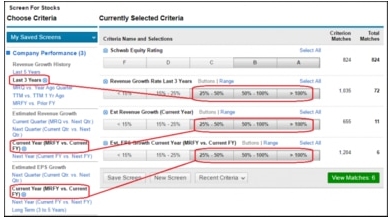
Since Schwab Equity Ratings already takes many fundamental factors into account, investors searching for growth stocks could seek out stocks that have delivered strong revenue growth in the past, and look set to deliver both strong revenue and profit growth in the future. In the example below, selecting these three additional criteria narrows the list of 824 candidates to just six.
Value screening
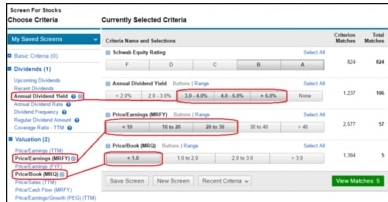
You can use several metrics when searching for value stocks, though a simple approach would be to consider those with:
In the example below, selecting these three additional criteria shrinks the list of 824 down to just five.
As you search, be wary of extremely high dividend-yielding stocks, as they might be too good to be true. On a similar note, keep in mind cheap doesn’t necessarily mean good. A low stock price could be the result of a company’s outdated products, bad management, expired patents, pending lawsuits, etc.
Once you’ve got a more manageable list of five or six, it’s time to apply some technical screens.
Technical signals
Stock selection using technical analysis generally involves three steps: stock screening, chart scanning, and setting up the trade. With stock screening, your goal is to arrive at a list of 20 or 25 candidates using a set of technical criteria. You will then try to narrow that list down to three or four candidates by scanning the charts for possible entries, or points where it could make sense to buy. Finally, you will perform a more detailed chart analysis and choose the one you’ll trade.
To illustrate this process, let’s assume you’re the kind of trader who holds a stock anywhere from a few days to a few weeks.
Screen stocks using technical analysis
To set up a screen, consider the following items:
- Price and market capitalization. This can be a good place to start as it allows you to eliminate a lot of stocks right away. For example, if you’re not interested in stocks priced over $100, you could exclude them in the screen.
- Sectors and industries. Look for strong sector and industry groups if you want to go long—that is, buy a stock with the expectation that its price will rise—and weak ones if you want to go short—which means borrowing and selling a stock whose price you think is going to fall, and then buying it back later at a lower price should it actually fall, all with the expectation that you’ll pocket the difference. (For more on this strategy, read The Ins and Outs of Short Selling.)
- Momentum. The technical trader usually wants to identify strong, up-trending stocks for potential buys and weak down-trending stocks for shorts. One way to find them is to use moving averages, which are trend-following indicators that smooth out day-to-day price movements to show a stock’s general direction over time. They can also act as support and resistance levels. Support is where downward trends tend to weaken as buying pressure overcomes selling pressure. Resistance is often where upward trends start to fizzle as selling pressure overcomes buying pressure.
A simple moving average is calculated by averaging a stock’s closing prices over a defined period. Many traders use 20 days as a starting point, but you can use different periods according to your trading style. (For more on moving averages, watch Trading Up-Close: SMA vs EMA.)
A momentum trader going long might ask, is a stock trading above its 20-day moving average? Has its 20-day moving average broken above its 50-day moving average? A trader looking to short a stock might search for one trading below its 20-day moving average, and whose 20-day moving average is below its 50-day moving average. You might narrow the list further by looking for stocks that trade at least 200,000 shares a day.
Scan charts
After compiling a list of candidates, it’s time to look for those with good entry points. Two common entry strategies are to look for breakouts in the direction of the trend—that is, stocks experiencing a sharp upward movement in price—and pullbacks, which are short-term moves in the opposite direction of the longer-term trend.
For breakouts on longs, an entry point could be the first or second new high after the stock has traded sideways for a few days. For breakouts on shorts, an entry point could be the first or second new low after a few days of sideways movement. With the pullback strategy, you’ll want to see the stock correct for a few days in the direction opposite the trend. You might then consider buying into that short-term weakness on the longs, or selling into that short-term strength on the shorts.
Trade setup
We’ll assume for the sake of discussion that you prefer pullback entries and have narrowed your choices down to two buy candidates, stock A and stock B. To choose between them, it could make sense to bring a few indicators to bear: price patterns, volume, moving averages, and an indicator called the stochastic oscillator.
Because we’re looking for pullbacks, our first task is to confirm a price change is likely to be a temporary move and not full-on reversal. Chances of a reversal are lower if the stock has pulled back to a support level, such as a moving average or an old low. We also want to know if a pullback is ending. For example, if a stock can push past the previous day’s high, it could mean the uptrend resuming.
On to our charts. We can see that both stocks A and B have pulled back and held their 20-day moving averages (the yellow lines). So far, so good.
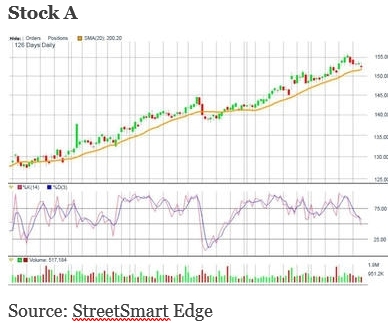
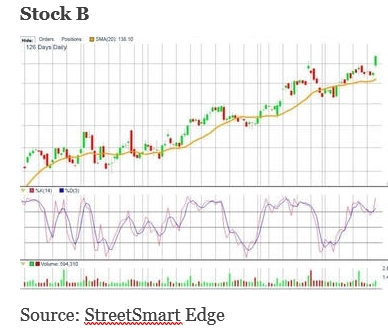
Here’s where we bring in the stochastic oscillator. Basically, this is a momentum indicator that compares a stock’s current price to its highs and lows over a given period. Values can range from 0 to 100, with a reading over 75 indicating that the stock may be “overbought” and possibly overextended on the upside. Readings under 25 indicate that the stock is “oversold” and possibly overextended on the downside. On a chart, the stochastic oscillator consists of two lines, the %K (fast line, in red in the chart above) and %D (slow line, in blue). The former is the value for the current trading session. The latter is a three-day moving average of the former.
When a stock is trading in a particular range, and the oscillator’s values move into overbought or oversold areas, look for a price reversal. However, be warned that if a stock is strongly trending in a particular direction over a long period, the values could stay in overbought or oversold territory for an extended period. In either case, it can make sense to compare the %K and %D lines. If the lines are converging or diverging, it could signal a shift in momentum is in the works.
Let’s apply this to our hypothetical trade by looking at the last trading day for each stock. We can see that stock A was unable to trade above the previous day’s high, either on an intraday or closing basis. Also, it traded in a narrow range and closed about where it opened, all signs that buyers lacked conviction.
Looking closer, the %D line indicates stock A isn’t oversold, which is good. However, the two lines haven’t crossed—as you can see, %K is still below %D. If %K had crossed %D, that would show a little more upside strength.
On a positive note, volume was relatively light: Heavy volume can be a danger sign when the stock moves in the opposite direction of the trend.
The last trading day on stock B tells a different story. The stock not only traded above the previous day’s high during the course of the trading day, it also managed to close above it. Also, it had a wide-range day with a close near the top. These are all signs that the buyers have gained control and that the pullback could be over, especially since this price action occurred on the back of higher than average volume. Also, stochastics show that neither %K nor %D are oversold, indicating strength. In addition, %K has crossed %D, which is another bullish sign. In sum: Stock B looks like the stronger candidate.
Simplify your stock selection
Stock selection doesn’t have to be difficult, but you do need to be flexible. Look for markets that are moving, but also be willing not to trade. Consider going short, as well as long. Finally, and perhaps most importantly, you need to be disciplined. Don’t let the inevitable bad trades turn into a disaster. Keep your losses small and live to trade another day.
Fundamentals CheckList
Check off 10 to 11 out of the 14
☺ Institutional Ownership 50%
☺ Average Daily Volume more than a million – Liquidity
☺ Dividend not a make or break but it does count as one of the fourteen
☺ High/Low – Extended Quote Info buying signal – 10% to high or more
☺ Debt to Equity compare to industry – zero is the best
Between industry and sector – average company
Higher than industry – bottom of barrel ???
☺ Overall Debt see above debt to equity LOOK at Cash on Hand
☺ Revenue Growth Rate Look at the 1yr., 3yr. 5 yr for revenue growth trend from 1 to 3yrs or all across the time frame
☺ Earnings Surprises how much they beat analysts expectations or how much they miss the expectation
☺ Profit Margin GROWTH compared to Industry, Sector, S&P 500
☺ P/E Ratio GROWTH compared to Industry, Sector, S&P 500
☺ PEG Ratio GROWTH compared to Industry, Sector, S&P 500
☺ Sector Growth Look on Yahoo on under company, Industry – I look for ROE % growth
☺ Rank in Industry Market Cap ranking in Yahoo under company, Industry and then click on Industry to see a market cap chart ranking
☺ Beta Compare to Industry, sector, S&P 500
I Primarily use finviz.com, etrade, google finance, yahoo.finance.com
Fundamentals CheckList – TMO $622.05 Stock Price
Check off 10 to 11 out of the 14
X Institutional Ownership 90.2%
X Average Daily Volume 1.149 – 1.4 million 10-30day ave
\ Dividend 0.17 % $1.04
X High/Low – Extended Quote Info YES 10% roughly off the highs
X Debt to Equity 0.56 reasonable
X Overall Debt 0.54 reasonable
☺ Revenue Growth Rate 26.50 to -7.52 with 5 yr 11.8
☺ Earnings Surprises moves less than 3%
X Profit Margin 29.1%
☺ P/E Ratio 29 is lower by a third
☺ PEG Ratio lower than the industry by a third
\ Sector Growth Look on Yahoo on under company, Industry – I look for ROE % growth
☺ Rank in Industry Market Cap ranking in Yahoo under company, Industry and then click on Industry to see a market cap chart ranking
? Beta 0.74 Slow mover
TOTAL NUMBERS 5 No’s 7 YES and 1 Undecided
My conclusion NO I would not invest in TMO
Possible this years stock price current pe 618.65 raise 30 PE 651.90 RIGHT NOW currently fully valued and not worth the next years purchase at this price
Ten economic trends that could define 2022
Ruchir Sharma JANUARY 2 2022
For the second year running the pandemic has reshaped the world — not changing
everything, but accelerating many things, from population decline to digital
revolution. Here is how these trends could define 2022.
Baby bust: Couples had ample opportunity but apparently lacked the desire to bring
kids into a shutdown world. Declining birth rates have been lowering global economic
growth and fell at a faster pace during the pandemic, including a dramatic drop in
China. In the long run, the baby bust will further shrink the world’s labour force.
From a slowing China to ‘greenflation’ in commodity prices, investors should take note of
these forecasts
1/4/22, 11:25 AM Ten economic trends that could define 2022 | Financial Times
https://www.ft.com/content/432d78ee-6163-402e-8950-d961b4b1312b?segmentId=6a011fbf-589d-bc42-ad70-2c406dd64285 2/4
Already, 51 countries have shrinking working-age populations, up from 17 in 2000.
Peak China: Slowed by the baby bust, rising debt and government meddling, China
accounted for one-quarter of global GDP growth in 2021, down from one-third prepandemic.
China’s increasingly sharp turn from trade to “self-reliance” is loosening its
ties to other economies. Near perfect five years ago, the correlation between GDP
growth in China and other emerging countries barely registers now. China may have
peaked as an engine of growth.
Debt trap: Having mounted for four decades, global debt grew even faster during the
pandemic, driven by government borrowing. Twenty-five countries including the US
and China have total debt above 300 per cent of GDP, up from none in the mid-1990s.
Money printed by central banks continues to inflate financial markets and deepen the
debt trap. It is clear that societies addicted to debt find it tough to cut back for fear of
bankruptcies and contagion.
Not the 1970s: Fewer workers, more government spending and rising public debt all
point to higher inflation — but possibly not to the double-digit levels of the 1970s, as
some pundits fear. Government spending should ease in 2022 and technological
changes will continue to put a lid on prices. The bigger risk is asset prices. Financial
markets have grown to four times the size of the global economy, and when markets
crater, deflation often follows.
Greenflation: It’s well known that the fight against global warming is raising
demand for green metals such as copper and aluminium; less well known is that green
politics is reducing raw material supplies of all kinds. Investment in mines and
oilfields has dropped sharply over the past five years. The result is “greenflation” in
commodity prices, which just saw their biggest yearly increase since 1973.
Productivity paradox: Hope has vanished that rapid adoption of digital services
during the pandemic would end the long decline in global productivity growth. A
2020 surge was confined to the US, and petered out late last year. The evidence so far
suggests staff working from home put in longer hours with lower output. The paradox
of weak productivity despite accelerating technological change persists.
1/4/22, 11:25 AM Ten economic trends that could define 2022 | Financial Times
https://www.ft.com/content/432d78ee-6163-402e-8950-d961b4b1312b?segmentId=6a011fbf-589d-bc42-ad70-2c406dd64285 3/4
Copyright The Financial Times Limited 2022. All rights reserved.
Data localisation: The virus hit a world turning inward, with declining flows of
everything (trade, money, people) except for data. Internet traffic in 2022 is likely to
exceed all traffic up to 2016, with a twist. Defying hopes that the internet would evolve
beyond government control, authorities are blocking data from crossing borders. The
most restrictive regulations are arising in emerging countries led by China, Saudi
Arabia and India.
“Bubblets” deflate: While this has been called the era of the “everything bubble”, a
few assets do show classic bubble signs, from prices doubling in a 12-month period to
manic trading. These “bubblets” grip cryptocurrencies, clean energy, tech companies
with no earnings and Spacs. Over the past year all witnessed falls of 35 per cent or
more from the peak, a line beyond which bubbles rarely recover. A silver lining: tech
bubbles such as these often leave behind a few potentially giant survivors.
Retail cooling: Retail investors rushed into the 13th year of the global bull market
and excited late arrivals often signal the party is ending. From the US to Europe,
millions of people opened trading accounts for the first time, and many borrowed
money to buy stock at a frenzied pace. Such manias rarely last, suggesting that even if
the stock market as a whole is not at risk, the names most popular with retail
investors likely are.
Physical matters: Rising hype for the metaverse seemed to spell decline for the
physical economy, but prices say otherwise. Digital natives need physical shelter too.
Demand from millennials and Gen Z helped inflate housing markets in 2021. Future
tech does not make physical resources obsolete. Electric cars consume far more
copper than petrol cars. Behind every avatar is a human, and labour shortages are
lifting wages even in jobs most threatened by automation, such as truck driving.
Requiems for the tangible are premature.
The writer, Morgan Stanley Investment Management’s chief global strategist, is
author of ‘The Ten Rules of Successful Nations’
HI Financial Services Mid-Week 06-24-2014