
HI Market View Commentary 11-11-2019
| Market Recap |
| WEEK OF NOV. 4 THROUGH NOV. 8, 2019 |
| The Standard & Poor’s 500 index rose 0.85% this week to another record close as the financial and industrial sectors led a fairly broad climb amid continued enthusiasm over better-than-expected quarterly earnings results.
The market benchmark ended the week at 3,093.08, up from last week’s closing level of 3,066.91. The measure reached another record intraday high this week, this time at 3,097.77 on Thursday, while Friday’s closing level marks another fresh closing high. The S&P 500 is now up 23% for the year to date. The market has been reaching the new highs on improved investor sentiment as many companies’ Q3 earnings reports have been coming in better than expected while recent economic data have also shown encouraging signs. Friday, the University of Michigan’s preliminary reading of consumer sentiment for November showed a slight improvement from late October. The financial sector had the largest percentage gain of the week, up 4.0%, followed by industrials, up 3.9%. Just three sectors ended the week in the red: real estate, down 4.4%; utilities, down 3.8%; and consumer staples, down 0.5%. The financial sector’s gainers included Hartford (HIG), whose shares climbed 6.2% as the US insurance company reported Q3 results that topped Wall Street expectations. The stock received increases to its price targets from RBC Capital Markets and Morgan Stanley following the better-than-expected report. In the industrial sector, the week’s advancers included Huntington Ingalls Industries (HII), whose shares rose 9.1% on the week as the company reported Q3 diluted earnings per share that, while down from the year-earlier quarter, were still higher than the EPS consensus estimate from analysts polled by Capital IQ. The defense shipbuilding company’s Q3 revenue also came in slightly better than analysts’ mean estimate and CEO Mike Petters expressed confidence in the company’s ability to achieve shipbuilding margins of 9% to 10% in 2020. On the downside, the real-estate sector’s decliners included Ventas (VTR), which received a reduction to its price target from RBC Capital Markets to $64 from $71. The shares fell 7.0% this week. In the utilities sector, shares of Pinnacle West Capital (PNW) fell 7.6% as the company reported Q3 earnings and revenue below analysts’ mean estimates. The company also warned it doesn’t expect to reach the lower end of its full-year EPS guidance range due to milder-than-normal weather conditions. |
Where will our markets end November 2019?

If I was to look at stocks and give you a couple of thoughts
AAPL – Shocked its still going higher but I have a target price of $280
BIDU – $3 pullback , expect it to run to $135 by end of year BUT last time fell back down to $100
V – Run to $200 Damnit
DIS – good earnings waiting for Disney + numbers and for ANALysts to understand two more Billion dollar plus movies are coming out. Price target of $120
F – Back to $10
FCX – Back to $12
BA – nice run killing a rumor and being more positive than the airlines that own the 737
BAC – Holding $33 and run to $35 end of year
FB – Expecting a run to $228 or all-time highs
ZION – $60 by next quarter
Where will our markets end this week?
?????
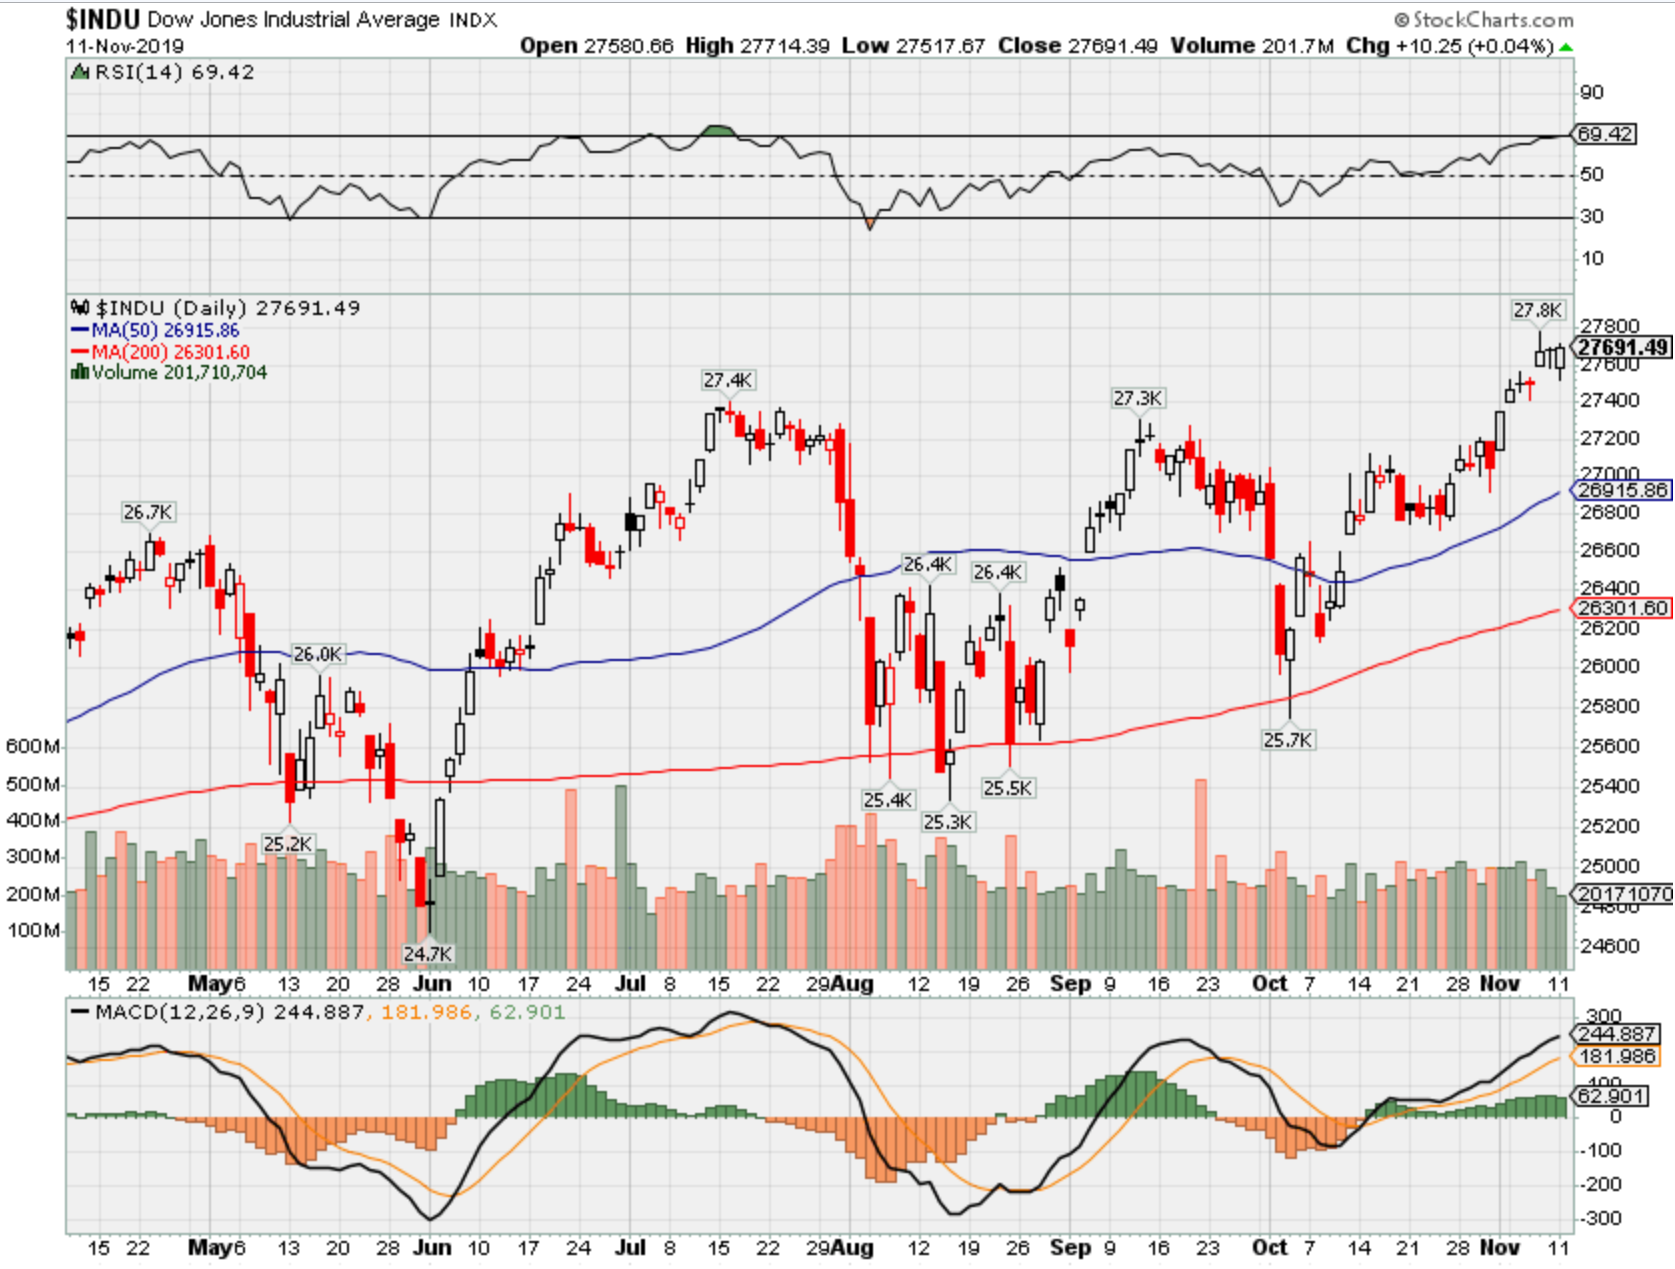
DJIA – Bullish
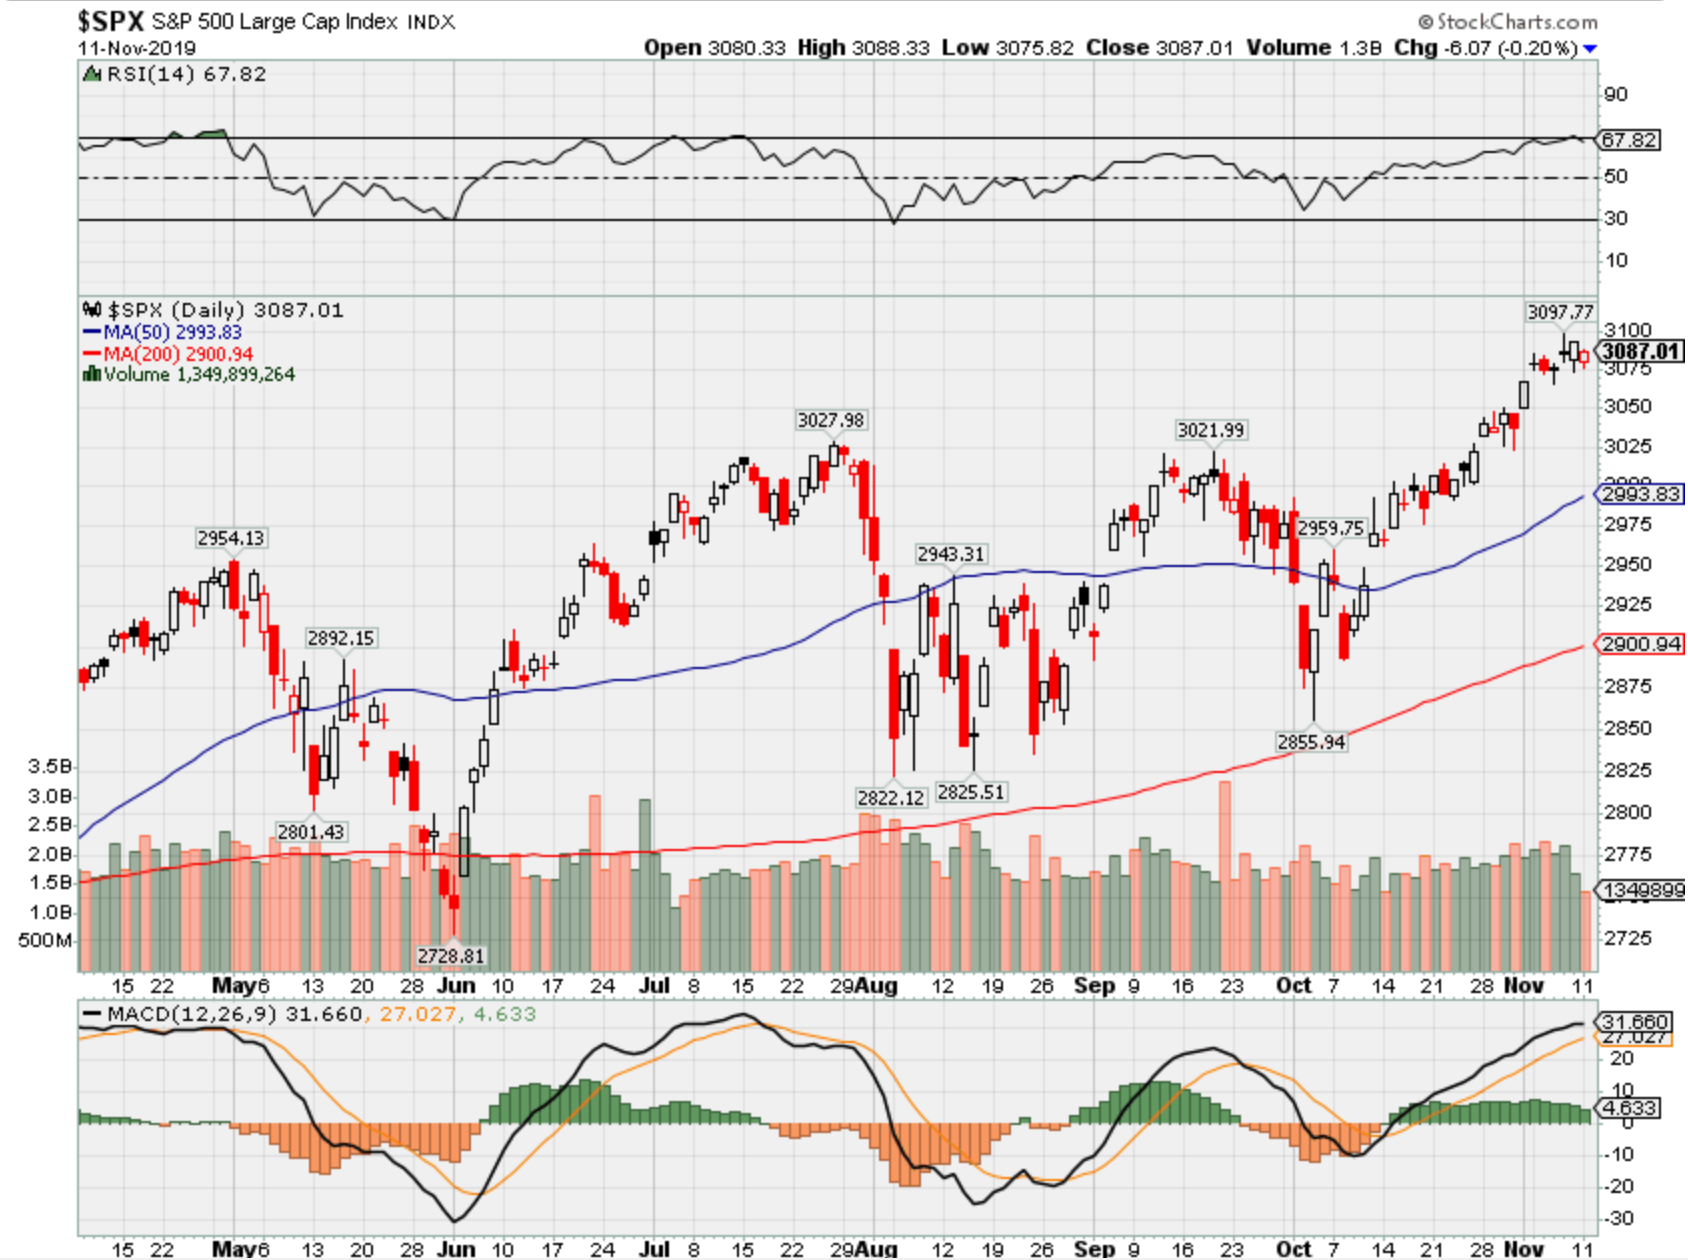
SPX – Bullish
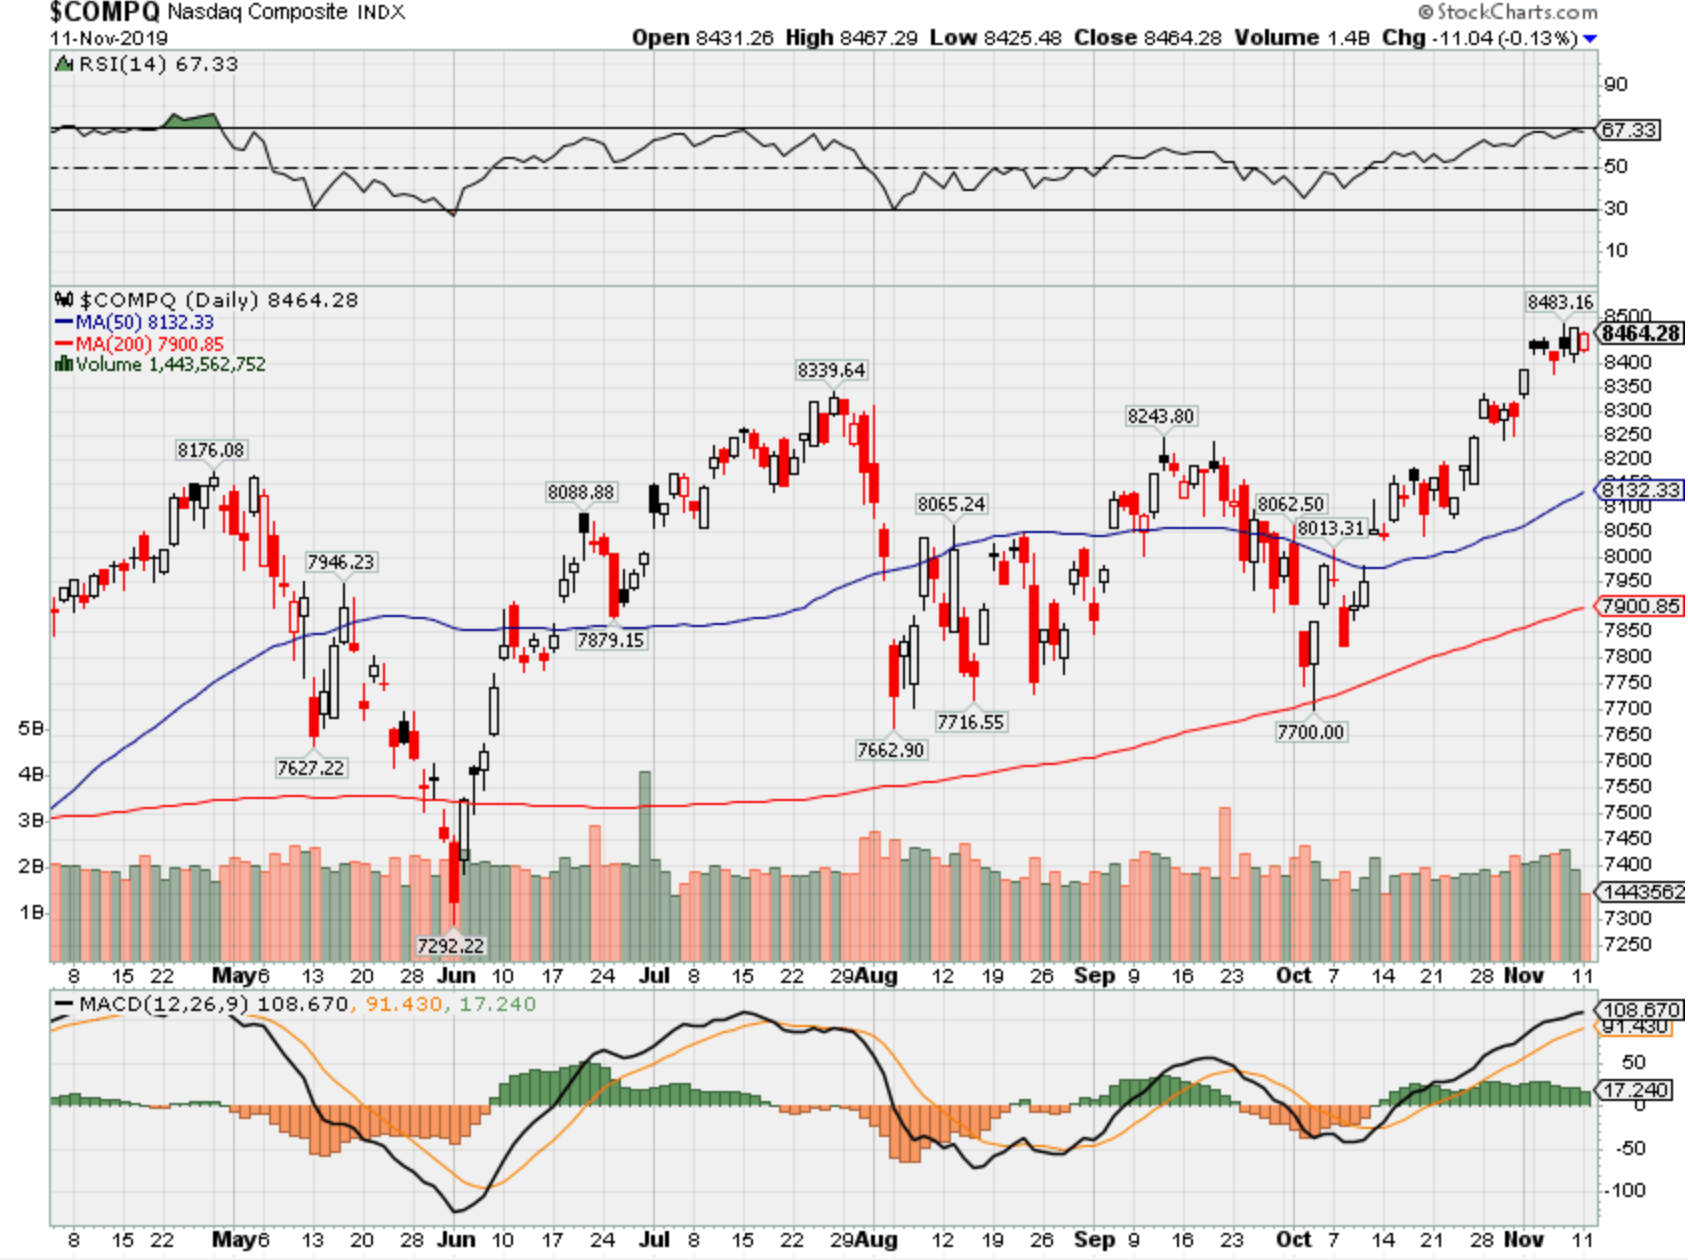
COMP – Bullish
Where Will the SPX end Nov 2019?
11-11-2019 +2.25%
11-04-2019 +2.25%
Earnings:
Mon:
Tues: AAP, CBS, DHI, DF, SWKS
Wed: BZH, CSCO, NTAP
Thur: VIAB, WB, DOS, NVDA
Fri: JCP, JD
Econ Reports:
Mon:
Tues: NIFB Small Business Optimism
Wed: MBA, CPI, Core CPI, Treasury Budget
Thur: Initial, Continuing, PPI, Core PPI
Fri: Retail Sales, Retail Ex-auto, Empire, Industrial Production, Capacity Utilization, Business Inventory
Int’l:
Mon –
Tues –
Wed –
Thursday –
Friday-
Saturday/Sunday –
How am I looking to trade?
I’m preparing for earnings = Adding long puts
AOBC – 12/05 est
MRVL 11/26 est
TGT – 11/20 BMO
www.myhurleyinvestment.com = Blogsite
support@hurleyinvestments.com = Email
Questions???
https://fastinews.com/2019/11/05/goldman-says-buy-the-under-armour-dip-long-term-thesis-intact/
Goldman says buy the Under Armour dip: ‘Long-term thesis intact’
PUBLISHED TUE, NOV 5 20198:10 AM ESTUPDATED TUE, NOV 5 20199:54 AM EST
Michael Sheetz@THESHEETZTWEETZ
Goldman Sachs is sticking with its buy rating on Under Armour, even after shares plunged following disappointing quarterly update and the revelation of a federal investigation into the apparel maker.
“We come away from results with our long-term thesis intact,” Goldman Sachs analyst Alexandra Walvis wrote in a note to investors. The firm removed the stock from its list of favorite stocks, but maintained a buy rating.
Under Armour delivered third-quarter results that beat Wall Street’s expectations on the top and bottom lines. But Under Armour cut its 2019 revenue forecast, while also confirming that the Securities and Exchange Commission and Justice Department are looking into whether the company used bad accounting practices to make its finances look healthier.
https://seekingalpha.com/article/4302359-armour-shifting-offense
Under Armour: Shifting To Offense
Nov. 4, 2019 6:44 PM ET
Summary
Under Armour sunk over 15% following news of an accounting probe.
The market is ignoring a boost to 2019 EPS targets.
The stock doesn’t trade in anticipation of major EPS expansion, leading to a $2 EPS target for 2023.
The accounting probe adds risk, but the stock valuation is already too cheap.
Under Armour (UAA, UA) is down over 15% in early trading due to news of an accounting probe and possibly disappointments over quarterly results. The market is missing strong margin improvements that fit into my investment thesis that the athletic apparel company will drive substantial valuation gains over the next five years. The accounting probe adds risks to the story, but the long-term turnaround will reward shareholders.
For Q3, Under Armour beat analyst estimates by a strong $0.05 due to higher gross margins. The company has made a focus on improving gross margins that had slipped since 2015 to unacceptable levels due to management chasing sales growth at all costs.
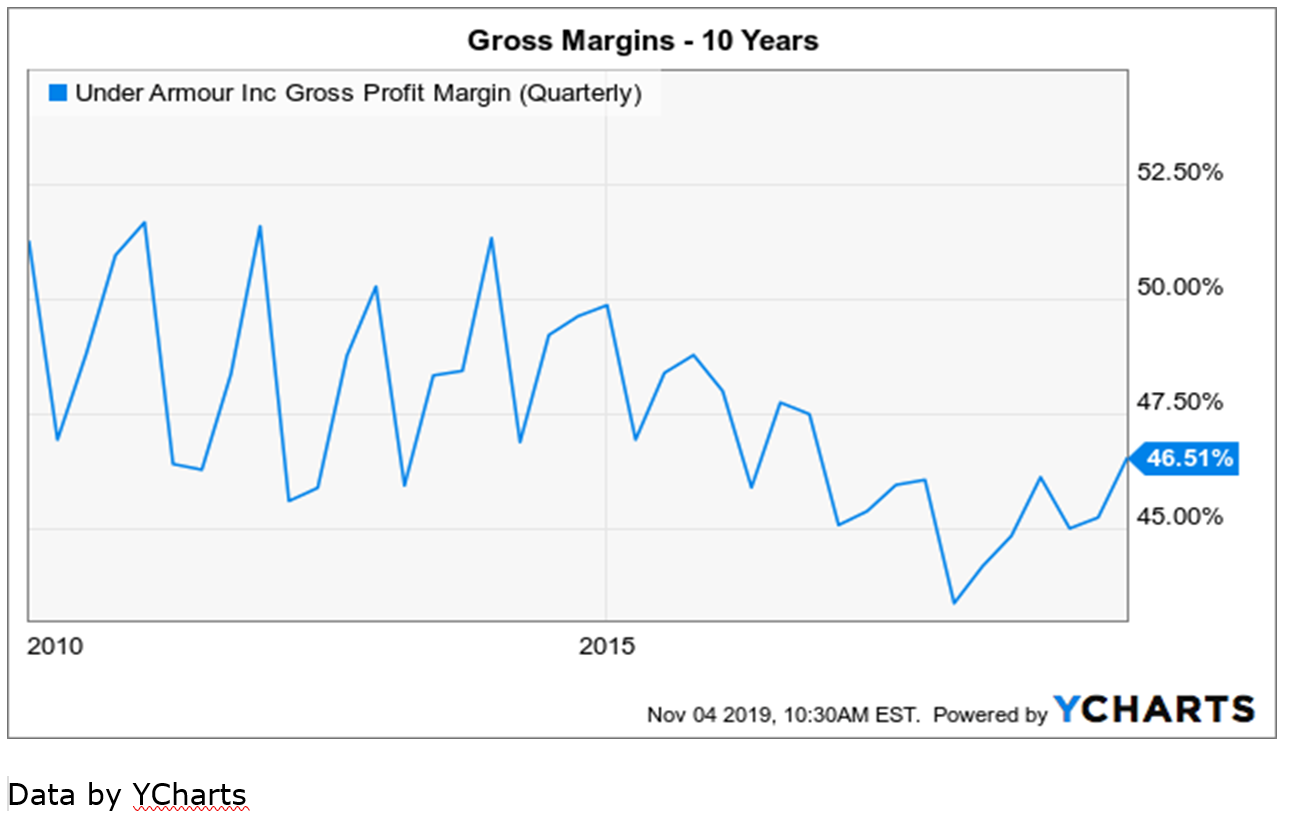
For the quarter, gross margins jumped 220 basis points to 48.3%. As the chart below highlights, the margin is the highest level since 2015. The company still has plenty of upside here with a regular ability of reaching 50% margins in the past.
The end result is substantial improvements in cash, inventory, and total debt levels. A few years ago, some investors thought Under Armour was headed to bankruptcy due to a large debt balance, but now, the company only has a net debt position of $175 million due to in large part of cutting several hundred million dollars from inventory levels.
Source: Under Armour Q3’19 earnings release
For this reason, the company forecasts beating 2019 EPS targets of $0.33 to $0.34. The exciting part is where the gross profits can head in 2020 and beyond with 5% revenue growth and 50% gross margins.
For Q3, gross profits were $690 million on revenue of $1,429 million and gross margins of 48.3%. Once Under Armour hits the above targets along with 5% revenue growth, the end result equates to revenues of $1,500 million and a gross profit of $750 million with 50% gross margins.
A minor boost in revenues will generate substantial gross profit growth by only hitting past gross margins. The additional $60 million of gross profits for Q3 alone will provide the firepower to increase sales and marketing to reinvigorate the brand.
The company still has to generate the revenue growth, but some increased offense on marketing should help on the revenue side. Next year, Under Armour will lapse the inventory reduction that has reduced the push of old inventory to the off-price market. The end result is more normalized revenue growth in 2020.
Admittedly, the real disappointment in the quarter is that SG&A expenses were up 190 basis points during the quarter to 38.5%. Revenues will work themselves out as the innovation in footwear and new apparel materials will ultimately drive growth, but the company needs to do far better in SG&A (and UA expects to ramp up marketing spend here).
As an example, both Nike (NKE) and Lululemon (LULU) have SG&A down around 33%. Under Armour only has a 2023 target of 38.0% or just slightly down from the 38.5% amount hit in Q3.
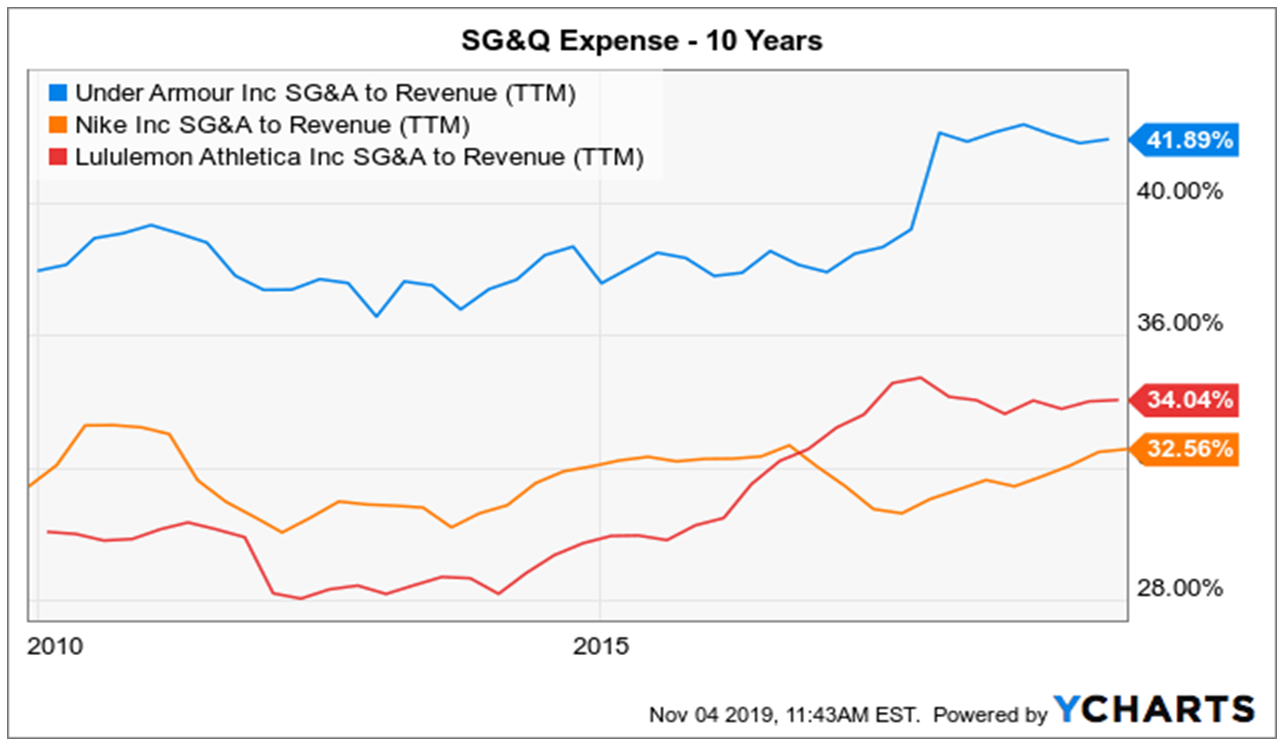
Data by YCharts
Under Armour only has the goal of 10% operating margins in 2023, and SG&A remains an area where the company can easily exceed this target. Just a 50% gross margin and a still above industry SG&A expense of 35% push the operating income up 50% to a 15% operating margin.
Key Value Metric Dips Lower
Lost in all of the noise about an accounting probe going on for an incredibly long 2.5 years is that this selloff today improves the key P/S valuation metric. The stock now trades at 1.5x sales estimates while competitors Nike and Lululemon Athletica trade at least double the multiple of Under Armour.
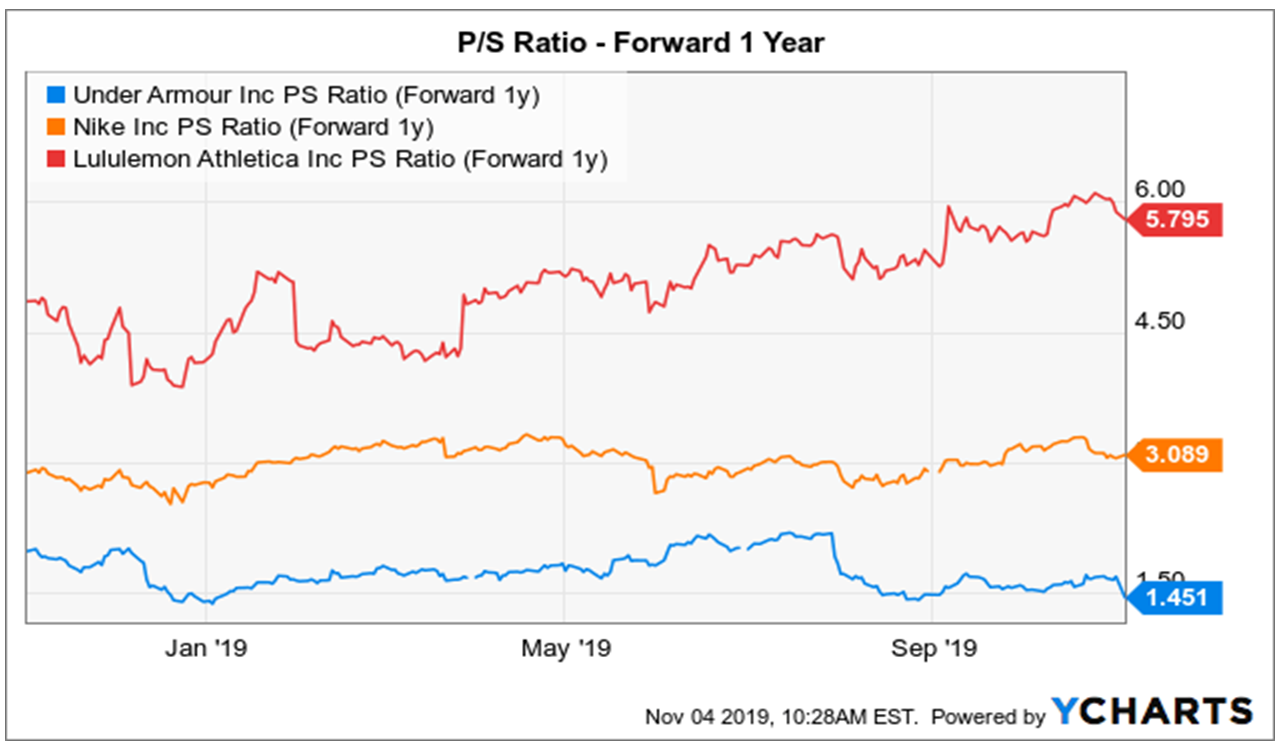
Data by YCharts
A lot of investors hate the P/S ratio, but it indicates where value exists in a sector. Under Armour needs to grow revenues in order to warrant a similar P/S multiple as the current sector leaders, if not a higher P/S ratio.
If one doesn’t believe the brand can return to solid growth that eventually tops the 7-8% targets of Nike, then the stock isn’t one for you to own. The company is virtually untapped in international markets and footwear where additional revenues are near pure growth.
My thesis of a 2023 revenue target of over $7 billion and 15% operating margins quickly generates over $1 billion in operating income. Utilizing an effective tax rate of 20%, the net income comes close enough to warrant a $2 EPS target on 450 million shares outstanding. The accounting probe and reduced revenue guidance for Q4 due to less inventory to sell into off-price markets doesn’t alter my thesis.
Takeaway
The key investor takeaway is that the Q3 report and accounting probe news provides a lot of ammunition for the bears, but investors looking past the headlines will see Under Armour making progress on the turnaround. The brand is poised to return to revenue growth from product innovation that will alter the market view on the stock making the current dip very appealing.
The accounting probe throws an additional level of short-term risk to the story. Investors need to be prepared for an adverse opinion from the DOJ/SEC that could require some restatements of past periods, but clearly, nothing nefarious is ongoing considering the probe has been ongoing for such an extended period.
Investors should use the weakness to buy the stock with some capital held in case the results of the probe send the stock even lower.
Disclosure: I am/we are long UA. I wrote this article myself, and it expresses my own opinions. I am not receiving compensation for it (other than from Seeking Alpha). I have no business relationship with any company whose stock is mentioned in this article.
Additional disclosure: The information contained herein is for informational purposes only. Nothing in this article should be taken as a solicitation to purchase or sell securities. Before buying or selling any stock you should do your own research and reach your own conclusion or consult a financial advisor. Investing includes risks, including loss of principal.
Like this article
Warren Buffett has $128 billion in cash to burn and analysts can’t figure out why he isn’t spending it
PUBLISHED MON, NOV 4 201911:02 AM ESTUPDATED MON, NOV 4 20192:24 PM EST
KEY POINTS
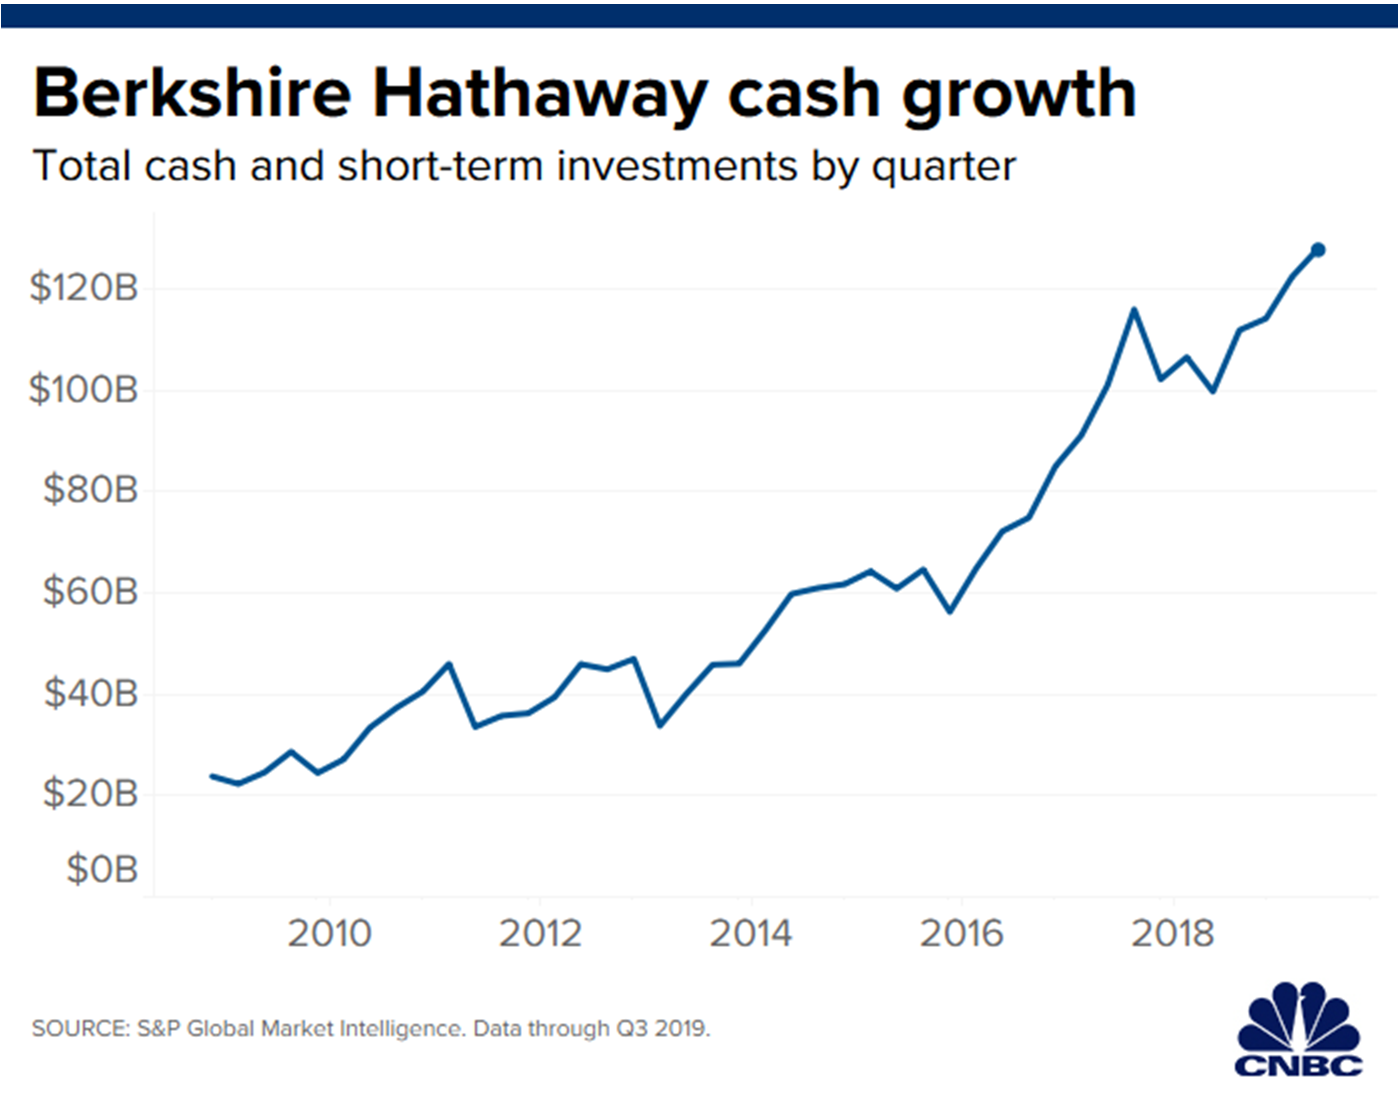
- Warren Buffett’s Berkshire Hathaway reported a $128 billion cash balance for the third quarter, up from $122.4 billion in the prior quarter.
- The company said it repurchased $700 million worth of shares for the quarter, which left some analysts unimpressed.
- Morgan Stanley said the buyback pales in comparison to the cash pile, while analysts at UBS said they were surprised that the company “has not been more aggressive with share repurchase.”
Warren Buffett’s Berkshire Hathaway reported earnings on Saturday and Wall Street is caught up on one key thing: its cash pile.
In the third quarter, the holding company’s cash balance grew to a record $128.2 billion — up from $122.4 billion in the prior quarter and $23 billion a decade ago — leading analysts to wonder why the company isn’t spending.
Berkshire’s last entire company acquisition was Precision Castparts in 2015 and the company hasn’t meaningfully accelerated its buyback program, which have both contributed to the ballooning cash balance.
The company reported earnings of $3.07 a share, which topped the Street consensus of $2.84, according to estimates from Refinitiv. Revenue also exceeded expectations, and Berkshire said it repurchased $700 million worth of stock in the quarter.
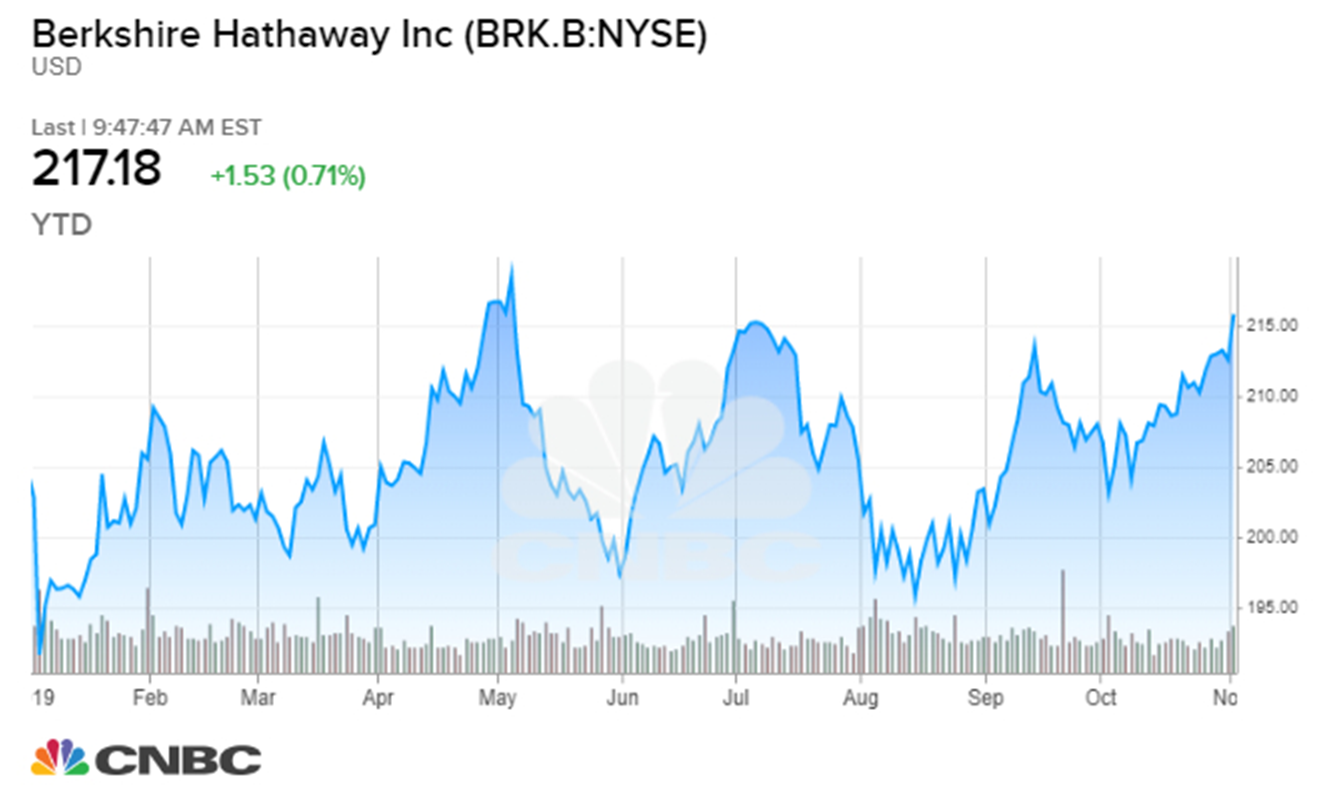
With no clear signs for why Berkshire is accumulating cash, a number of analysts wondered why the company isn’t buying back more stock. This is especially true since the shares are up just 7% this year and on pace for their worst year in a decade.
By comparison, the broader market has been on a tear. The Dow Jones Industrial Average and S&P 500 surged to record highs on Monday, bringing their total gains for the year to 18% and 23%, respectively.
Morgan Stanley said that the share repurchase program pales in comparison to the company’s cash balance, and that investors “may be dismayed by minimal share repurchases in the quarter.”
Analysts at UBS echoed this concern, saying the buyback remains modest and that they were surprised that “the company has not been more aggressive with share repurchase” given “the discount to intrinsic value BRK’s shares are currently trading at and its substantial excess cash balance.”
Morgan Stanley has an equal weight rating and $217 target on the stock. UBS has a buy rating and $242 12-month target.
Buffett has traditionally not been in favor of buying back a lot of Berkshire Hathaway’s stock, although in 2018 he did make future buybacks easier by eliminating a restriction.
“It is challenging to estimate Berkshire’s pace of potential future share buybacks, which we now believe could be at a modest level going forward. We still view a shareholder dividend as unlikely for now,” Barclays analyst Jay Gelb said. “Berkshire now has over $100 bn of immediately deployable cash for accretive acquisitions to supplement organic growth as well as for investments and share buybacks,” he added. Barclays has a neutral rating on the stock.
While Buffett hasn’t been buying entire companies lately, he has been buying stocks. As of the latest round of SEC filings, Berkshire’s top holdings by value are Apple, Bank of America, Coca-Cola, Wells Fargo, American Express and Kraft Heinz.
“In recent years, the sensible course for us to follow has been clear: Many stocks have offered far more for our money than we could obtain by purchasing businesses in their entirety … Charlie and I believe the companies in which we invested offered excellent value, far exceeding that available in takeover transactions,” he wrote in his 2018 annual report.
Earlier this year, Berkshire announced a $10 billion investment in Occidental Petroleum for the Anadarko takeover, and in 2017 the firm acquired nearly 40% of truck stop operator Pilot Flying J.
Buffett turns 90 next year, but so far the widely followed investor has shown no signs of slowing down amid speculation over who will succeed him.
“Warren Buffett … intends to remain at the helm for the foreseeable future, and his succession plan is in place,” Gelb said.
— CNBC’s Michael Bloom and Eric Rosenbaum contributed reporting.
Paul Tudor Jones sees the S&P 500 plunging 25% if Warren elected, jumping another 15% on Trump
PUBLISHED TUE, NOV 5 201910:08 AM ESTUPDATED TUE, NOV 5 20191:25 PM EST
KEY POINTS
- Jones says that an internal poll at his investment firm found that employees believe the S&P 500 could swoon to 2,250 if Warren comes out on top.
- “As an investor, you have to have a view on the election because the outcomes are so extreme,” he said from the Greenwich Economic Forum.
- The same Tudor survey found that the firm expected the stock market to rally about 15% to 3,600 if Trump secures a second term.
Billionaire investor Paul Tudor Jones believes the S&P 500 would plunge 25% if Sen. Elizabeth Warren clinches the 2020 election, but sees another 15% upside for the market if President Donald Trump wins reelection.
Speaking from the Greenwich Economic Forum, Jones explained on Tuesday that an internal poll at his investment firm found that employees believe the S&P 500 could swoon to 2,250 if Warren comes out on top.
“Her policies would – assuming they were implemented – probably give you something like that,” he said. “As an investor, you have to have a view on the election because the outcomes are so extreme. I’ve never seen this kind of polarity in elections as we have now.”
The same Tudor survey found that the firm expected the stock market to rally about 15% to 3,600 if Trump secures a second term. If Democrats Joe Biden or Pete Buttigieg are elected, the index could hover around 2,700, he said.
The S&P 500, Dow Jones Industrial Average and Nasdaq Composite all notched record highs on Monday as easing worries about the U.S.-China trade war, strong corporate profits and investor sentiment continue to usher equities higher.
Jones also critiqued those who’d claim a president has little impact on the direction of the stock market.
“It does make a difference. Ronald Reagan, when he became president, was a huge difference to the stock market,” Jones said from Greenwich, Connecticut. “And I would say who the next president is, is also going to have a huge impact on the economy and the stock market, particularly asset pricing.”
“This one is going to be more meaningful than any one certainly in my lifetime,” he added.
Jones isn’t the only noted investor worried about a fall in stock prices under a potential Warren presidency. Hedge fund manager Leon Cooperman, for example, has repeatedly blasted the Massachusetts Democrat for her proposed wealth tax and her less-than-rosy characterization of fellow billionaires.
“I don’t need Elizabeth Warren telling me that I’m a deadbeat and that billionaires are deadbeats. The vilification of billionaires makes no sense to me. The world is a substantially better place because of Bill Gates, Michael Bloomberg, David Rubenstein, Bernie Marcus, Ken Langone,” Cooperman said Monday.
“This is idiocy! It’s appealing to the lowest common denominator and basically trying to turn people’s heads around by promising a lot of free stuff,” he added.
One of Warren’s central campaign promises — and a policy pariah on Wall Street — is to impose a 2% tax on households with a net worth of above $50 million and a 3% tax on household net worth over $1 billion. She later upped that rate to 6% after elaborating on her “Medicare for All” proposal.
Opponents like Cooperman claim that the wealth tax would unduly punish those who’ve made their fortunes from hard work and innovation. Proponents claim, however, that economic disparity in the U.S. remains a problematic and pernicious issue and that more progressive ideas are needed to be done to remedy wide disparities in household wealth.
For his part, Jones appears to prefer South Bend, Indiana, Mayor Pete Buttigieg in the 2020 presidential race. He reportedly praised the politician at a recent gala.
“I love Pete, I love Mayor Pete, because I think he would be the best administrator to run this country, and he’s got a compassionate heart,” the billionaire investor said at a recent gala, according to a report. “He’s my man.”
Though Jones added at the time that he’s not politically active, the hedge fund manager has given to both Republicans and Democrats in the past, including in the last 12 months.
TE 1-Baidu quarterly results beat on strong video streaming growth
PUBLISHED WED, NOV 6 20194:58 PM EST
(Adds details on results; Updates share price)
Nov 6 (Reuters) – Chinese search engine giant Baidu Inc beat analysts’ estimates for quarterly profit and revenue on Wednesday, helped by strong growth in its video streaming platform iQIYI, sending its shares up 5% in extended trading.
Revenue from iQIYI jumped nearly 7% to 7.4 billion yuan ($1.06 billion), as the service crossed 105.8 million subscribers in September this year. The streaming platform competes with Alibaba Group Holding Ltd’s Youku.
Baidu has also been battling a slowing Chinese economy against the backdrop of the ongoing U.S.-China trade war, tighter ad regulations and rising competition from rivals like ByteDance’s TikTok.
Revenue from Baidu’s online marketing services business, which includes search, news feeds and a video app and which is a major contributor to overall sales, fell about 9% to 20.43 billion yuan.
The company, whose search engine dominates the market in China, forecast fourth-quarter revenue between 27.1 billion yuan and 28.7 billion yuan, while analysts had expected 27.52 billion yuan, according to IBES data from Refinitiv.
Net loss attributable to Baidu was 6.37 billion yuan in the third quarter ended Sept. 30, compared with a net income of 12.4 billion yuan a year earlier.
Excluding items, the company earned 12.61 yuan per American depository share, beating estimates of 7.88 yuan per ADS.
Total revenue fell marginally to 28.08 billion yuan from 28.20 billion yuan. Analysts on average had expected 27.49 billion yuan. ($1 = 6.9968 Chinese yuan renminbi) (Reporting by Akanksha Rana in Bengaluru; Editing by Sriraj Kalluvila and Shounak Dasgupta)
With a market at record highs, these are the most loved stocks on Wall Street right now
PUBLISHED SAT, NOV 9 20197:57 AM ESTUPDATED SUN, NOV 10 20199:46 AM EST
Maggie Fitzgerald@MKMFITZGERALD
KEY POINTS
- CNBC screened all S&P 500 companies looking for the stocks with the highest percentage of buy ratings.
- Amazon is the most loved stock on Wall Street, with 47 of the 48 analysts that cover the company recommend buying the e-commerce giant.
- Payment processors Visa and Mastercard are also on the top-rated list. Both companies have ended the last eight years in positive territory, with most years accounting for double digit gains in the stocks.
The Dow, S&P 500 and Nasdaq all hit all time record-highs this week and if investors are looking at what to own from here, the following stocks are the consensus favorites on Wall Street.
E-commerce giant Amazon is the most loved stock on Wall Street based on highest percentage of buy ratings. All but one of the 48 analysts covering the stock recommending buying into the Jeff Bezos-led company.

CNBC used FactSet to screen all S&P 500 companies looking for the stocks with the highest percentage of buy ratings compared with total ratings. We threw out companies that had less than 10 analysts covering them. Buy ratings, in this case, include overweight ratings.
It may not come as a shock that Amazon, the fourth-most valuable company in the world, is the most highly recommended stock on the Street. Over 50% of U.S. households have an Amazon Prime membership, according to UBS. The adoption of 1-Day shipping and international prime membership has helped boost the stock that is already up more than 1300% in the past decade.
Amazon’s 1-Day shipping “raises the bar in e- commerce yet again & accelerates the top line,” said J.P. Morgan analyst Doug Anmuth in a note to clients.
Amazon plays a large roll in the success of many other, smaller companies as well. Cosmetic company Coty surged 14% on Wednesday after reporting strong earnings, citing strong growth of its brand on Amazon.
Strong consumer boosts payment processors
Wall Street-adored stocks Visa and Mastercard are the world’s first and second largest payments processors, respectively. Visa, which has a market value of about $386 billion, and MasterCard, which has a market value of about $279 billion, have both ended the last eight years in positive territory, with most years accounting for double digit gains in the stocks.
This is despite newer payment players like PayPal, Apple Pay, Chime and Cash App entering the space.
“Visa has so far pursued an effective digital wallet strategy –countering some of the threats and actively taking advantage of the opportunities offered by these new entrants,” said MoffettNathanson analyst Lisa Ellis.
Some of the payment companies’ decade long success can be attributed to the health of the U.S. economy, currently in its longest expansion in history. A robust economy encourages customers to spend more, boosting fee income for MasterCard and and Visa. Visa is up nearly 35% this year and Mastercard has rallied more than 40% since January.
Equinix and Citigroup are the other two finance companies on the most-loved list.
Infallible Facebook
Facebook’s stock is up nearly 50% since January.
Most recently, Facebook was under fire for its decision to keep accepting political ads, after Twitter said it would stop running political ads. Facebook said its decision was consistent with its view on free speech.
“We remain optimistic on ongoing user and usage growth, which continues despite difficult press,” said Bank of American Merrill Lynch analyst Justin Post in a note to clients.
Technology is well represented with software companies salesforce and Microsoft, and electronics company Keysight Technologies all making the most-loved stocks list.
CNBC did the same screen back in June and UnitedHealth Group and Agilent Technologies fell off the top-rated list.
—with reporting from CNBC’s Michael Bloom.
Here are your new income tax brackets for 2020
Published Wed, Nov 6 201912:23 PM ESTUpdated Wed, Nov 6 20193:56 PM EST
Alicia Adamczyk@ALICIAADAMCZYK
The IRS released the federal tax rates and income brackets for 2020 on Wednesday. The seven tax rates remain unchanged, while the income limits have been adjusted for inflation.
Tax rates in the U.S. are marginal, meaning that different levels of the same person’s income are taxed at different rates. If you and your spouse earn $80,000 in 2020 and are married filing jointly, for example, the first $19,750 of that will be taxed at 10%, and the income over $19,750 will be taxed at 12%.
The 2020 tax brackets affect the taxes that will be filed in 2021. These are the 2019 brackets.
Here are the new brackets for 2020, depending on your income and filing status.
For married individuals filing jointly:
- 10%:Taxable income up to $19,750
- 12%:Income between $19,750 to $80,250
- 22%:Income between $80,250 to $171,050
- 24%: Income between $171,050 to $326,600
- 32%:Income between $326,600 to $414,700
- 35%: Income between $414,700 to $622,050
- 37%:Income over $622,050
For unmarried individuals:
- 10%: Up to $9,875
- 12%:Income between $9,875 to $40,125
- 22%:Income between $40,125 to $85,525
- 24%: Income between$85,525 to $163,300
- 32% Income between $163,300 to $207,350
- 35%:Income between $207,350 to $518,400
- 37%: Income over $518,400
For heads of households:
- 10%: Up to $14,100
- 12%: Income between $14,100 to $53,700
- 22%: Income between $53,700 to $85,500
- 24%:Income between $85,500 to $163,300
- 32%: Income between $163,300 to $207,350
- 35%: Income between $207,350 to $518,400
- 37%: Income over $518,400
For married individuals filing separately:
- 10%: Up to $9,875
- 12%: Income between $9,875 to $40,125
- 22%:Income between $40,125 to $85,525
- 24%:Income between $85,525 to $163,300
- 32%:Income between $163,300 to $207,350
- 35%Income between $207,350 to $311,025
- 37%: Income over $311,025
The IRS also released information on the 2020 standard deduction.
These are the rates and income brackets for federal taxes. Your state may have different brackets, no taxes at all or a flat rate.
Once a source of panic, the yield curve is validating stocks’ comeback and may crown the winners
PUBLISHED MON, NOV 11 20197:57 AM ESTUPDATED 4 HOURS AGO
Patti Domm@IN/PATTI-DOMM-9224884/@PATTIDOMM
KEY POINTS
- Bank of America Merrill Lynch quant strategist Toby Wade studied the link between stocks and the yield curve, and found that cyclical industries, such as energy and materials, are most correlated to flattening and steepening of the yield curve.
- The Treasury yield curve is watched as an economic barometer, since an inverted curve signals recession.
- The study found that stocks are more linked to the spread than ever, with about half of 1,300 stocks studied correlated to moves in the yield curve.
It’s no coincidence that investors are getting more positive on the stock market as the yield curve has been steepening.
Bank of America Merrill Lynch’s quantitative team has found a direct relation between the move in stock prices and the yield curve, and some sectors, like energy, financials and materials, are far more correlated than others. A steepening yield curve is a positive sign for growth, and those sectors are closely linked to cyclical performance of the economy.
“I would say as the yield curve steepens, it has a positive impact on equity prices on a relative basis. As it inverts, it has a negative impact on stock prices,” said BofAML quantitative strategist Toby Wade. Wade’s study looked at 1,300 stocks, including those in the S&P 500 and BofA’s coverage universe. He looked at relative return going back 10 years, vs. the 2-year to 10-year yield curve.
The yield curve steepens when interest rates on longer duration bonds are higher than on the shorter duration and the spread between them gets wider. That is the opposite of what happened when the curve inverted in the spring and summer.
At that point, the 3-month Treasury yield was above the 10-year yield and they were moving farther apart. That “inverted” curve is viewed as a negative sign and has often preceded a recession. Now the 3-month yield is about 38 basis points lower than the 10-year yield, and heading in a positive direction. The 2-year to 10-year curve had also been inverted and is now steepening.
The BofA strategists measure stocks against a number of macro factors. Of all of them, the yield curve has become most correlated.
“Specifically, the yield curve is the most important macro factor we examined, with nearly 50% of stocks in our coverage universe and the S&P now demonstrating a statistical relationship between returns and the yield curve,” he noted. That compares with just 12% in 2011.
Sector, stock impacts
Wade found that returns in the energy, financial and material sectors rise the most as the yield curve steepens, they also go down the most when it inverts. The sectors where returns go down when the yield curve steepens are utilities, real estate and staples.
Wade also looked at the reaction in individual stocks to yield curve moves. Four of the five least-correlated names on his list of 1,300 were gold companies. That means the stocks of — Iamgold, Yamana Gold, New Gold and Royal Gold — would see returns go lower when the curve steepens. They do better when the curve inverts, when investors are fearful of recession.
As for the most correlated, the top three were straight from the most correlated sectors. The most correlated was Whiting Petroleum, followed by banking firm First Bancorp-Puerto Rico and then First Quantum Minerals.
In a list of the top 20 correlated stocks, several others were in the financial sector, including Zion Bancorporation, Lincoln National Corp. and MGIC Investment Corp.
Also in the top 20 were U.S. Steel, Lundin Mining, AK Steel, SM Energy, Nabors Industries and Callon Petroleum. Other companies that were highly correlated to the yield curve include H&E Equipment Services, United Rentals, Tetra Technologies and Terex.
BofA also looked at the track record of stocks that are most impacted by macro factors, like the yield curve.
“We found that since 2006, stocks that are more macro sensitive tend to underperform stocks whose performance is driven by company-specific factors,” Wade said.
https://www.aier.org/article/hidden-intervention-political-motivations-driving-fed-policy/
Hidden Intervention: Political Motivations Driving Fed Policy
– November 8, 2019
The recent move by the Federal Reserve to increase support for the overnight lending market further informs our understanding of monetary manipulation that has characterized the last decade. Although the putative reason for the recent intervention is to support the overnight lending market, political motivation appears to have played a significant role in the decision. The operation provides increased support by the Fed to the market for U.S. Treasuries while hiding the effects of the intervention.
The Federal Reserve has provided support for the repo market. But the support, which has caused an uptick in the Fed’s balance sheet of nearly $200 billion, has not only occurred through an abnormal increase in repurchase-agreement holdings (repos) of the Federal Reserve. The Federal Reserve has also increased its holdings of Treasuries by purchasing from primary dealers who are also active in the overnight lending market. Figure 1 shows reconstructed figures that include the total value of Treasuries.
I recently identified three categories from the Federal Reserve’s balance sheet that play a significant role in the current policy regime at the Federal Reserve: reverse repurchase agreements, other liabilities and capital, and non-reserve deposits. The sum of these three categories approximates the discrepancy between the total quantity of base money and the size of the Federal Reserve’s balance sheet. The Federal Reserve is using assets and accounts in these categories to manipulate the quantity of base money, thereby preventing the quantity of currency in circulation from increasing. The Federal Reserve mutes public awareness of the intervention as a result.
The saga of hidden intervention continues. In recent weeks, the Federal Reserve has also acquired repurchase agreements. Reverse repurchase agreements affect only the discrepancy between the quantity of base money and the size of the Fed’s balance sheet, whereas repurchase agreements add to the balance sheet as the Federal Reserve has purchased the instruments with newly created money. In the first case, the Federal Reserve borrows from the market; in the second, it provides short-term loans to the market.
If you expect that this would also lead to an increase of the quantity of base money, if not the quantity of base money in circulation, you are mistaken. Since the announcement of increased support for the overnight lending market, we have also seen a substantial increase in deposits of the Treasury at the Federal Reserve. So long as funds provided by recent purchases by the Federal Reserve are sterilized by a change of similar magnitude in the size of the Treasury’s general account at the Fed, there will be neither an increase in the quantity of base money in circulation nor an increase in the total quantity of base money.
Monetary Policy Is Political
What is the purpose of the Federal Reserve’s purchases? Yes, interest rates in the overnight lending market had risen. And, yes, the provision of liquidity appears to have stabilized rates in that market. We never entered crisis mode. Not even close. But that does not explain why the Federal Reserve chose this path to stabilize the overnight lending market. After all, it could have solely increased holdings of repurchase agreements or decreased holdings of reverse repurchase agreements without increasing holdings of Treasuries. This would have accomplished the same goal without the additional economic distortions in the Treasury market generated by the chosen intervention.
One must wonder if Jerome Powell was seizing the opportunity to ease pressure from the current administration. As George Selgin has pointed out, the problem of Federal Reserve officials reducing the size of the balance sheet is a political one. The large balance sheet is not necessary to promote macroeconomic stability. It is necessary to keep interest rates low in sectors favored by Fed policy.
The Federal Reserve is subsidizing the Treasury. The apparent trouble in overnight markets appears to have provided an excuse to quietly reengage in the now decade-old program of support. In the process, Powell has — for the first time during his tenure — increased the size of the Federal Reserve’s balance sheet.
FIGURE 1
I’m not alone in this suspicion. David Kotok points to “the need for about $70 billion in corporate tax payments that had to be made, which drew down funds to some extent from money market mutual funds, and to the issuance by the Treasury that same day of about $50 billion in securities that had to be financed.” This may explain why the Federal Reserve engaged in Treasury purchases. It is also indicative of the greater danger currently faced by the financial system.
Investor demand for Treasuries may not keep pace with the appetite for federal spending. The post-crisis Fed has hidden the damage of the current policy and seems intent to continue doing so for as long as possible. It does this by allocating credit to the Treasury whenever federal government borrowing sparks a rise in interest rates, thereby muting the signs of distress generated from financial markets.
Perpetual Public-Spending Stimulus
As long as the Federal Reserve continues this practice of purchasing Treasuries and hiding the results of monetary expansion by sterilizing the resultant monetary expansion, it will enable excessive federal spending while leaving the public with little recourse. In turn, the federal government can avoid facing the consequences of fiscal irresponsibility.
Resources are transferred to the government from the private sector as government borrowing is relatively cheap compared to private borrowing. The new monetary-fiscal arrangement may be promoting inefficient economic structure. Unless we assume that the federal government does a better job of choosing profitable investments than private investors in a competitive market, this policy will likely lead to lower levels of economic growth as government over-invests in some sectors at the cost of under-investment in other sectors.
Since the 2008 crisis, the growth rate of real income in the United States has failed to reach the rates that it had experienced on average in previous decades (figure 2). Before the recession, the average rate of growth of real GDP was usually 2.5 percent or higher. For much of the last decade, that rate has remained below 2.5 percent. The path of real income does not appear to be reverting to its previous trend as this would require a period of growth rates substantially above the 2.5 percent mark. Over the same period, the annual federal budget, supported by Fed intervention, increased from about 20 percent of GDP to 25 percent of GDP. The federal debt increased from about 60 percent of GDP to over 100 percent of GDP.
Other interpretations are possible. Perhaps Ben Bernanke’s courage to act saved the U.S. economy from a worse fate. However, one must explain why traditional increases in the money stock intended to offset a fall in total expenditures — a strategy not tried by the Federal Reserve across the decade — would not have succeeded in stabilizing financial markets without the Federal Reserve engaging in credit allocation. The fact remains that the change in the Federal Reserve’s playbook accompanied the first persistent drop in the level of real GDP since the Great Depression.
Even if the real rate of growth rises to match historical precedent, the 2010s has been a lost decade in terms of real income growth. While one may argue that this is purely a structural problem, with many in the workforce retiring early or leaving for other reasons, credit allocation enabled by post-crisis monetary intervention is a likely culprit. Support for this outcome has been supplemented by Basel III requirements for banks to hold more liquid capital in the form of government securities. Both monetary policy and financial reform have promoted the same end: demand for government debt has been artificially increased, thereby facilitating an increase in government expenditures.
The economic significance of the Fed’s new operating system is difficult to overemphasize. This should be no surprise for anyone who has paid attention to this change in monetary policy. Despite the apparent impact on real economic growth, the new monetary regime has been embraced by at least one leading monetary theorist. Opposition by theorists, while it exists, is hardly strong enough to motivate a move back to a traditional monetary policy regime.
The complexity of the current monetary policy regime makes evaluation of it difficult, and it is even more difficult to generate public awareness about it. In order for reform to succeed, support is required on at least one of these two fronts. Until that time, producers not subsidized by the new fiscal and monetary regime face an invisible tax that will likely increase so long as the new operating system persists.
HI Financial Services Mid-Week 06-24-2014