HI Market View Commentary 10-26-2020
https://www.facebook.com/161294417293224/posts/3393349977420969/
Let’s watch the video from the link up above !!!!
| Market Recap |
| WEEK OF OCT. 19 THROUGH OCT. 23, 2020 |
| The S&P 500 index fell 0.5% this week in the first weekly drop since September as uncertainty about the Nov. 3 election and ongoing stimulus talks outweighed better-than-expected Q3 results from a number of US companies. The market benchmark ended the week at 3,465.39, down from last week’s closing level of 3,483.81. With five sessions remaining in the month, the S&P 500 is up 3.0% for October. It is up 7.3% for the year to date. The technology sector had the largest percentage drop of the week, down 2.2%, as investors appeared to be pulling back from some sectors that saw strong gains in recent months. Other decliners included consumer staples, off 1.2%, and real estate, down 1.3%. Communication services led the gainers with a 2.2% increase, followed by gains in utilities, financials and energy. The mixed activity came as investors are concerned about whether a stimulus agreement will be reached in time for the Nov. 3 election, especially as COVID-19 cases remain elevated, but they also have been encouraged to see many companies’ Q3 results coming in above analysts’ expectations. In the technology sector, shares of Citrix Systems (CTXS) fell 11% this week even as the workspace technology company reported Q3 earnings per share and revenue above Street expectations and boosted its full-year guidance. In consumer staples, shares of Kimberly-Clark (KMB) fell 11% as the consumer products company posted Q3 adjusted earnings below analysts’ expectations despite higher-than-expected quarterly revenue and increased full-year guidance. The real estate sector’s decliners included Crown Castle International (CCI), which reported Q3 adjusted funds from operations slightly ahead of analysts’ mean estimate and above its year-earlier results. Shares shed 5.1%. On the upside, the communication services sector was boosted by the shares of Twitter (TWTR), which rose 10% on the week as analysts at Jefferies and MoffettNathanson raised their price targets on the microblogging site operator’s stock. The energy sector’s gainers included Baker Hughes (BKR), whose shares rose 8.8% as the oilfield services company reported Q3 earnings per share that matched the Street view while revenue came in above analysts’ mean estimate. Next week’s earnings calendar features Microsoft (MSFT), Pfizer (PFE), 3M (MMM) and Caterpillar (CAT) releasing their quarterly results Tuesday, United Parcel Service (UPS) and Boeing (BA) Wednesday, Apple (AAPL), Amazon.com (AMZN), Alphabet (GOOG, GOOGL) and Facebook (FB) Thursday, and Exxon Mobil (XOM) and Chevron (CVX) Friday. Investors will get several readings on the housing market next week, with new home sales for September being reported Monday and the Case-Shiller national home price index coming Tuesday along with the home ownership rate. Pending home sales for September are set to be released Thursday. Provided by MT Newswires. |
Where will our markets end this week?
Lower
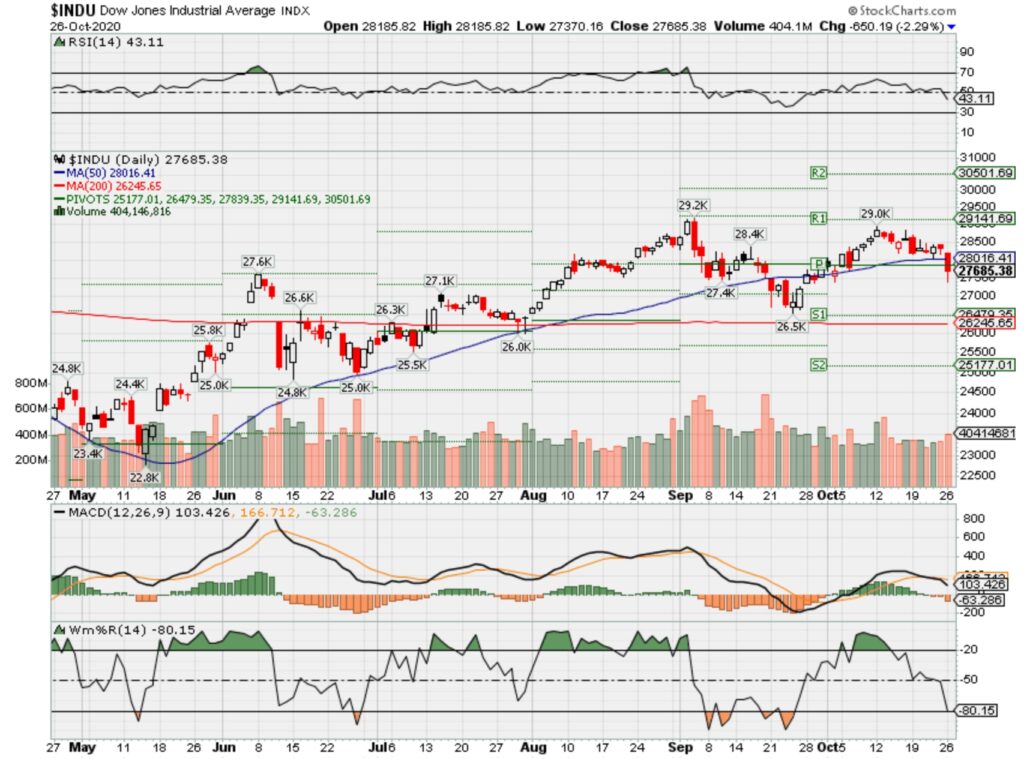
DJIA – Bearish
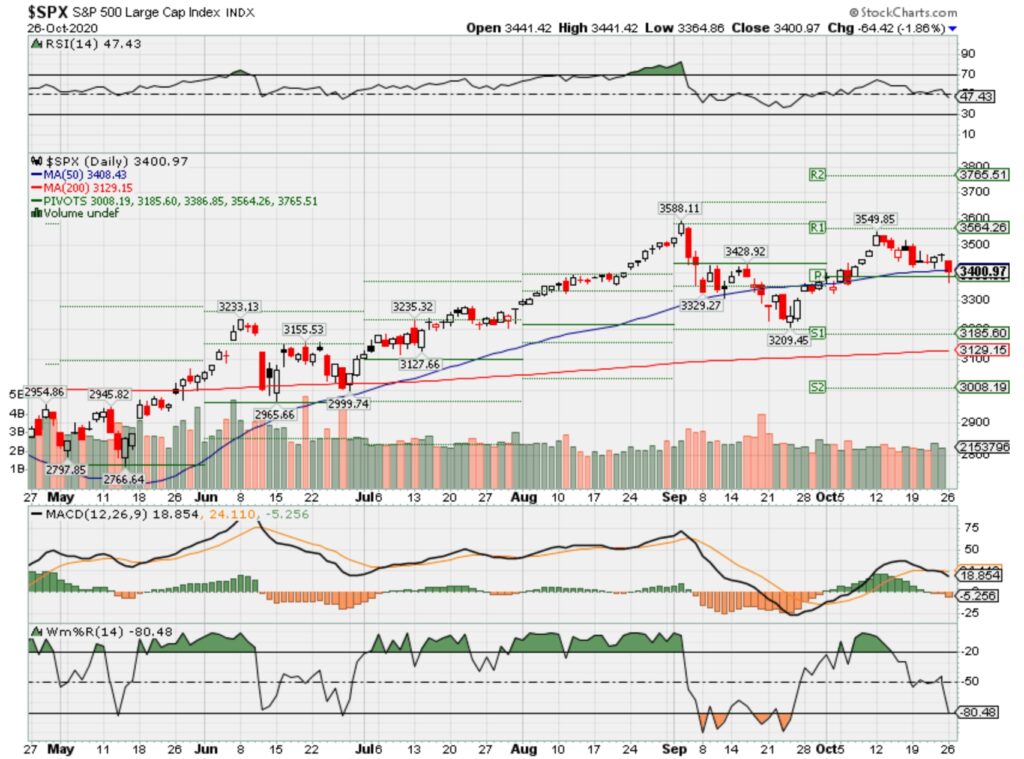
SPX – Bearish
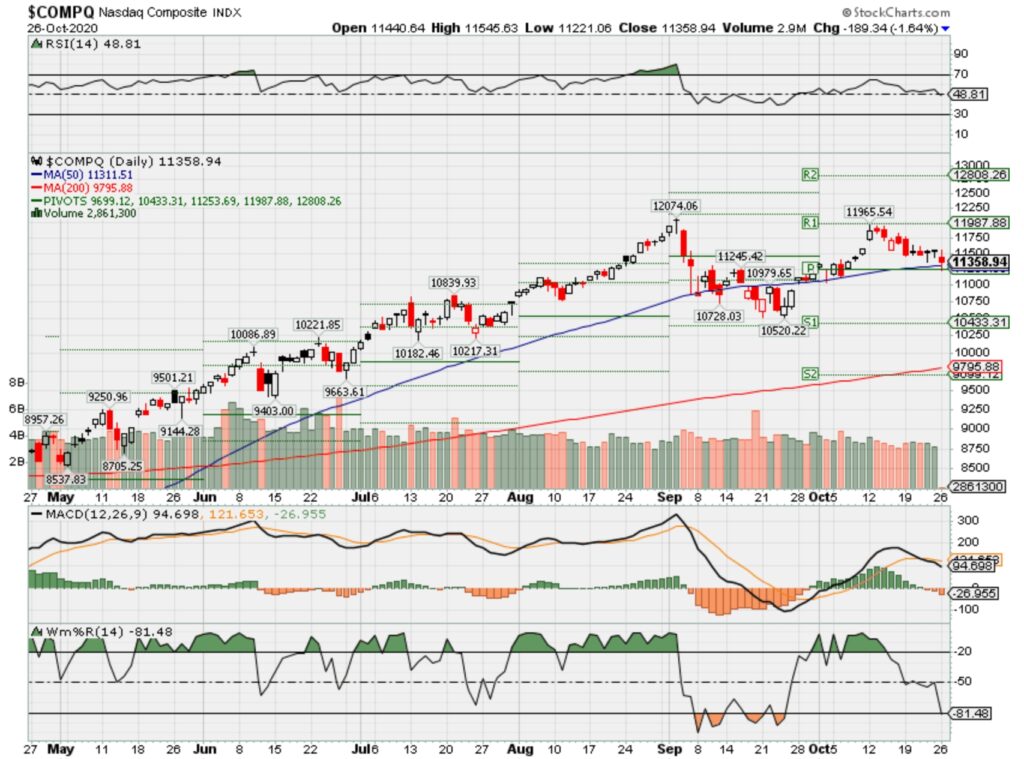
COMP – Bullish
Where Will the SPX end October 2020?
10-26-2020 +3.0%
10-19-2020 +2.0%
10-12-2020 0.0%
10-05-2020 -5.0%
09-28-2020 -5.0%
Earnings:
Mon: HAS, FFIV, TWLO
Tues: MMM, CAT, BP, CROX, CMI, HOG, JBLU, PFE, RTX, AKAM, DENN, FEYE, FSLR, MSFT, LLY,
Wed: BSX, GRMN, GE, UPS, AMGN, BYND, CREE, GRUB, WDC, BA, MA, F, V,
Thur: DNKN, DD, IMAX, IP, K, KHC, TAP, RL, RCL, YUM, GOOG, AMZN, SHAK, SKYW, X, TWTR, AUY, CCL, NEM, AAPL, FB, SBUX,
Fri: MO, CVX, CL, XOM, HON, PSX, UAA
Econ Reports:
Mon: New Home Sales,
Tues: Durable Goods, Durable ex-trans, FHFA Housing Market Index, Case Shiller Index, Consumer Confidence
Wed: MBA,
Thur: Initial Claims, Continuing Claims, GDP, GDP Deflator, Pending Home Sales
Fri: PCE Prices, PCE Core, Employment Cost Index, Personal Income, Personal Spending, Chicago PMI, Michigan Sentiment
Int’l:
Mon –
Tues –
Wed –
Thursday – JP:BOJ Rate Decision, EUR: ECB Interest Rate Decision
Friday- EUR: GDP
Sunday –
How am I looking to trade?
All positions are mostly protected and now looking for OTM covered calls to add for full collar positions. Just trying to get to the elections and earnings.
EARNINGS
AAPL 10/29 AMC
BA 10/28 BMO
BIDU 11/05 est
LLY 10/27 BMO
DIS 11/12 AMC
F 10/28 AMC
FB 10/29AMC
UAA 11/02 BMO
V 10/28 AMC
www.myhurleyinvestment.com = Blogsite
customerservice@hurleyinvestments.com = Email
Questions???
Why Buffett, Cuban and Munger all HATE Diversification : World’s Greatest Investors
Biden’s tax plan could create a tax rate of as much 62% for New Yorkers and Californians, studies show
PUBLISHED MON, OCT 19 20201:32 PM EDTUPDATED MON, OCT 19 20205:21 PM EDT
KEY POINTS
- In California, New Jersey and New York City, taxpayers earning more than $400,000 a year could face combined state and local statutory income tax rates of more than 60%.
- Few taxpayers pay the full statutory rates, which don’t include deductions, credits, offsets, loopholes and lower tax rates on other sources of income.
- If the Democrats win the Senate and can pass legislation removing the $10,000 cap on state and local tax deductions, the combined state and local tax rates for top earners could be even lower.
High earners in New York and California could face combined federal and state tax rates of 62% under Democratic presidential nominee Joe Biden’s tax plan, according to experts.
While Americans earning less than $400,000 would, on average, receive tax cuts under Biden’s plan, the highest earners would face double-digit increases in their official tax rates, according to nonpartisan analyses. In California, New Jersey and New York City, taxpayers earning more than $400,000 a year could face combined state and local statutory income tax rates of more than 60%.
In California, top earners could face a state and federal tax rate of as much as 62.6% under the Biden plan, according to calculations from Jared Walczak of the Tax Foundation. In New Jersey, the combined rates could be just more than 60%, while in New York state they could reach 58.2%. In New York City, home to most of the state’s high earners, the combined city, state and federal income tax rate would be just over 62%.
Of course, few if any taxpayers pay the full statutory rates, which don’t include deductions, credits, offsets, loopholes and lower tax rates on other sources of income. Even though the top U.S. statutory tax rate is currently 37%, the effective rate (what taxpayers actually pay with help from their accountants) for top earners is 26.8%, according to the Tax Foundation. The Biden campaign said what matters to taxpayers and the economy are the effective rates, not the statutory rates.
Under Biden’s plan, the effective tax rate for the top 1% would increase from 26.8% to 39.8%, according to the Tax Policy Center. That means top earners in California and New York City would pay effective state and federal tax rates of around 53% — compared with the roughly 40% they pay in effective rates today.
What’s more, if the Democrats win the Senate and can pass legislation removing the $10,000 cap on state and local tax deductions, the combined state and local tax rates for top earners could be even lower.
Yet the official, combined tax rates of more than 60% for top earners would be the highest in more than 30 years, and well above the rates under the Obama administration. The main drivers of the increase in Biden’s plan are the hike in the top marginal tax rate, to 39.6% from 37%, and the added payroll tax of 12.4% for those making more than $400,000 a year, which is split between the employee and employer. Including other provisions in his plan, the top federal tax rate would be 49.338% under Biden, according to Walczak.
Added to California’s top rate of 13.3%, the combined top marginal income tax rate for top-earning Californians would be 62.64%. In New Jersey, which has a top rate of 10.75% on those making more than $1 million, the top combined rate would be 60.1%. In New York state, the combined rate would be 58.2%, but in New York City, the combined rate would be 62%.
Walczak said if you include the contributions to the tax hikes by employers, which are often passed along to employees, the combined rates would rise even further — to over 65% in California, 62.9% in New Jersey and 64.7% in New York City. They could also jump higher if California and New York raise taxes on high earners, which some legislators have proposed to reduce multibillion-dollar budget gaps.
“These rates would be the highest in about 3½ decades,” said Walzcak, “and imposed on a broader tax base than was in place previously.”
Buyers traveling across the country, paying record prices for used pickups
PUBLISHED MON, OCT 19 202011:19 AM EDTUPDATED MON, OCT 19 202011:51 AM EDT
KEY POINTS
- There is so much demand for used vehicles, especially full-size pickup trucks, some buyers are traveling hundreds of miles to get what they want, regardless of the price.
- Two factors tied to the coronavirus pandemic are driving the trend.
- In March and April, automakers shut down plants from Canada to Mexico, severely restricting the supply of new models.
- Then, many people who did not own a vehicle in the past decided it was time to buy a car, truck or SUV so they could drive themselves and not have to rely on mass transportation or ride-sharing.
For Chuck Schmidt, traveling 1,579 miles and flying across five states to buy a 2017 Chevrolet Silverado 1500 was a no-brainer.
“I saw the truck on the internet Thursday morning and called the dealership. It was exactly what I was looking for and I bought it Friday afternoon,” Schmidt told CNBC two days after he paid $22,000 for the 3-year-old Silverado at Adams Toyota in Lee’s Summit, Missouri.
Schmidt coming all the way from Spokane, Washington, to buy a truck didn’t surprise Scott Adams, who owns the Toyota dealership outside of Kansas City, Missouri.
“At least two or three times a month we have customers that come from a long way away,” he said. “We sold a truck about two months ago to North Carolina. We sold a truck into Laredo, Texas, and we’re selling this one into Washington. Customers seem to be able to find things on the web more than they used to, and they’ll come a long way to get what they want.”
Welcome to the hottest market in the auto business right now. There is so much demand for used vehicles, especially full-size pickup trucks, some buyers are traveling hundreds of miles to get what they want, regardless of the price.
Two factors tied to the coronavirus pandemic are driving the trend. First, when the virus surged across North America in March and April, automakers shut down plants from Canada to Mexico, severely restricting the supply of new models, including full-size pickups.
Then, as America emerged from the initial surge of the pandemic, many people who did not own a vehicle in the past decided it was time to buy a car, truck or SUV so they could drive themselves and not have to rely on mass transportation or ride-sharing. The result: a run on certain types of used vehicles, like full-size pickups.
Tom Kontos, chief economist for KAR Global Analytics Research, who has tracked wholesale used vehicle prices for more than 20 years, calls this is the hottest market he’s ever seen.
“In the space of two months, prices went from double-digit declines to double-digit gains, and have stayed high since June,” he said. In August, KAR Global reported the average price for a full-size pickup hit a record high of $21,557. That’s up $5,166, or 31.5%, since February.
Adams said the surge in used truck prices is so great, some preowned models are now selling for more than a comparable brand-new version of that pickup.
“People will pay more for it, because it’s exactly what they want,” said Adams.
Schmidt said he spent six weeks looking for a red Chevy Silverado 1500 with all-wheel drive, relatively low mileage and the features he would need for work. Schmidt, a farm equipment supplier in Eastern Washington, said his truck often doubles as his office, so he wanted it to have certain features.
“Every day I spent 20 or 30 minutes on websites putting in exactly what I wanted,” Schmidt said. “I told my wife there is nothing out there that interests me.”
When Schmidt did find the Silverado that would meet his needs, he said, he was a little concerned about whether the dealership outside of Kansas City would hang on to the truck until he got there to pick it up.
“I kept texting them to make sure they didn’t sell it to someone else. I was so happy when I got there and saw this truck,” he said.
Despite having to drive 22 hours home, Schmidt’s not complaining about going halfway across the country for his Silverado. He added, “This has worked out better than I thought it would.”
— CNBC’s Meghan Reeder contributed to this article.
Apple’s Chinese users are mainly snapping up iPhone 12 and iPhone 12 Pro models, new data shows
PUBLISHED TUE, OCT 20 20202:11 AM EDTUPDATED TUE, OCT 20 20203:15 AM EDT
KEY POINTS
- As of 9:30 a.m. China time on Tuesday, 152,737 iPhone 12 units had been pre-ordered, data from Chinese e-commerce site and authorized Apple reseller Fenqile showed.
- Fenqile is also taking pre-orders for the iPhone 12 Mini and iPhone 12 Pro Max, even though they’re not officially available until November.
- Out of all the pre-ordered iPhones, nearly 43% are iPhone 12 models and over 28% are iPhone 12 Pro models. Just under 19% are iPhone 12 Pro Max orders.
GUANGZHOU, China — Chinese consumers have taken a liking to Apple’s new iPhone 12 and iPhone 12 Pro, according to data provided to CNBC.
The two devices in Apple’s new 5G flagship lineup became available for pre-order on Oct. 16. As of 9:30 a.m. China time on Tuesday, 152,737 iPhone 12 units had been pre-ordered, data from Chinese e-commerce site and authorized Apple reseller Fenqile showed.
Fenqile is also taking pre-orders for the iPhone 12 Mini and iPhone 12 Pro Max, even though they’re not officially available until November.
Out of all the pre-ordered iPhones, nearly 43% are iPhone 12 models and over 28% are iPhone 12 Pro models. Just under 19% are iPhone 12 Pro Max orders and nearly 10% are orders for the iPhone 12 Mini, the device with the smallest screen in the lineup.
The Fenqile data comes after a new note from Ming-Chi Kuo, an analyst at TF International Securities, known for his accurate predictions on Apple products and sales.
Kuo reported that Apple sold up to 2 million iPhone 12 units in the first 24 hours, up from 800,000 units of the iPhone 11. He also said that iPhone 12 Pro sold better than expected and that China represented 35% to 45% of that model’s demand.
Indeed, on Apple’s official China website, the iPhone 12 Pro had a delivery time of three to four weeks, higher than the two to three weeks for the base iPhone 12 models. Delivery times for devices can often indicate which models are most popular.
Kuo also predicted that the iPhone 12 Mini wouldn’t sell well in China due to its smaller screen, in a market where larger displays are more popular. On Fenqile, the iPhone 12 Mini has the least amount of pre-orders.
The latest figures will be encouraging for Apple given the importance of the Chinese market to the company but also the high expectations that the iPhone 12 range will spur an upgrade “supercycle.”
Apple’s iPhone 12 64GB in blue makes up 20% of pre-orders on Fenqile with the iPhone 12 Pro 128GB Pacific Blue variant making up 11%. These are the two most popular models.
The Cupertino, California giant has been quite aggressive on pricing. The iPhone 12 Pro is cheaper than last year’s iPhone 11 starting price upon release in China.
“Consumers are looking for the best deal now, even before the pandemic. And both the iPhone 12 and 12 Pro models could provide them favorable prices and screen size experience,” Will Wong, research manager at IDC, told CNBC.
“The iPhone 12 allows consumers to get the first 5G iPhone with more acceptable prices and specs, while iPhone 12 Pro could provide the ‘Pro’ experience to consumers with more affordable prices too.”
7 Secrets Smart Professionals Use to Choose Financial Advisors
1. Always Hire an Advisor Who Is a Fiduciary
By definition, a fiduciary is an individual who is ethically bound to act in another person’s best interest. This obligation eliminates conflict of interest concerns and makes an advisor’s advice more trustworthy.
All of the financial advisors on SmartAsset’s matching platform are registered fiduciaries. If your advisor is not a fiduciary and constantly pushes investment products on you, use this no-cost tool to find an advisor who has your best interest in mind.
2. Don’t Hire the First Advisor You Meet
While it’s tempting to hire the advisor closest to home or the first advisor in the yellow pages, this decision requires more time. Take the time to interview at least a few advisors before picking the best match for you.
3. Don’t Choose an Advisor with the Wrong Specialty
Some financial advisors specialize in retirement planning, while others are best for business owners or those with a high net worth. Some might be best for young professionals starting a family. Be sure to understand an advisor’s strengths and weaknesses – before signing the dotted line.
4. Don’t Pick an Advisor With an Incompatible Strategy
Each advisor has a unique strategy. Some advisors may suggest aggressive investments, while others are more conservative. If you prefer to go all in on stocks, an advisor that prefers bonds and index funds is not a great match for your style.
5. Always Ask About Credentials
To give investment advice, financial advisors are required to pass a test. Ask your advisor about their licenses, tests, and credentials. Financial advisors tests include the Series 7, and Series 66 or Series 65. Some advisors go a step further and become a Certified Financial Planner, or CFP.
6. Understand How They are Paid
Some advisors are “fee only” and charge you a flat rate no matter what. Others charge a percentage of your assets under management. Some advisors are paid commissions by mutual funds, a serious conflict of interest. If the advisor earns more by ignoring your best interests, do not hire them.
7. Do Not Hire an Advisor on Your Own
Chances are, there are several highly qualified financial advisors in your town. However, it can seem daunting to choose one.
Our no-cost tool helps make it easy to find the right financial advisor for you. Now you can get matched with up to three local fiduciary investment advisors that have been rigorously screened for regulatory disclosures and to confirm their licenses. The entire matching process takes just a few minutes.
https://www.moneyweb.co.za/news-fast-news/hedge-fund-giants-lose-their-appeal/
Hedge fund giants lose their appeal
As havens in global turmoil.
By Nishant Kumar, Bloomberg 26 Oct 2020 08:17
Investors have thronged the largest hedge funds since the last financial crisis as they sought safety in size. Now, they’re paying a hefty price.
Supersized funds are failing their clients during a period of market upheaval that in theory should pose an unprecedented chance to make money. Instead of profiting, though, some of the world’s biggest hedge funds have barely managed to protect their investors from losses.
A Hedge Fund Research gauge that gives more weight to larger players was down 4.4% this year through September, while all hedge funds on average managed to eke out a small profit. Gold-plated names that have slumped include Bridgewater Associates, quant powerhouses Renaissance Technologies and Winton, Michael Hintze’s CQS and Lansdowne Partners.
The losses are largely hurting influential institutional investors — pension funds, insurers and endowments — that contribute most to the industry’s assets and back the biggest funds. A reckoning looms as clients accelerate their flight. Investors pulled $89 billion from hedge funds in the first nine months of the year, mainly from large firms, according to Eureka hedge data.
“A very large portion of the assets invested in large hedge funds have not performed all that well and so it’s causing investors to reassess their objectives,” said Chris Walvoord, global head of hedge fund research at investment consultant Aon Plc. They’re asking, “Why am I invested in this? What’s the purpose?”
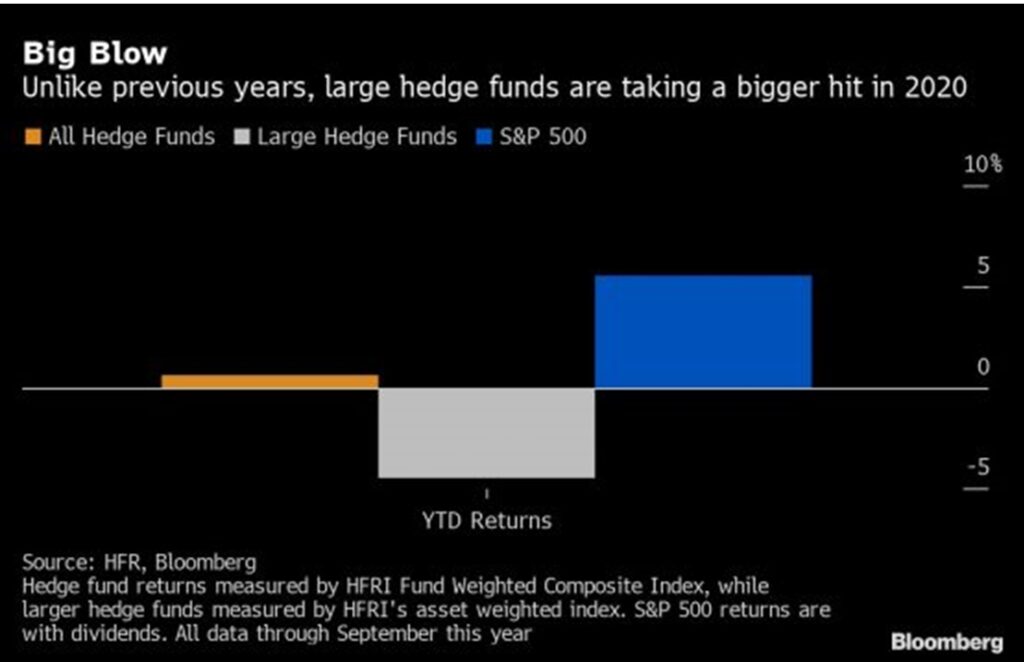
Larger hedge funds have traditionally been seen as more stable in down markets, a perception borne out in performance data going back more than a decade. Big funds lost less than their smaller counterparts nearly two-thirds of the time since the global financial crisis, according to an analysis of every loss-making month from 2008 to 2019. But that pattern broke down in 2020.
Hedge funds with more than $1 billion in assets racked up about $60 billion in performance losses this year through September, or just over 5% of their capital, according to Eureka hedge. Investors would have done far better with an index fund tracking the stock market: the S&P 500 rose 5.6%.
The supersizing of hedge funds evolved as institutions gradually replaced wealthy individuals as their biggest clients. Since most of those investors lack inhouse research teams and need to allocate hundreds of millions of dollars to have any meaningful impact on their portfolios, they’ve tended to park money with the largest, well-known hedge funds.
This has led to larger funds gobbling up fresh capital and smaller ones running out of business. Of a net $170 billion poured into hedge funds since 2010, some $135 billion has gone into larger ones, according to HFR data.
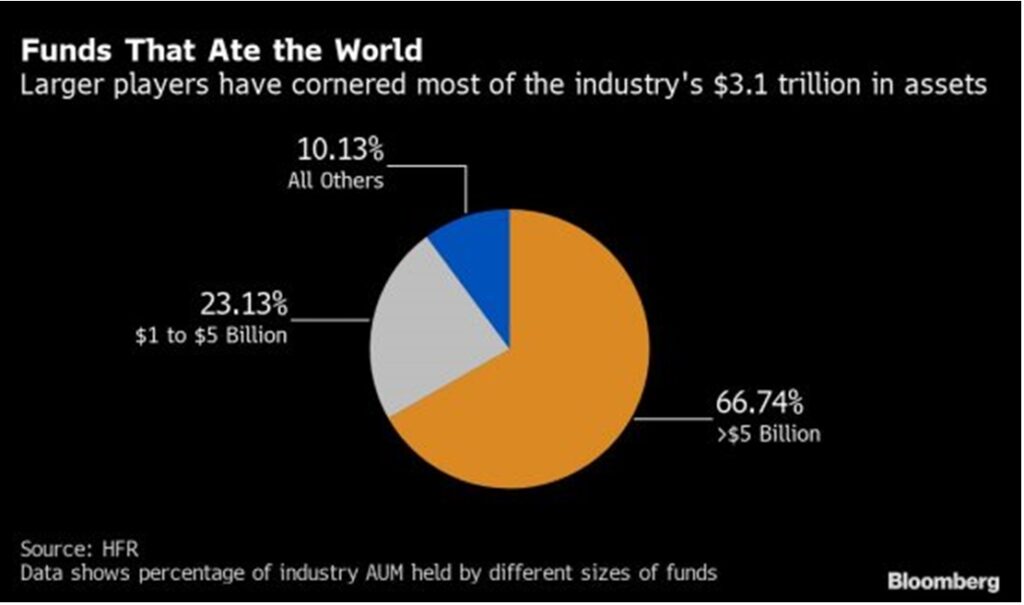
Size has become a burden. The sheer scale of some funds makes it harder for them to react by switching in and out of bets. So when volatility roiled stocks, bonds, currencies and commodities earlier this year, a large number of giant players lost record amounts of money.
The eight months through August were ugly: Bridgewater Associates’ flagship fund lost 18.6%; Renaissance Institutional Equities was down 13%; Winton’s main fund slumped about 19%; Hintze’s CQS hedge funds fell 42.5%; while Lansdowne Developed Markets Fund was down almost 22%.
With the US election around the corner and a raging pandemic still causing havoc across continents, there’s little sign that the volatility that bled hedge funds is on the wane.
“Market fragility remains elevated and speed is also high, meaning sharper but shorter duration moves are more likely to occur,” said Adam Jones, a partner at investment advisory firm Albert E Sharp.
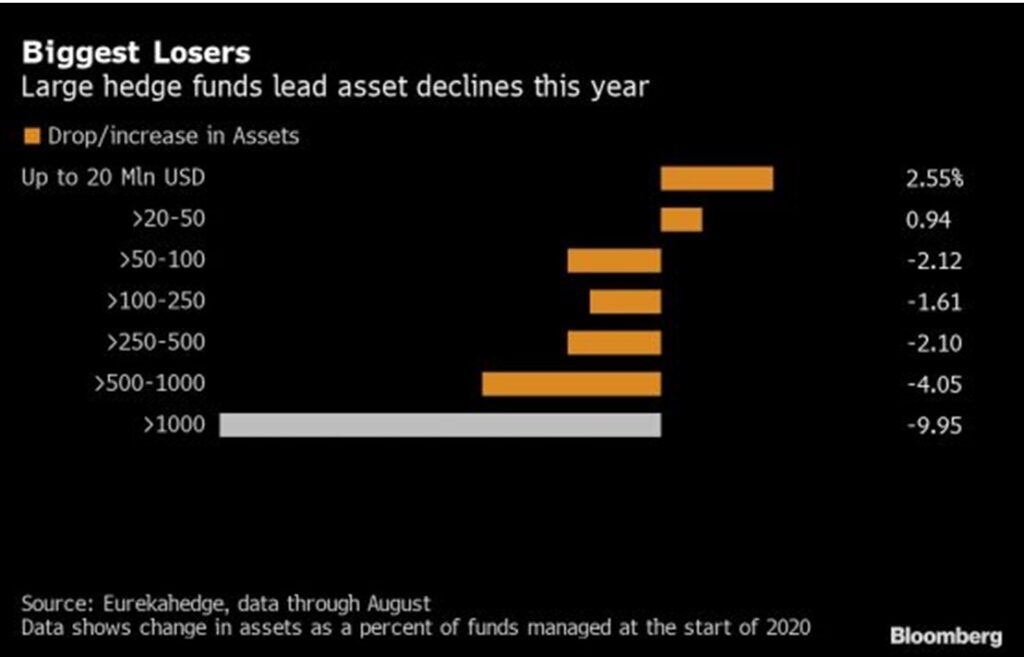
Even before the pandemic, investors were questioning the high fees charged by hedge funds for mediocre returns. Until now, many got away by blaming the lack of volatility for their woes — so 2020 should have potentially provided their best trading opportunity in years.
Not all large hedge funds have disappointed. Multi-strategy firms such as Citadel, Balyasny Asset Management and Millennium Management, which rely on dozens of traders to generate profits, are having one of their best years. Such funds are typically dominated by trading-oriented strategies and volatility tends to create more opportunities for them.
One reason why smaller funds are doing better is that they’re jumping on very niche trading opportunities that just don’t have capacity for the billions of dollars their larger peers need to invest. Some macro hedge funds run by the likes of Brevan Howard Asset Management, Rokos Capital and Caxton Associates have also churned out bumper profits. But they hide a truer picture of an industry which continues to struggle.
“The irony is that the hedge fund industry was built on investing with small, nimble managers who could exploit esoteric investment opportunities,” said Andrew Beer, founder of New York-based Dynamic Beta investments. “The last several years have shown that sometimes big might be too big, especially when fees consume most performance.”
© 2020 Bloomberg
Rising rates seem to signal a recovery is near, but investors wonder whether they can be believed
Michael Santoli@MICHAELSANTOLI
Bonds, it would seem, are speaking the bulls’ language.
Treasury yields rolled to a four-month high last week, the 10-year note reaching 0.84%, as U.S. economic data continue to arrive generally better than expected and the markets anticipate further fiscal-support worth trillions either sooner or later, under this administration or the next.
Bonds racked up the style points, too, in ways that Wall Street tends to read as signs of better economic growth to come. The spread between five- and 30-year Treasurys hit nearly a four-year high, and corporate debt has traded firm against the rising government rates.
The gust of selling in the Treasury market cleared the way for more cyclical, financial and value stocks to improve relative to the big growth stocks that have been largely in pullback mode since before Labor Day. Bank shares in the S&P 500 last week gained more than 6%, while the small-cap Russell 2000 managed a gain versus about a 2% decline for big momentum stocks as a group.
All this is encouraging as far as it goes, implying investors are gaining comfort with a solid growth trajectory into 2021, perhaps boosted by another fiscal infusion, without new Covid-related restrictions undercutting the recovery.
The ‘reflation’ trade
Still, it’s worth considering other drivers of the backup in yields and related equity reactions.
Fidelity’s head of macro strategy Jurrien Timmer last week notes that Treasury yields have simply been catching up to other indicators of a “reflation” trade that have been working for a while.
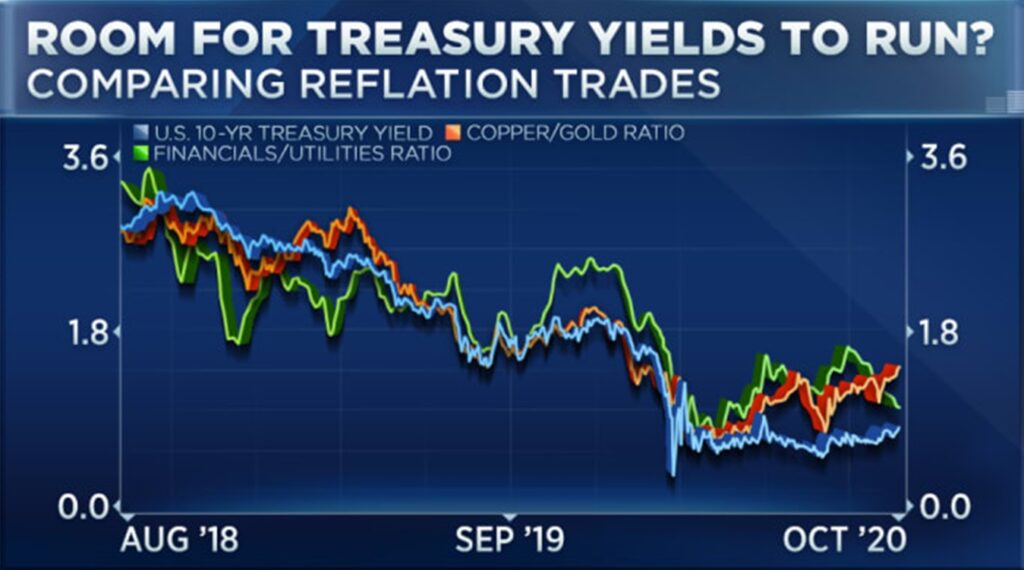
The idea here is, assets geared to a global economic quickening have been climbing off their post-Covid lows for months, making the yield rise a belated and grudging follower and not a harbinger of fresh insight about the economy.
Bond folks are also pointing out the yield move coincided with commentary by Federal Reserve officials casting some doubt on any plans for the Fed to shift its buying to longer-dated Treasurys to suppress their yields as the government prepares to ramp up its debt issuance to fund the deficit. And hedging by mortgage-securities holders could have accelerated the bump in yields.
Some technical factors, too, might restrain further lift in yields. The 10-year Treasury yield has just levitated enough to meet its steeply down-sloping 200-day average, a potential friction area for the yield rally on a first approach.
Bank of America noted Friday that the spread between U.S. and German 10-year government yields has grown to multi-month highs. At a time when currency hedges are inexpensive and the dollar weak, this should draw overseas buyers to Treasurys to capture richer yields – and ultimately to cap them
Yields trigger value stock move
Whether the start of a long-running expansion in yields or not, the action in bonds is enabling another attempt by value stocks to narrow their yawning performance gap against growth-company shares.
The Russell 1000 Value index relative to the Russell 1000 Growth measure has gained some traction, and to some eyes, is building a foundation for further comeback.
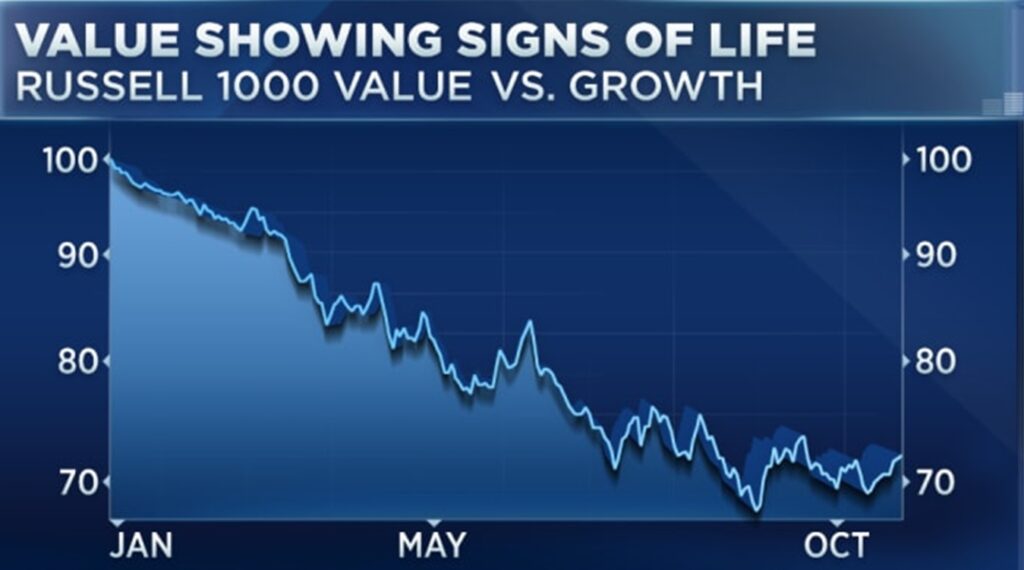
Still, the prominent spike in this relationship back in June also generated enthusiastic calls that the long-awaited renaissance for value strategies was at hand. The peak of Treasury yields and value relative performance was June 8, days after a surprisingly strong jobs report and at a peak of “reopening the economy” enthusiasm. What followed was a reversal in value, a pullback in the S&P 500 as the Sunbelt Covid-case surge unfolded, a strong bond rally and three months of furious Big Tech growth-stock outperformance.
There is no handy way to determine if this display of reflationary energy in financial markets is another head fake. But it makes sense to stay alert to the possibility.
Meantime, the broad stock market has pulled itself into a neutral, somewhat indecisive condition.
‘Mixed, muddled and inconclusive’
On one hand, the S&P sagged a couple of times last week toward the 3400 area, which traders consider the border between its recent breakout range and the former correction zone. The index finished off half a percent for the week, some 3.5% below its early-September peak.
The broadening out of the tape allowed the index to withstand diminishing hopes of a quick stimulus deal and absorb further pressure from mega-cap Nasdaq stocks without breaking its uptrend. Yet that Nasdaq pressure reflects some fatigue among former leaders. Amazon, Apple, Tesla and Zoom Video, to name just a few, have struggled, while homebuilders, semiconductors and cloud-software have come off the boil.
Stocks of companies reporting results responded without much enthusiasm, even for big upside surprises, a sign investors already assumed good numbers were on the way.
And while this looks like benign ebb-and-flow at the index level, investor sentiment and positioning has not reset much from fairly aggressive postures. This is evident in hedge-fund leverage, rampant speculation in upside call options, individual-investor attitudes and general commentary implying most everyone is looking to catch a post-election rally no matter the outcome.
At the end of last week, Citi strategist Tobias Levkovich wrote, “The backdrop for the equity market is mixed, muddled and inconclusive.” Investors leaning bullish, valuations fairly stout, indexes hard-pressed to rise easily without dominant growth stocks working and the Street attitudes toward the election swinging from intense anxiety in September to confidence that any outcome is market-friendly now.
Last week’s lethargic action could well be the market’s chewing through these issues and creating a chance for both bulls and bears to second-guess their views. For what it’s worth, one of the strongest seasonal stretches of the calendar starts early this coming week, just as industrial and Big Tech earnings bombard the market.
Through it all should come a few more hints of whether the bond market’s upbeat-seeming message is worth heeding.

HI Financial Services Mid-Week 06-24-2014