
HI Market View Commentary 09-23-2019
Seasonal or cycle trends that I use in making investment decisions:
Feb – Sell off Christmas hangover, April fund shift due to taxes, Sell in May and go away. Ept & Oct are usually down months, Christmas Rally after Black Friday until Christmas
Pre-earnings run ups, post earnings depressions,
Option expiration where up months are usually sell offs on options, and down months are usually run up on options expiration day
What happens the Monday after monthly options expiration ? We have a buy back in Monday
At the end of each week I do a weekly review is over the indexes and core portfolio positions
Where will our markets end this week?
DOWN
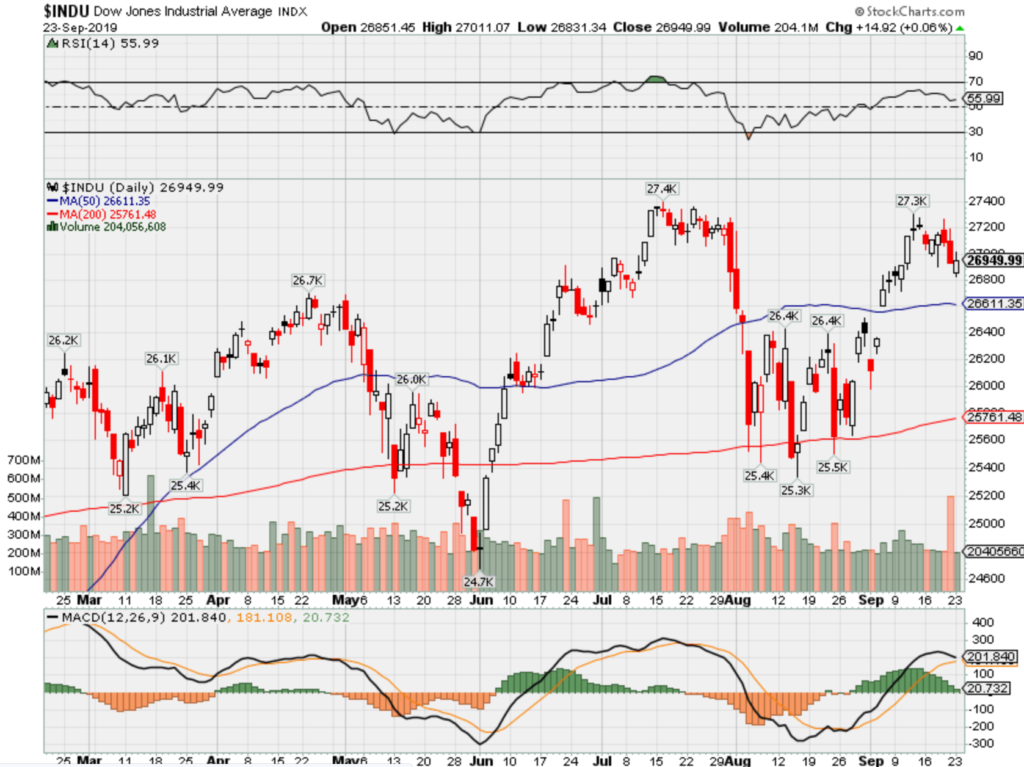
DJIA – Bullish
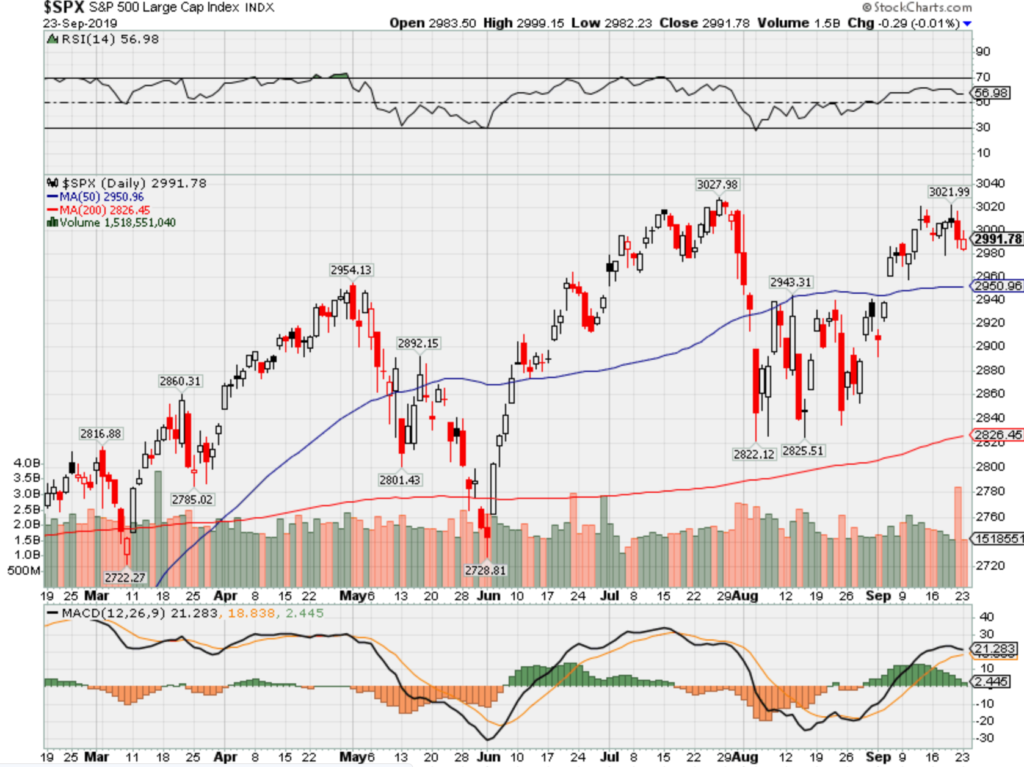
SPX – Bullish
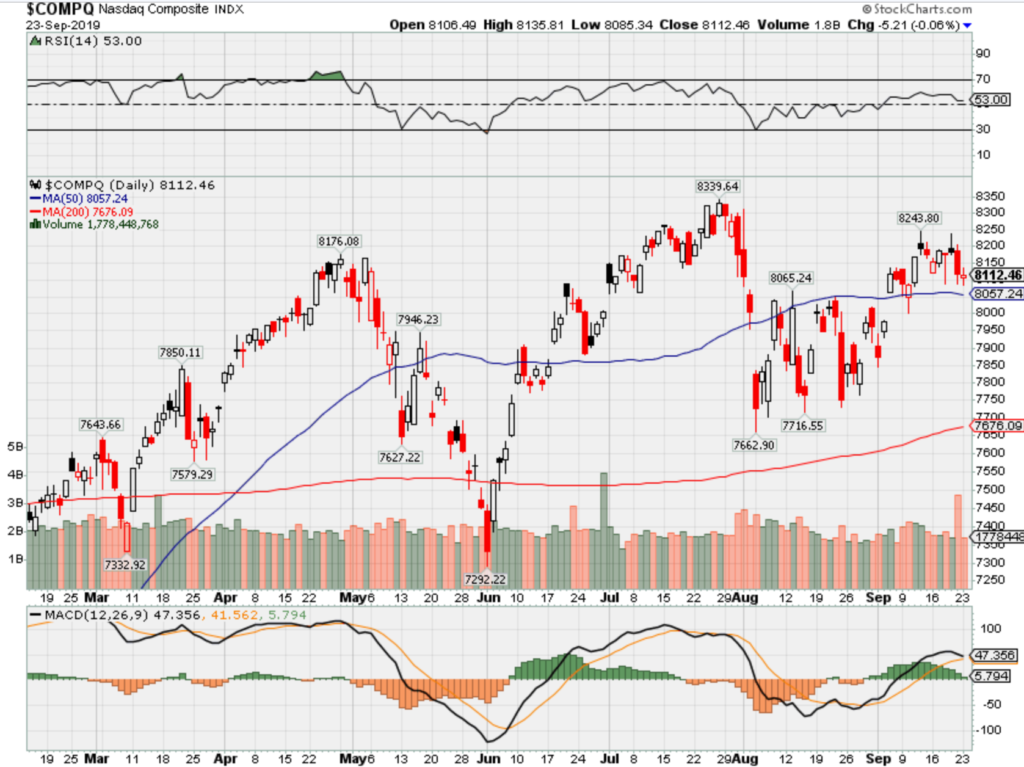
COMP – Bullish
Where Will the SPX end Sept 2019?
09-23-2019 +1.25%
09-16-2019 -1.0%
09-09-2019 -1.0%
09-02-2019 -1.0%
08-26-2019 -1.0%
Earnings:
Mon:
Tues: AZO, BB, KMX, JBL, CTAS, NKE
Wed: FUL, KBH
Thur: CCL, CAG, MU, MTN,
Fri:
Econ Reports:
Mon:
Tues: FHFA Housing Price Index, Case Shiller, Consumer Confidence
Wed: MBA, New Home Sales
Thur: Initial, Continuing, GDP, GDP Deflator, Pending Home Sales,
Fri: Personal Income, Personal Spending, PCI Price Index, Durable, Durable ex-trans, Michigan
Int’l:
Mon –
Tues –
Wed –
Thursday –
Friday-
Saturday/Sunday –
How am I looking to trade?
Long term and start to protect early for earnings in October
www.myhurleyinvestment.com = Blogsite
customerservice@hurleyinvestments.com = Email
Questions???
https://www.briefing.com/the-big-picture
The Big Picture
Last Updated: 20-Sep-19 15:10 ET
Climbing wall of worry on an extension ladder
For anyone not familiar with what it means to “climb a wall of worry,” rest assured you are finding out in 2019.
The S&P 500 is up 20.0% year-to-date and is sitting on the doorstep of an all-time high. It has been a great year so far, which is truly remarkable considering it has been a year filled with a litany of not-so-great developments.
Ring It Up
Ladders can be short or tall, but they all have rungs that support a user’s need to climb higher. In that light, let’s look briefly at some of the rungs on which the the market has climbed its wall of worry.
- There has been no earnings growth this year. According to FactSet, Q1 earnings were down 0.2%, Q2 earnings were down 0.4%, and Q3 earnings are projected to be down 3.8%.
- The U.S. and China have raised tariff rates on a huge swath of imported products. Pending an agreement that has yet to be struck, the U.S. will raise the tariff rate on $250 billion worth of imported Chinese goods to 30% from 25% on October 15 while the tariff rate on a $160 billion tranche of imported goods will increase to 15% from 10% on December 15.
- The ISM Manufacturing Index fell into contraction territory for the first time in three years in August.
- Germany’s economy contracted in the second quarter.
- China’s second quarter GDP growth of 6.2% was the lowest it has been on record (covers 27-year period).
- Saudi Arabia’s oil and refining facilities were attacked by a series of drones and missiles. Officials from the U.S. and Saudi Arabia said Iran was behind the attacks.
- The UK’s Brexit path, and timing, are still unclear.
This is not a short ladder. It is an extension ladder and the stock market has been standing tall on it, placing its faith in a number of locking mechanisms that are keeping the ladder extended.
- Economic data continue to show the U.S. consumer is in good shape, which is a major consideration given that consumer spending accounts for roughly 70% of U.S. GDP.
- Interest rates remain extremely low.
- Central banks continue to signal a willingness to provide more monetary policy accommodation.
- There is an abiding hope that political and social considerations will drive the U.S. and China to work out an agreement that defuses trade tensions and leads to lower tariff rates and/or the removal of tariffs altogether.
- There is a burgeoning belief that decelerating economic growth rates around the world will incite a wave of fiscal stimulus.
- There is an expectation that earnings growth will resume as low interest rates, and easier comparisons, create a path for stronger growth in 2020.
Fractions Need Not Apply
We’re basically three-fourths of the way through the year, but we don’t have to use fractions to account for sector winners. The math there is easy. There are 11 sectors and all of them — 100% that is — are up for the year.
The information technology sector is up 30.7% and sits at the top of the ladder. The energy sector sits on the lowest rung, up “just” 6.5%. That’s before dividends, too.
The Nasdaq Composite is up 23%, the S&P 500 is up 20%, the S&P Midcap 400 Index is up 18%, the Dow Jones Industrial Average and Russell 2000 are up 16%. In other words, the stock market’s wealth creation capabilities are being widely distributed at the index level.
Taking a step back from this year’s great performance, though, reveals a market that hasn’t gone all that far. That sounds counter-intuitive as we discuss a 20% move, yet the current standing of the S&P 500 is only 2.8% above where it stood a year ago — and that’s only because the S&P 500 is up 2.8% this month.
Coming into September, the S&P 500 was up just 1.9% from where it stood in January 2018. That’s not a terrible thing considering how far the stock market had come from its March 2009 low, but it goes to show the climb is getting more challenging with a fear of heights setting in.
That’s due in part to a heightened sense of uncertainty that seems to be accompanying each step up the ladder.
- There might be hope that a trade deal is reached, yet President Trump continues to signal that he isn’t going to agree to any deal. He wants a complete deal. That means China will have to make structural changes to its business practices, and it’s a stretch to think China will acquiesce to that demand.
- There is an appreciation for the strength of the U.S. consumer, yet there are worries about the U.S. consumer being dragged down by the pass-through of tariff rates and the contagion effect of slower growth abroad that could feed into job losses at home.
- The Fed is keeping the policy rate low, yet there are doubts about the effectiveness of rate cuts at this point given that they have been low for an extended period and here we are with growth slowing.
- There is close to $17 trillion of negative-yielding bonds around the world, which is both astounding and confounding.
- The current economic expansion in the U.S. is a record, yet there is a growing acknowledgment that the economy is in a late-cycle phase, which is leaving earnings rebound prospects in question.
- Lower tax rates and deregulation have been supportive developments for the continuation of the bull market, but with the 2020 presidential election approaching, there are budding worries in the stock market about those elements being rolled back in the event a Democratic nominee becomes president.
Valuation Matters
There are a lot of “known unknowns” for the stock market to consider, but one important revelation that became known in August is that valuation matters.
The latter might sound pedantic, but in raging bull markets, valuation doesn’t always matter. You get into a phase where price action is all that matters and is defended as confirmation of growth prospects the company will ultimately fulfill.
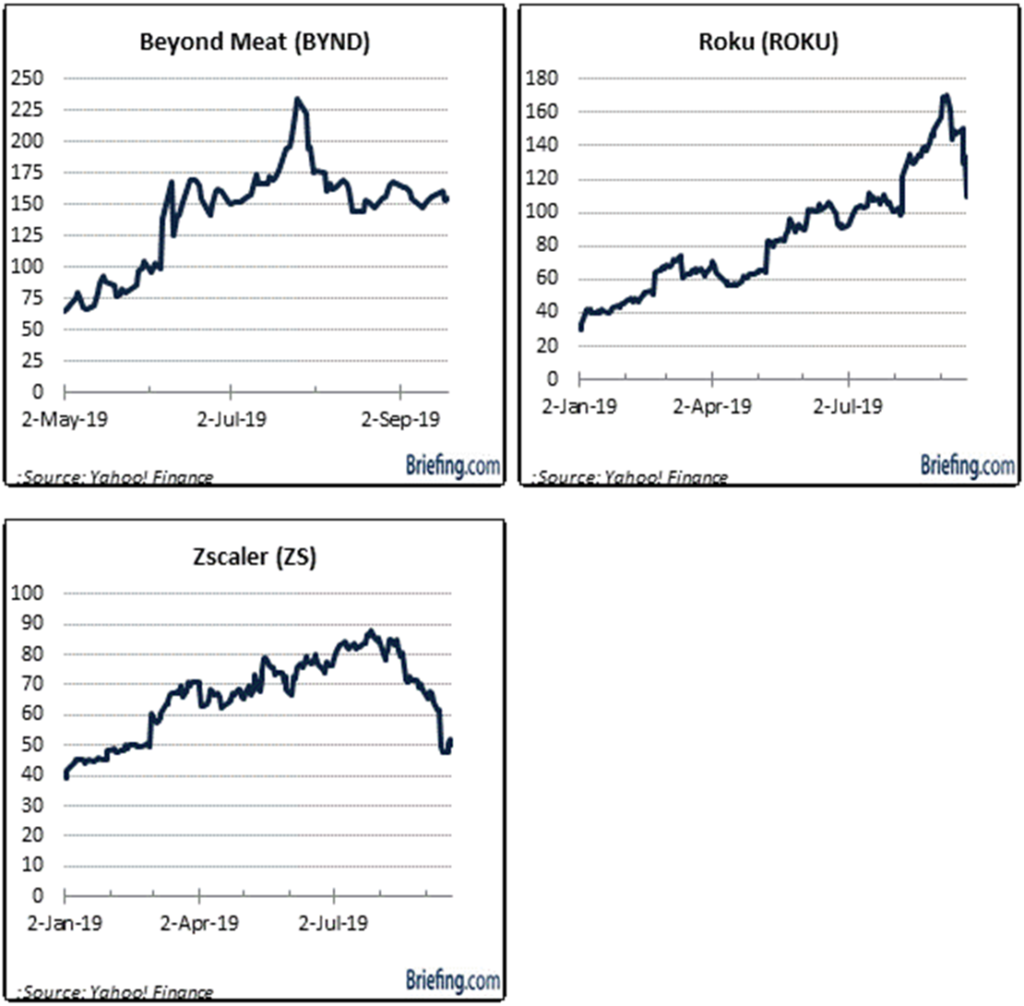
It sounds good; it looks good; and it feels good… until it doesn’t. When the momentum music stops, prices can drop in a hurry, as stocks like Beyond Meat (BYND), Roku (ROKU), and Zscaler (ZS) have all found out recently.
The valuation for the S&P 500 looks far less demanding, but at the same time, it isn’t cheap. The S&P 500 trades at 17.1x estimated forward twelve-month earnings, which is an 8% premium to its 20-yr average.
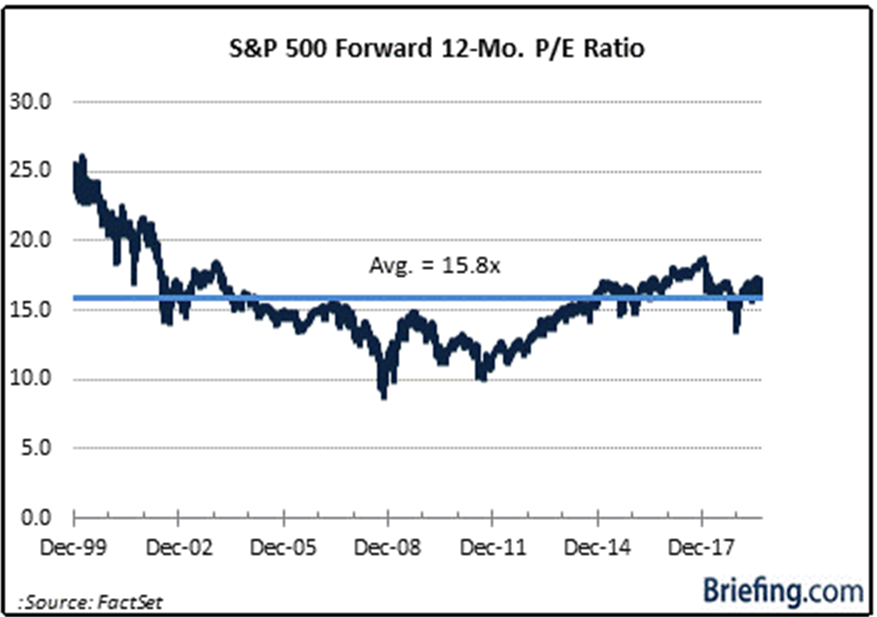
That premium can be justified given the low level of interest rates, and while stocks aren’t “cheap,” they still offer a better relative value than bonds do. To wit, the forward 12-month earnings yield of 5.86% is 410 basis points above the 10-yr note yield versus a five-year average of 370 basis points.
Stocks would look more appealing in their own right if earnings growth was better, but as it stands now, the stock market’s valuation in its own right appears to be full given the doubts that exist about the ability to live up to the higher growth estimates next year.
A fundamental shift in actual earnings trends is needed to mitigate some of the valuation concerns, but even then, one has to consider the prospect that stock market returns are apt to be lower in the coming year given the gains that have been pulled forward in the absence of earnings growth. Furthermore, return prospects would be crimped if interest rates headed higher.
What It All Means
This isn’t a time to run with speculative fever. The climb up the wall of worry has left the market with a full valuation; moreover, a pickup in volatility this year reflects shifting attitudes that connote a sense the “easy money” has been made in this bull market.
There might still be a few rungs to climb, yet one would be well advised to hold the sides of the ladder while climbing, embracing the stocks of companies that are profitable, have good cash flow trends, solid balance sheets, and pay a healthy and secure dividend.
Do so knowing this 10-year old bull market is climbing an extension ladder with some kinks developing in its locking mechanisms. If those mechanisms ultimately fail, the fall will be swift and certainly more painful for investment portfolios that aren’t well diversified and which have favored story stocks, as opposed to quality stocks, while climbing the wall of worry.
—Patrick J. O’Hare, Briefing.com
Warren Buffett has kept the same investing philosophy for decades, early interview shows
PUBLISHED SUN, SEP 22 2019 9:15 AM EDT
KEY POINTS
- Despite over 30 years since his first televised profile, Warren Buffett still touts a bargain-based philosophy complete with the occasional quip or baseball analogy.
- “You literally every day have thousands of the major American corporations offered to you,” Buffett said in 1985. “And you don’t have to make any decisions … There are no called strikes.”
- If you’d invested $10,000 in Berkshire at the start of 1985 you’d now have $2.4 million; the same principal in the S&P 500 would be worth about $227,000.
The U.S. stock market has seen remarkable change over the last 34 years between the meteoric rise of low-cost passive investing, algorithmic trading and the real-time digitization of financial filings.
But Wall Street’s most revered investor, decades later, is still touting the same advice.
In one of Warren Buffett’s first televised profiles, the “Oracle of Omaha” explained a simple method of investing that prioritizes an insatiable hunt for bargains, patience, and the occasional baseball analogy. A video of the interview circulated on Twitter on Monday after being shared by user Lyall Taylor.
“In the securities business, you literally every day have thousands of the major American corporations offered to you at a price and at a price that changes daily. And you don’t have to make any decisions. Nothing is forced upon you. There are no called strikes in the business,” Buffett said.
“They may be wonderful pitches to swing at, but if you don’t know enough, you don’t have to swing. And you can sit there and watch thousands of pitches and finally you get one right there where you want it … and then you swing,” he continued.
If Buffett’s advice from PBS’s “Adam Smith’s Money World” more than 30 years ago rings a bell, it’s likely because he’s hardly changed his tune over his many profitable years on Wall Street.
Berkshire Hathaway has posted average annual returns of 17.1% since 1985, well ahead of the broader stock market’s 10.5% including dividends. If you’d invested $10,000 in Berkshire Hathaway at the start of 1985 you’d now have $2.4 million; the same principal in the S&P 500 would now be worth about $227,000.
‘No called strikes’
In one part of the 1985 interview, Buffett explains that the key to good value investing is about exploiting one’s “area of competence” in determining the real value of a business. Then, taking advantage of one’s expertise in a group of stocks, an investor can sometimes find upside opportunities when the market prices the securities below their actual worth.
Fourteen years later, at Berkshire Hathaway’s 1999 stakeholder meeting, Buffett would tell investors that “different people understand different businesses. And the important thing is to know which ones you do understand and when you’re operating within what I call your ‘circle of competence.’”
“There are all kinds of things I’m not competent to value … There are few I am competent to value,” Buffett said in 1985. “There are all kinds of things I don’t know about, and that may be too bad, but why should I know all about them?”
Buffett, the chairman and CEO of Berkshire Hathaway, has served as a model for a generation of investors with a frugal, bargain-based buying strategy stemming from his education under “Father of Value Investing” and Columbia professor Benjamin Graham.
CNBC has decades of Berkshire Hathaway meeting transcripts and interviews with Buffett himself in its Buffett Archive.
In addition to inspiring legions of value investors across the globe, Buffett’s investment philosophy also contributed to his immense personal wealth of over $80 billion, according toForbes. Though the sum makes him the world’s third richest person behind Amazon CEO Jeff Bezos and Microsoft founder Bill Gates, Buffett has pledged to donate more than 99% of his worth to charitable causes.
‘You don’t need tons of IQ in this business’
While Buffett has long credited his focus on his own “circle of competence” for his success, he also tends to invest in companies with minimal debt, reliable cash flows and sounds management teams. He also told “Money World” host George Goodman in 1985 that a good investment manager isn’t a necessarily a genius, but someone with a calm disposition.
“You don’t need tons of IQ in this business. I mean, you have to have enough IQ to get from here to downtown Omaha, but you do not have to be able to play three-dimensional chess,” Buffett quipped.
“You need a stable personality,” he continued. “You need a temperament that neither derives great pleasure from being with the crowd or against the crowd because this is not a business where you take polls. It’s a business where you think.”
Another investment tenant the 89-year-old has touted throughout his career is remembering to think about each holding as proof of ownership.
“Most of the professional investors focus on what the stock is likely to do in the next year or two. And they’ve all kind of arcane methods of approaching that, but they do not really think of themselves as owning a piece of a business,” Buffett told Goodman.
“The real test of whether you’re investing from a value standpoint or not is whether you care whether the stock market is open tomorrow,” he explained. “If you’re making a good investment in a security, it shouldn’t bother you if they closed the stock market for five years.”
The stock market rotation that rocked investors this month may have been driven by a technicality
PUBLISHED SAT, SEP 21 2019 8:45 AM EDTUPDATED SAT, SEP 21 2019 11:58 AM EDT
KEY POINTS
- The reversal in momentum, which seemed to abate this week, could be explained by a sudden stop in tax loss harvesting, some on Wall Street said.
- Investors often sell losing stocks to lower their capital gains tax bill.
- Tax loss selling might have stopped due to speculations the Trump administration would pass a bill to reduce capital-gain taxes, according to Barclay’s head of equity derivatives strategy Maneesh Deshpande.
What exactly happened during the “once in a decade” stock market rotation earlier this month that rocked investors? It might’ve just been a one-off technical move and not based on fundamentals.
A huge rotation out of momentum into value names took place suddenly last week. Many read the phenomenon as a warning sign as stocks with superior growth have led the market’s bull run in recent years and said a rebound in interest rates was the catalyst. However, the reversal in momentum, which seemed to abate this week, could be explained by a sudden stop in tax loss harvesting, some on Wall Street said.
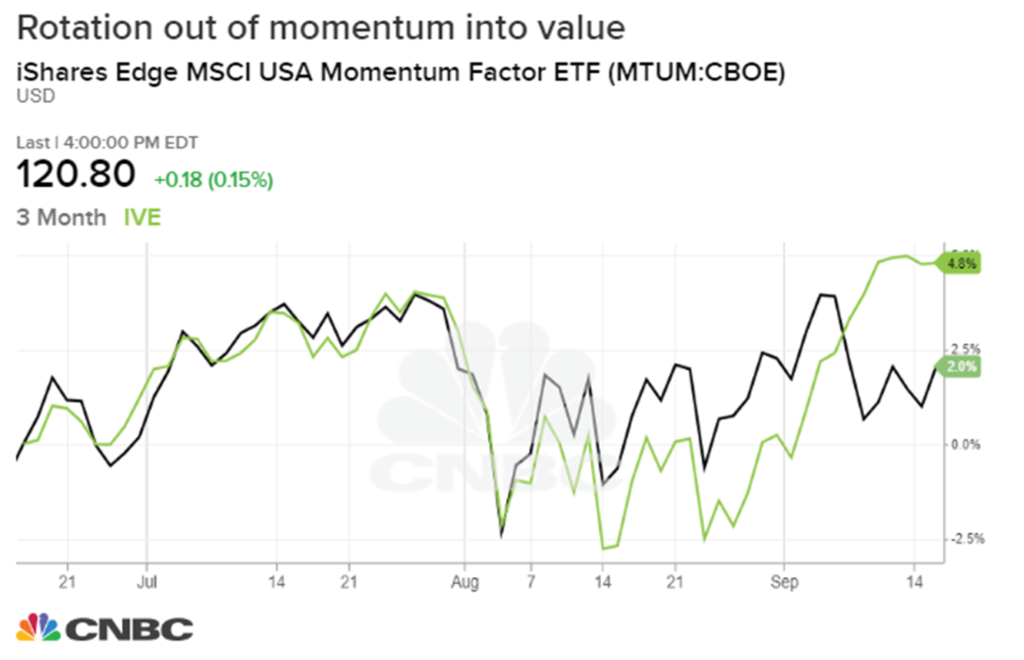
The idea is that investors often sell losing stocks to lower their tax bill from the capital increases, a technical move that’s quintessential of a momentum trade — chasing winners and dumping losers. The amount of such activity might have decreased significantly last week due to speculations the Trump administration would pass a bill to reduce capital-gain taxes, therefore reducing the incentive to sell their losers.
“It’s quite possible some of the dominant robo advisors could have assumed that the U.S. administration would indeed follow through with its proposal on Sept. 9, and decided to change their optimization to take this into account,” Barclay’s head of equity derivatives strategy Maneesh Deshpande said in a note on Wednesday.
President Donald Trump earlier this month floated a proposal to tie capital gains taxes to the inflation rate, which could lower the taxes investors pay on profits from selling assets. He eventually ruled out such a plan on Sept. 11. But the discussion around the proposal last week coincided with the change in stock leadership that shocked many investors.
Tax loss harvesters might have stopped selling losers and adding winners on the prospect that capital-gains taxes would go down, which could make tax loss selling less beneficial. Such a change could have caused the downturn in momentum due to less selling of falling stocks and less buying of rising names.
The amount of active tax loss harvesting has ballooned over the years as robo-advisers, which automatically allocate assets in a tax efficient way, gained popularity on Main Street. Robo-advisers now manage about $1 trillion assets, up from $240 billion in 2007, according to Barclays.
“Of course, it is also entirely possible that some other investors would have put on the trade in anticipation of such a proposal,” Deshpande said.
The iShares S&P 500 Value ETF hit its highest level since January 2018 on Sept. 11 as the rotation hit its pinnacle.
Value, cyclical companies with low prices relative to earnings and book values tend to be sensitive to economic growth. However, embracing the group without a material change in the economy doesn’t make a lot of sense, analysts warned.
“Absent an improvement in underlying economics, we believe that the recent shift in leadership is unlikely to persist,” Jonathan Golub, chief U.S. equity strategist at Credit Suisse said in a note Monday.
52% of Americans are considered ‘middle class’—here’s how much money they earn
Published Sat, Sep 21 2019 10:30 AM EDT
Lesia Skywalker | Twenty20
According to a 2018 report from the Pew Research Center, 52% of American adults live in “middle class” households. The median income of that group was $78,442 in 2016.
Pew defines the middle class as adults whose annual household income is two-thirds to double the national median. That’s after incomes have been adjusted for household size, since smaller households require less money to support the same lifestyle as larger ones.
About one-fifth of American households, 19%, are considered upper class, while 29% are lower class. The median income of upper class households was $187,872 in 2016. For lower income households, it was $25,624.
These numbers are in 2016 dollars and scaled to reflect a three-person household.
Pew looked at various household sizes. Here’s the income range you’d have to earn each year to be considered middle class, depending on the size of your family:
- Household of one: $26,093 to $78,281
- Household of two: $36,902 to $110,706
- Household of three: $45,195 to $135,586
- Household of four: $52,187 to $156,561
- Household of five: $58,347 to $175,041
5:46
How a 23-year-old making $50K in Brooklyn spends her money
The share of U.S. adults considered middle class varies depending on where you live, Pew notes: “The 10 areas with the highest concentrations of middle class adults are located in the Midwest or the Northeast, with the exception of Ogden-Clearfield, Utah. These areas are also more reliant on manufacturing than the nation overall.”
The metro with the highest share is Sheboygan, Wisconsin, where 65% of adults are considered middle class.
Use Pew’s income calculator to find out which group you are in, compared to other adults in your metro and among American adults overall. It also lets you find out which group you’re in compared with other adults similar to you in education, age, race or ethnicity and marital status.
Even if the Fed cuts rates to zero, market bear David Rosenberg predicts a recession is less than 12 months away
PUBLISHED SUN, SEP 22 2019 5:00 PM EDT
Stephanie Landsman@STEPHLANDSMAN
Despite the Federal Reserve’s latest efforts to boost the economy, long-time market bear David Rosenberg warns a recession is coming.
The Gluskin Sheff chief economist and strategist predicts economic growth in the U.S. will turn negative sooner than most investors anticipate — setting the stage for a painful market pullback.
“There’s a recession coming in the next 12 months,” he said last Thursday on CNBC’s “Futures Now.
The Fed lowered its benchmark interest rate last Wednesday by a quarter point. Fed Chairman Jerome Powell signaled rates would only be cut again if there’s new evidence the economy is softening. However, Powell said he didn’t expect that to happen.
“The only reason that he said that he’s optimistic on the outlook is because of exactly what the Fed is doing which is breathing stimulus back into the economy,” said Rosenberg, who came into 2019 with a recession warning and has been known as a perma-bear on Wall Street for decades.
Yet, U.S. growth hasn’t gone negative this year. Plus, the S&P 500 and Dow are up more than 19% and 15%, respectively.
But according to Rosenberg, it’s just a matter of time until economic data sours and Powell is forced to resume easing in the coming months.
“I think that they’ll go in October and December and through 2020,” he added.
Whether the Fed cuts all the way to zero or not, Rosenberg speculates the outcome will be the same: Recession.
“The economy is already slowing down,” Rosenberg said. “Earnings are actually contracting.”
https://www.cnbc.com/2019/09/15/ron-paul-us-interest-rates-are-going-negative.html
Ron Paul: US interest rates are going negative, and the Fed can’t stop it
PUBLISHED SUN, SEP 15 2019 5:00 PM EDTUPDATED MON, SEP 16 2019 8:50 AM EDT
Stephanie Landsman@STEPHLANDSMAN
Ron Paul is warning negative interest rates will crush the global economy.
The former Republican congressman from Texas believes the U.S. won’t be the exception.
“We will join the rest of them and go to total negative rates in hopes that that will be the solution,” he told CNBC’s “Futures Now” on Thursday. “We’ve never had as many currencies in negative interest rates. $17 trillion worth of bonds [are] in negative interest rates. It’s never existed before. And, that’s a bubble. So, we’re in the biggest bond bubble in history, and it’s going to burst.”
Paul, a former presidential candidate and vocal libertarian known for his economic and stock market bubble warnings, contends the Federal Reserve’s policies are powerless in this environment. He doesn’t believe this week’s Fed meeting will provide any kind of relief and cutting rates will not be the answer.
“You can’t predict exactly where the creation of credit goes,” said Paul. “We have a ton of inflation with all that QE [quantitative easing]. And, every time you lower interest rates below market levels and create new credit, that’s a bubble.”
Paul has been waving the red flag for years, warning that a once in a lifetime market drop of 50% or more will strike stocks. With bonds yielding negative rates now in focus, he suggests the danger is ballooning to unseen levels.
Yet, he’s unsure of the timing of a collapse.
“You don’t know this precise time. But you know it can happen,” he said. “How do you sell a bond that pays a negative rate? Who’s going to jump up and down?”
Flashback October 2018
But what a difference a year makes.
Paul was worried about the other extreme last October — when the benchmark 10-year Treasury note yield rallied to seven year highs and hit 3.26%, creating inflation jitters.
“It can be pretty well validated by looking at monetary history that when you inflate the currency, distort interest rates and live beyond your means and spend too much, there has to be an adjustment,” Paul told “Futures Now” last October. “We have the biggest bubble in the history of mankind.”
On Friday, the 10-year yield closed at 1.9%, its highest level since August 2.
So, why is Paul still warning an epic bond bubble will burst an create chaos if rates are no longer above 3%?
According to Paul, central banks which drastically lower interest rates destroy the pricing mechanism in financial markets.
“I don’t think anything even existed coming close to what we’re facing today,” Paul said.
Jim Cramer reveals ‘quick and dirty’ Wall Street tricks for buying cloud stocks
PUBLISHED MON, SEP 16 2019 7:16 PM EDTUPDATED MON, SEP 16 2019 7:41 PM EDT
Tyler Clifford@_TYLERTHETYLER_
KEY POINTS
- “We’re in triage mode, and that means we need to be as objective as possible,” CNBC’s Jim Cramer says.
- “We’re going to run our whole cloud universe through these two filters — one is for fundamentals, one is for valuation,” the “Mad Money” host says.
- “Anything that passes both filters, well then you’ve got my blessing buy down here after the big sell-off,” he says.
CNBC’s Jim Cramer on Monday revealed “quick and dirty” tricks that investors can use to assess enterprise software stocks like a Wall Street expert.
High-flying cloud equities have taken double-digit hits in recent weeks due to the rotation from secular to cyclical investments. Because of this, the “Mad Money” host warned it’s time to be “more selective.”
“When you make these kinds of decisions, you need to be ruthlessly logical, not emotional … We’re in triage mode, and that means we need to be as objective as possible,” he said. “We’re going to run our whole cloud universe through these two filters — one is for fundamentals, one is for valuation. Anything that passes both filters, well then you’ve got my blessing buy down here after the big sell-off.”
The first tool that Cramer broke down is what’s called the rule of 40, where a company’s revenue growth and profit margin should add up to 40% or more. Venture capitalists and hedge funds use the rule to calculate the tradeoff in growth and profitability. Anything below that threshold is a red flag for a stock portfolio.
A combination of 30% revenue growth and 20% profit margin passes the screening. A measure of 70% revenue growth and negative 20% profit margin is also a passing grade, but 50% growth and negative 15% margin is a failing mark.
“I like this rule of 40 because it recognizes that there are two ways to win,” Cramer said. “The healthiest cloud stocks are either growing very rapidly and losing money or their growth is slowing, but they’ve got increasingly strong earnings.”
Using EBITDA — adjusted earnings before interest, taxes, depreciation and amortization — for profit margin, Cramer determined that all seven stocks in his so-called ‘Cloud Kings’ bucket pass, led by Twilio and Adobe with scores of 82% and 68%, respectively. Among his riskier ‘Cloud Prince’ group, both New Relic and Okta come up short.
A second test that Cramer suggested investors run the cloud names through is valuation. Stocks that trade above 10-times sales fail, “unless we can come up with a very good excuse,” he said.
The host gave Adobe, which sells for 10.4-times 2020 sales estimates, a pass because of its profitability. However, ServiceNow at eleven times its 2020 forecast did not make his cut.
“When you try to be objective about the cloud stocks, the ones that you to keep are Adobe, Salesforce, Splunk, Twilio, VMware, Workday, HubSpot, Five9, RingCentral, Zendesk and Dynatrace,” Cramer said. “Everything else … you need to be a lot more cautious.”
The Dollar Shortage & Liquidity Crisis?
56
Blog/Interest Rates
Posted Sep 23, 2019 by Martin Armstrong

The NY Federal Reserve announced last week that they will continue their repo operation until October 10th, 2019. The repurchase agreements will amount to up to $75 billion per day. Additionally, they plan to offer three two-week repo operations of up to $30 billion each round.

The constant intervention of the Federal Reserve into the REPO market is the result of a global dollar shortage on a monumental scale. There is a liquidity crisis unfolding as CONFIDENCE is collapsing in Europe and Asia. The Federal Reserve has been intervening into the REPO market in a desperate effort to maintain its lower target on interest rates.
I have been warning that about 70% of physical paper dollars is now circulating outside the USA. There are also now more $100 bills in circulation than $1. With the rising pressure outside the USA to eliminate cash in order to confiscate money from their citizens to support the broadening collapse of socialism, there has been a MAJOR panic pushing into the dollar.
Despite the fact that early in 2019 the headlines were that foreign governments were dumping US debt spinning this into stories that the dollar would crash. In reality, selling of US debt at that point in time was an effort to stop the dollar’s rise. However, as the world economy continues to implode going into the bottom of the business cycle as measured by the Economic Confidence Model, exactly the opposite has been taking place. As of July 2019, the foreign holding of US debt rose to $6,630.5 billion up from July 2018 $6,254.4 billion.
(SEE Fed Data: US Debt Foreign Holding July 2019)
The increase from $6.2 trillion to $6.6 trillion is showing the scramble into dollars even on an official level. As more and more US debt is taken up overseas as a hedge against the rising risk of the punitive sanctions of canceling foreign currencies as Christine Lagarde is preparing to take charge of the European Central Bank in October, the panic into the dollar assets is removing US debt from domestic holdings resulting in a LIQUIDITY CRISIS beyond anything you will find in the traditional economic textbooks.

We invented Capital Flows analysis. We have the only real database tracking capital flows historically. There will be numerous people who will now repeat what is written here as if it were their original analysis. Without a database, it is hard to imagine how they can make such claims since this is NOT based upon opinions or reading news headlines.
So welcome to the new world where economic theories are crumbling before our eyes and falling to the floor as dust in a world that no longer exists. We are entering a new period of reality where whatever you thought was happening may prove to be the opposite.
HI Financial Services Mid-Week 06-24-2014