
HI Market View Commentary 09-02-2019
Hurley Investments believes in the collar trading strategy! WHY?
Long stock, with a Long put, and a short call
Adjusting means when bullish maybe just run the long stock position
Uncertain maybe run a protective put
If it looks ugly run all the positions in a mostly net neutral delta
Because we make up SOME of the downward movement
Because we can dollar cost average with out having you put more money into the account
Great opportunities to add more shares for the next ruin to the upside
AAPL would cost 18.6% of the value of the stock to always have it protected
We are coming off a 10 year historic bull market run
I protect at the most probable times stocks can drop – IE….earnings
I’ve worked too hard to randomly just let my money go up and down
Where will our markets end this week?
Hihgher
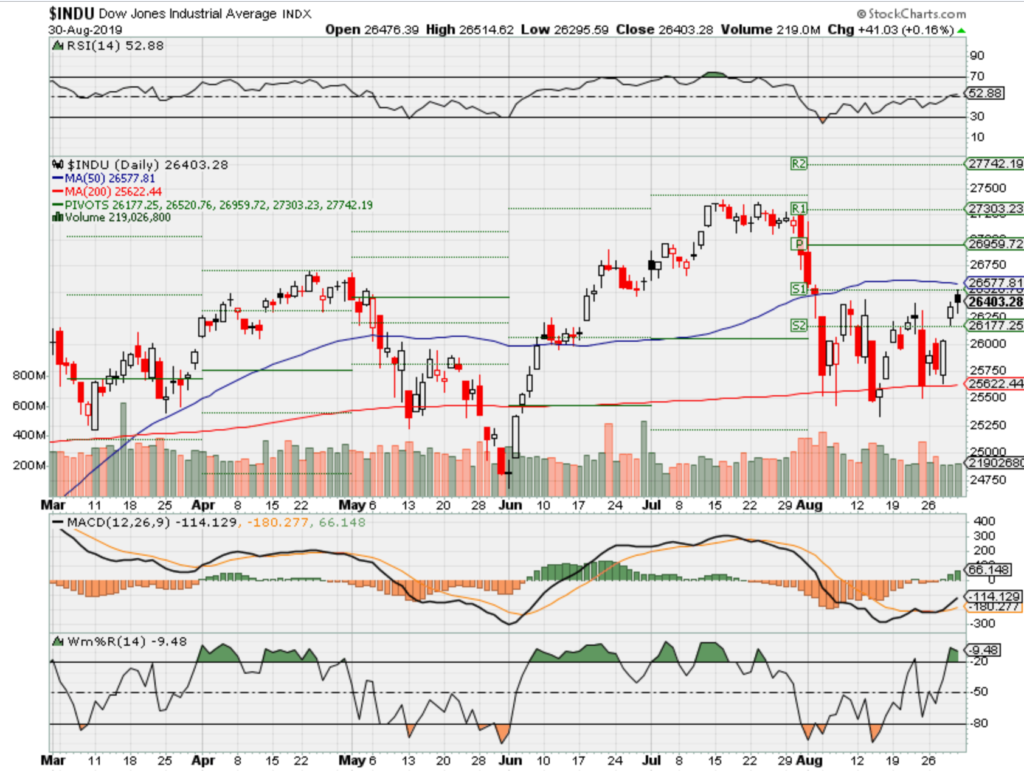
DJIA – Bearish
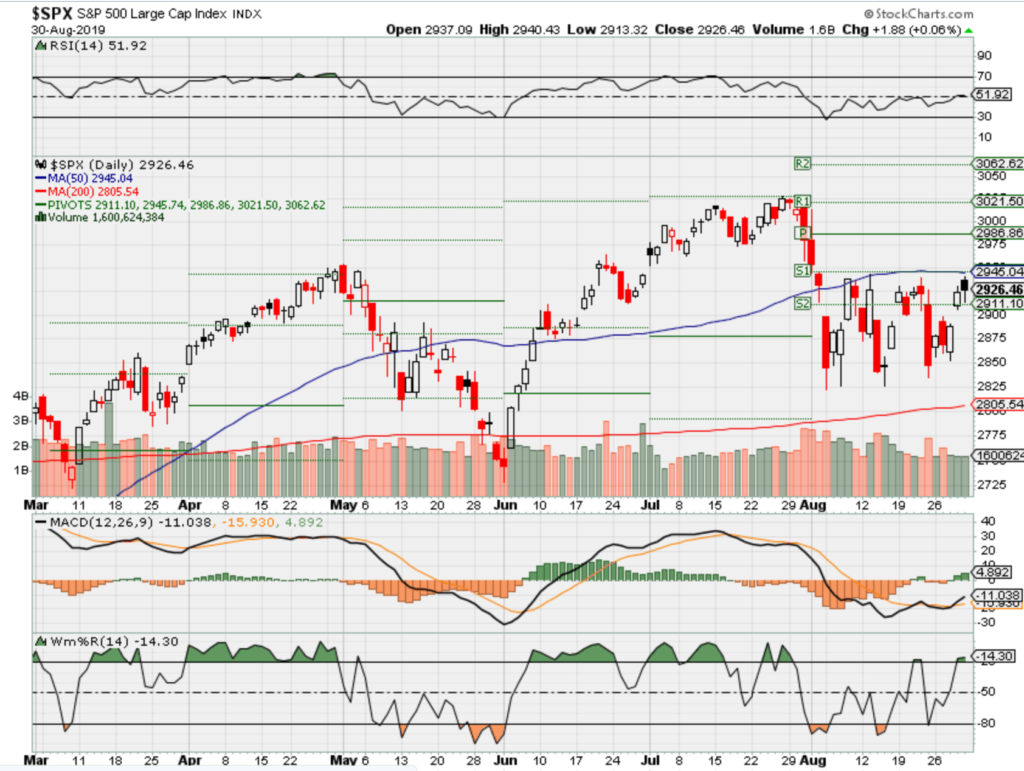
SPX – Bearish
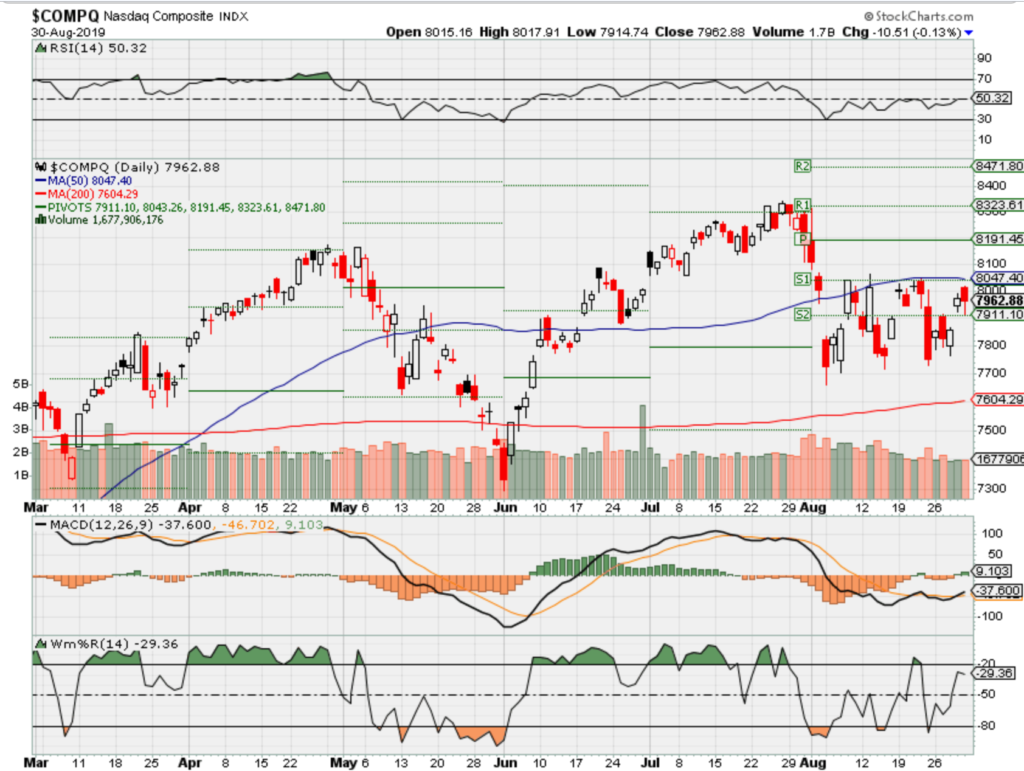
COMP – Bearish
Where Will the SPX end Sept 2019?
09-02-2019 -1.0%
08-26-2019 -1.0%
Earnings:
Mon:
Tues:
Wed: AEO, PANW
Thur: LULU, DOCU, KIRK
Fri: GCO
Econ Reports:
Mon:
Tues: Construction Spending, ISM Manufacturing, Auto, Truck
Wed: MBA, Trade Balance, Beige Book
Thur: Initial, Continuing, ADP Employment, Productivity, Unit Labor Cost, Factory Orders, ISM Services,
Fri: Average Workweek, Non-Farm Payrolls, Private Payrolls, Unemployment Rate, Hourly Earnings,
Int’l:
Mon –
Tues –
Wed –
Thursday –
Friday-
Saturday/Sunday –
How am I looking to trade?
I’m preparing for earnings = Adding long puts
MU – 9/19 est
www.myhurleyinvestment.com = Blogsite
customerservice@hurleyinvestments.com = Email
Questions???
I’ve noticed that most of the time you add shares and then you do NOT add a protective put again
https://seekingalpha.com/article/4288007-5-reasons-buy-shares-ford?dr=1#alt1
5 Reasons To Buy Shares Of Ford
Aug. 26, 2019 4:19 PM ET
Summary
Ford’s shares now have a dividend yielding 6.8%.
Stock is on a downtrend that accelerated after China imposed tariffs on U.S. imports.
Buy and hold explained.
Looking for a portfolio of ideas like this one? Members of DIY Value Investing get exclusive access to our model portfolio. Get started today »
Ford (F) is a frustrating stock to own. Although I added to my position, the stock is not a DIY top idea pick. Its constant underperformance to the market suggests there is no alpha in holding Ford’s shares. On the charts, Ford exhibited a “double top” at $10.50 and fell from there, trading recently at $8.85. While one may find solace with General Motors (GM) dipping just as Ford did on the markets, why invest in Ford?
There are five reasons not to give up yet on Ford.
1) Dividend Yield
Ford’s shares pay a hefty dividend of 6.84% annually. But just as my Altria(MO) dividend-income pick pays a 7.24% yield, a falling stock is still a paper loss. As selling momentum (through higher trading volume) accelerates, Ford could re-test the January 2019 low of $7.41. This is due to two reasons. First, China is retaliating against the U.S. tariffs levied against it. It will resume duties on U.S. automobiles and $75 billion worth of U.S. goods. Even after GM reported a strong quarter and performance will likely improve throughout the year, GM’s stock also fell. Similarly, GM’s stock fell 11% in the last month compared to the 8% drop in Ford’s shares.
Ford’s light forecast for full-year 2019 may give bulls a reason to lose hope. It forecast a full-year EPS of $1.20-$1.35, below the $1.39 consensus. EBIT of $7.07 billion-$7.5 billion is above the $7.08 billion consensus. The strong cash flow growth and disciplined operating spend will assure investors the dividend rate is here to stay.
2) Doubling Down on Trucks, SUVs
Ford will cut SKUs by stopping production of some of its automobiles. Ford will assert its efforts in the SUV and truck market while retiring the C-MAX and Fusion lines. Simplifying the business will lead to higher ASPs and profits. People demand bigger vehicles through SUVs and trucks. Falling oil prices will encourage consumers to go big, too. Even if the trade war miraculously ends (I forecast no deal for the next 1.5 years), lifting gas prices, demand for bigger vehicles will not change. Ford and other firms are adhering to California emission regulations. By offering more fuel-efficient, big vehicles, Ford will expand profit margins in the years ahead.
Ford’s portfolio of SUVs includes the Escape, Explorer, Aviator, and Territory, all of which have a hybrid or electric offering. The Explorer will have the broadest lineup ever offered, including a hybrid and ST version. The Aviator represents Lincoln’s new entry in the mid-sized luxury market. The return of the Ranger and the Bronco may win back fans. The F-series, which benefits from the highest transaction price in the truck and commercial vehicle space, will continue to contribute positively to results. And in the automobile space, the Mustang-inspired BEV SUV might earn Ford some praise.
3) Cost-Cutting
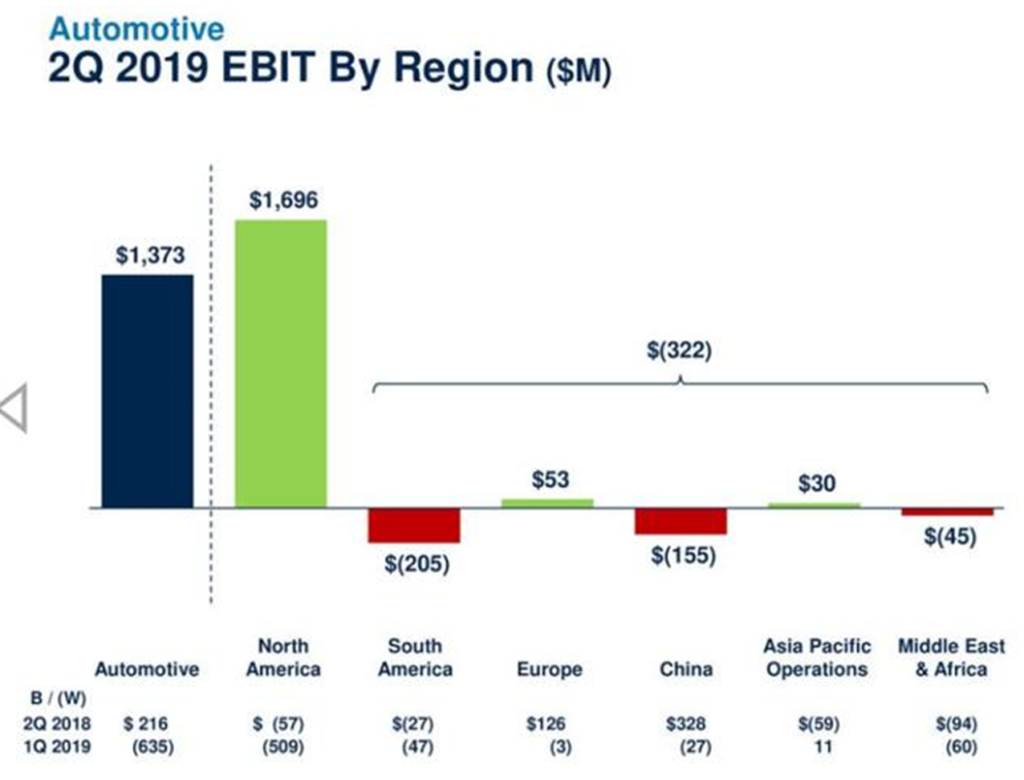
For years, Europe dragged Ford’s overall results, so cutting 12,000 positions and streamlining marketing and sales units should not surprise shareholders. Here, discontinuing the C-MAX, Grand C-MAX, and KA+ should lower costs and drive the unit towards profitability. Ford still has more work to do in cutting costs. South Africa, China, and the Middle East and Africa are still EBIT negative:
Source: Ford Motor Co.
4) Autonomous Vehicles Rollout
Ford increased its Argo headcount by 50% to ramp up autonomous vehicle development. Within the $264 million in EBIT losses of $264 million, autonomous vehicle costs were $79 million. This is a necessary short-term expense that will pay off for the company in the next few years. Ford chose a third city in which it will deploy autonomous vehicles commercially. It will announce the location later this year. Argo AI won a license in California for AV testing.
Note: readers who would like to read more on my ADAS coverage may look at Ambarella (AMBA) or NXP Semiconductors(NXPI)
5) Valuation
Markets continue to punish Ford with low valuations, which prevents shareholders from enjoying any capital gains. In a P/E Multiples model, if investors are willing to pay 7.5 times to 8.5 times forward P/E, then fair value is $10.49:
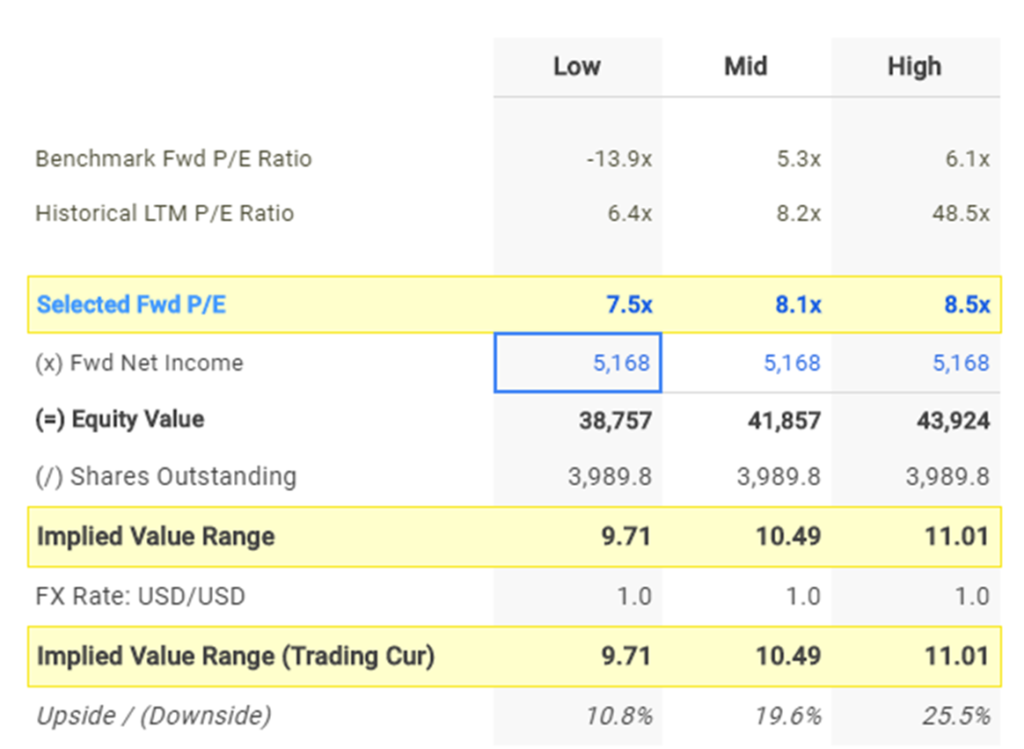
Source: finbox.io
Conversely, investors may model a revenue drop this fiscal year, followed by modest single-digit revenue growth for the next four years. In this 5-year DCF Revenue Exit model, Ford’s fair value is around $10.00:
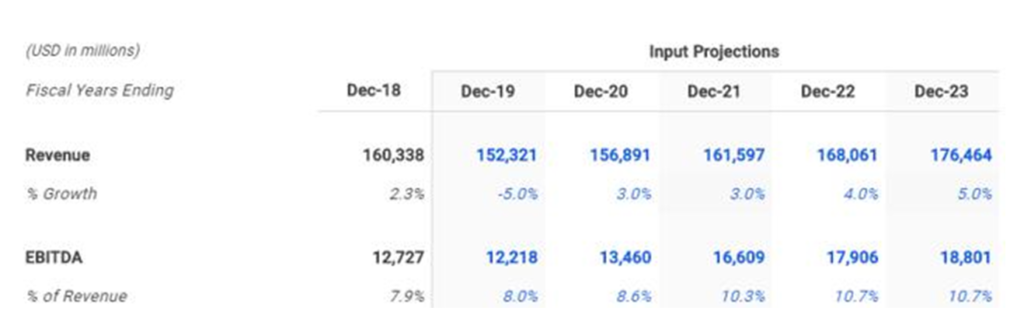
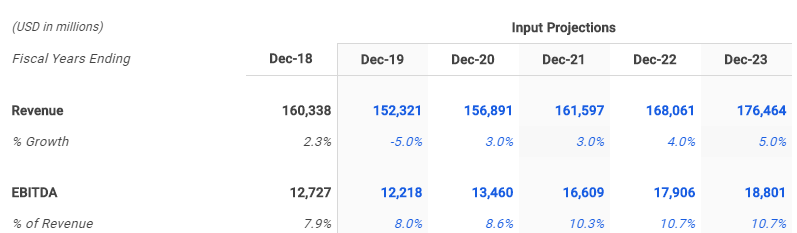
Source: finbox.io (click on the link to open target price)
Your Takeaway
Ford is not a stock on my DIY value investing subscription list because its uptrend will take too long to play out. For investors looking for consistent dividend income, Ford is a good buy and hold stock.
Please [+]Follow me for deeply-discounted picks while avoiding value traps like Himax Technologies. Click on the “follow” button beside my name.
Also, I am inviting you tune up your trading style through the DIY (do-it-yourself) investing marketplace.
Disclosure: I am/we are long NXPI, F. I wrote this article myself, and it expresses my own opinions. I am not receiving compensation for it (other than from Seeking Alpha). I have no business relationship with any company whose stock is mentioned in this article.
https://seekingalpha.com/article/4288618-bank-america-stock-will-alpha-beast?dr=1
Bank Of America – This Stock Will Be An Alpha Beast Again
Aug. 29, 2019 8:48 AM ET
Summary
Bank of America is down significantly over the past 12 months and seems to break-down from a technical point of view.
Traders are starting to price in macro headwinds while the company continues to report stunning quarterly results.
Bank of America is not the place to be right now, but not having this stock on your watchlist would be a huge mistake.
I have to say that I was very excited to write this article. Not only is Bank of America (BAC) one of the largest banks in the world, the bank is also an incredible trading vehicle. The company is currently in a very difficult situation of falling rates and slowing economic growth. Nonetheless, I am not complaining as I am convinced, we will get great entry points in the future for both traders and long-term investors. In this article, I will tell you what I am looking for and why Bank of America is a must have on everyone’s watch list. So, bear with me.
It’s (Always) Macro
One of the most important articles I have written this summer is the one that explained why I am bullish on bonds.
Source: Article
The key reasons behind the ongoing bond yield decline can be seen below.
- Global economic growth peaked in Q1 of 2018
- US economic growth peaked a few months later in Q4 of 2018
- Bond yields are suggesting a new Fed easing cycle
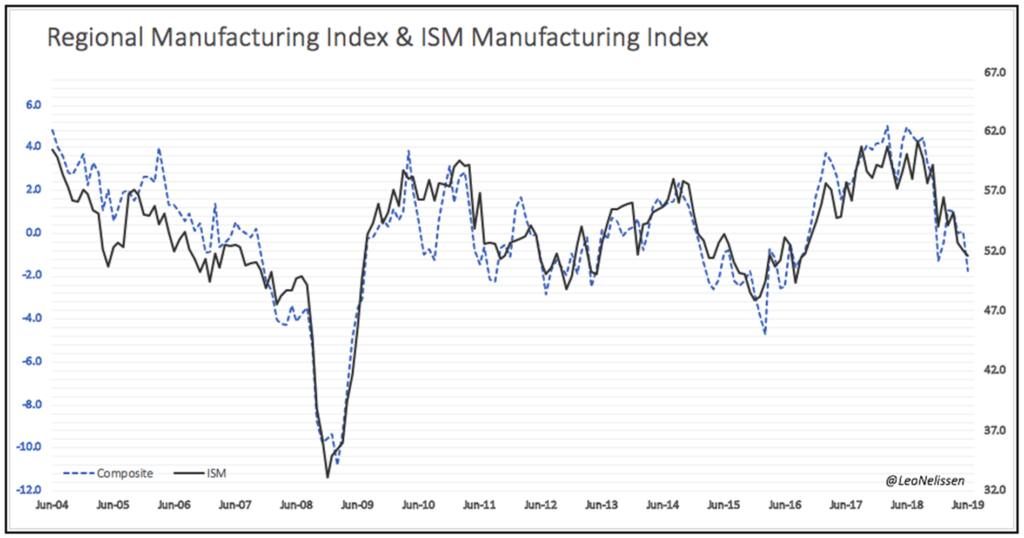
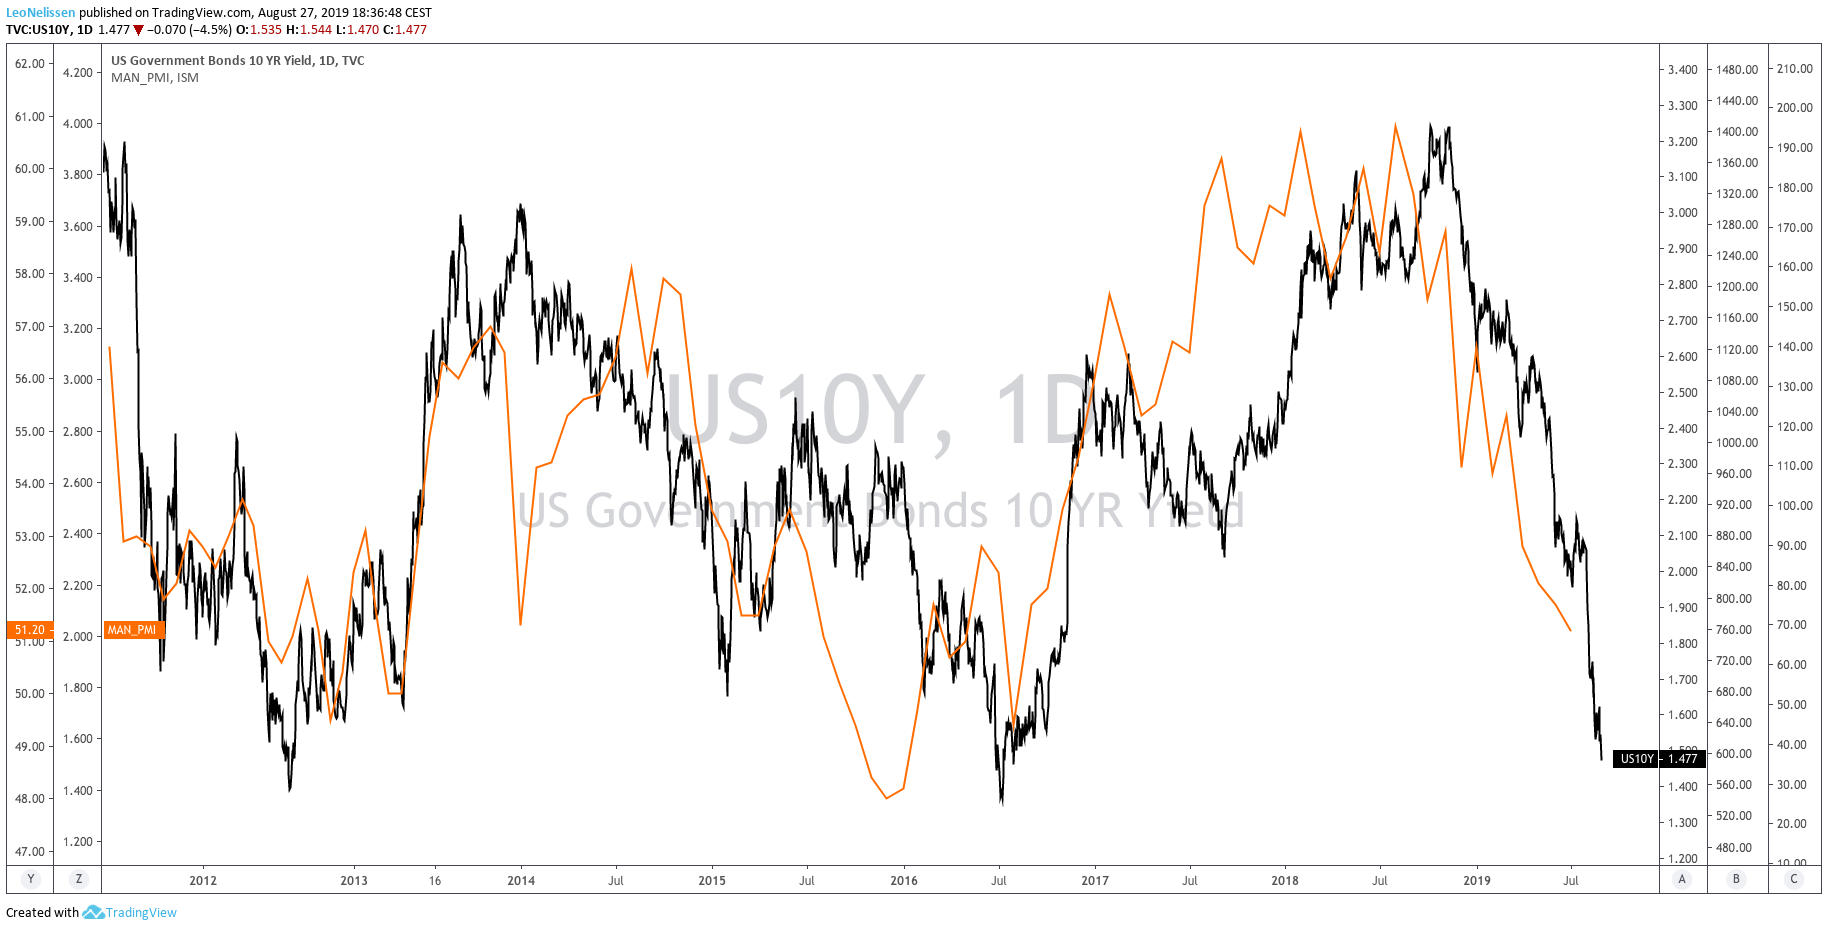
I always use the ISM manufacturing index to display US economic growth as this indicator is a leading indicator, meaning that the index predicts ‘hard’ economic data’. Both regional manufacturing surveys and the ISM index hit new lows in July after peaking at the end of 2018. The ISM index fell to 51.7 which is just 1.7 points above the neutral level of 50.0. Numbers below 50.0 indicate economic contraction.
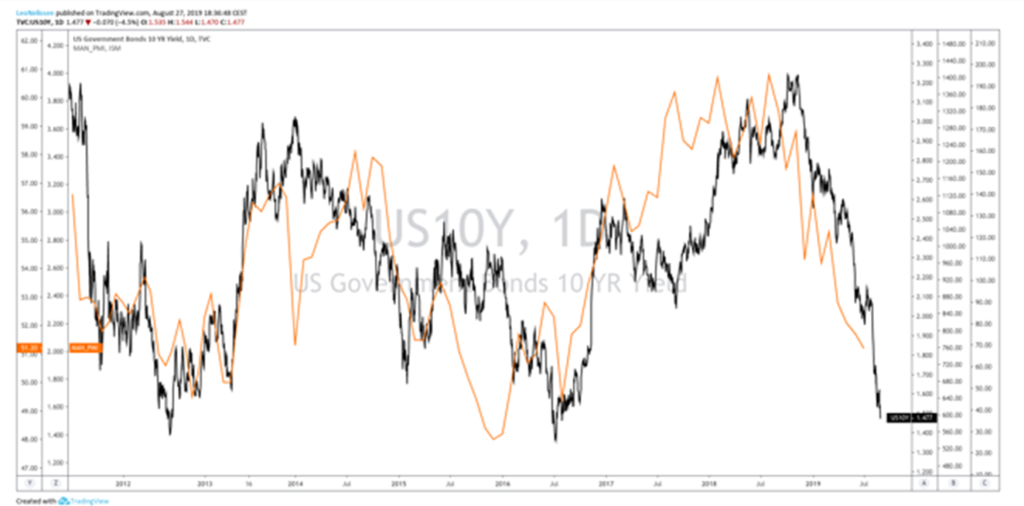
At this point, one could (and many have) make the point that the economy is still growing. That’s correct. Unfortunately for stocks however, traders are starting to price in much slower growth.
Below, you see what happens to bond yields (black line) during economic downturns. The orange line displays the ISM manufacturing index. Bond bears did not stand a change in December of 2018 when yields started to peak. Right now, we are in a full-blown meltdown pushing the US 10-year yield dangerously close to 2016 bottom levels.
Source: TradingView
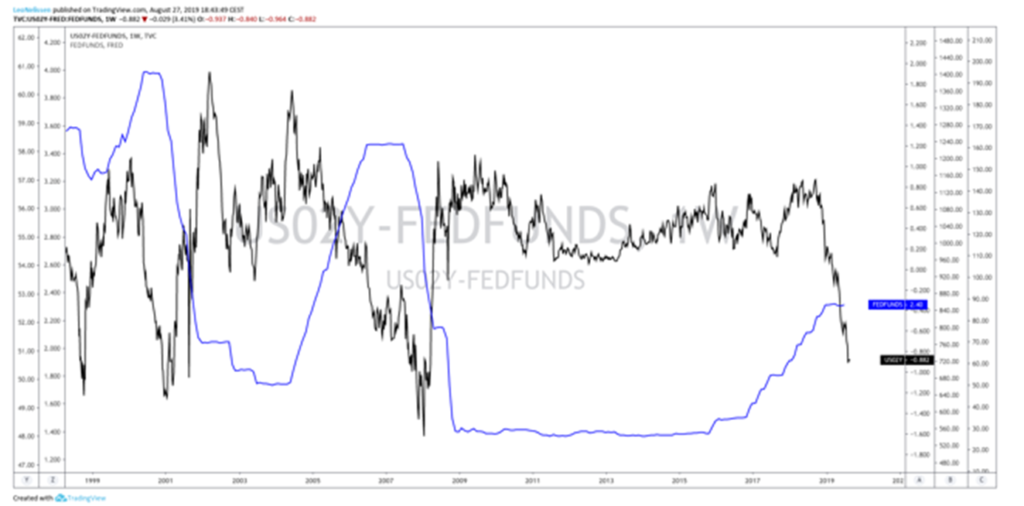
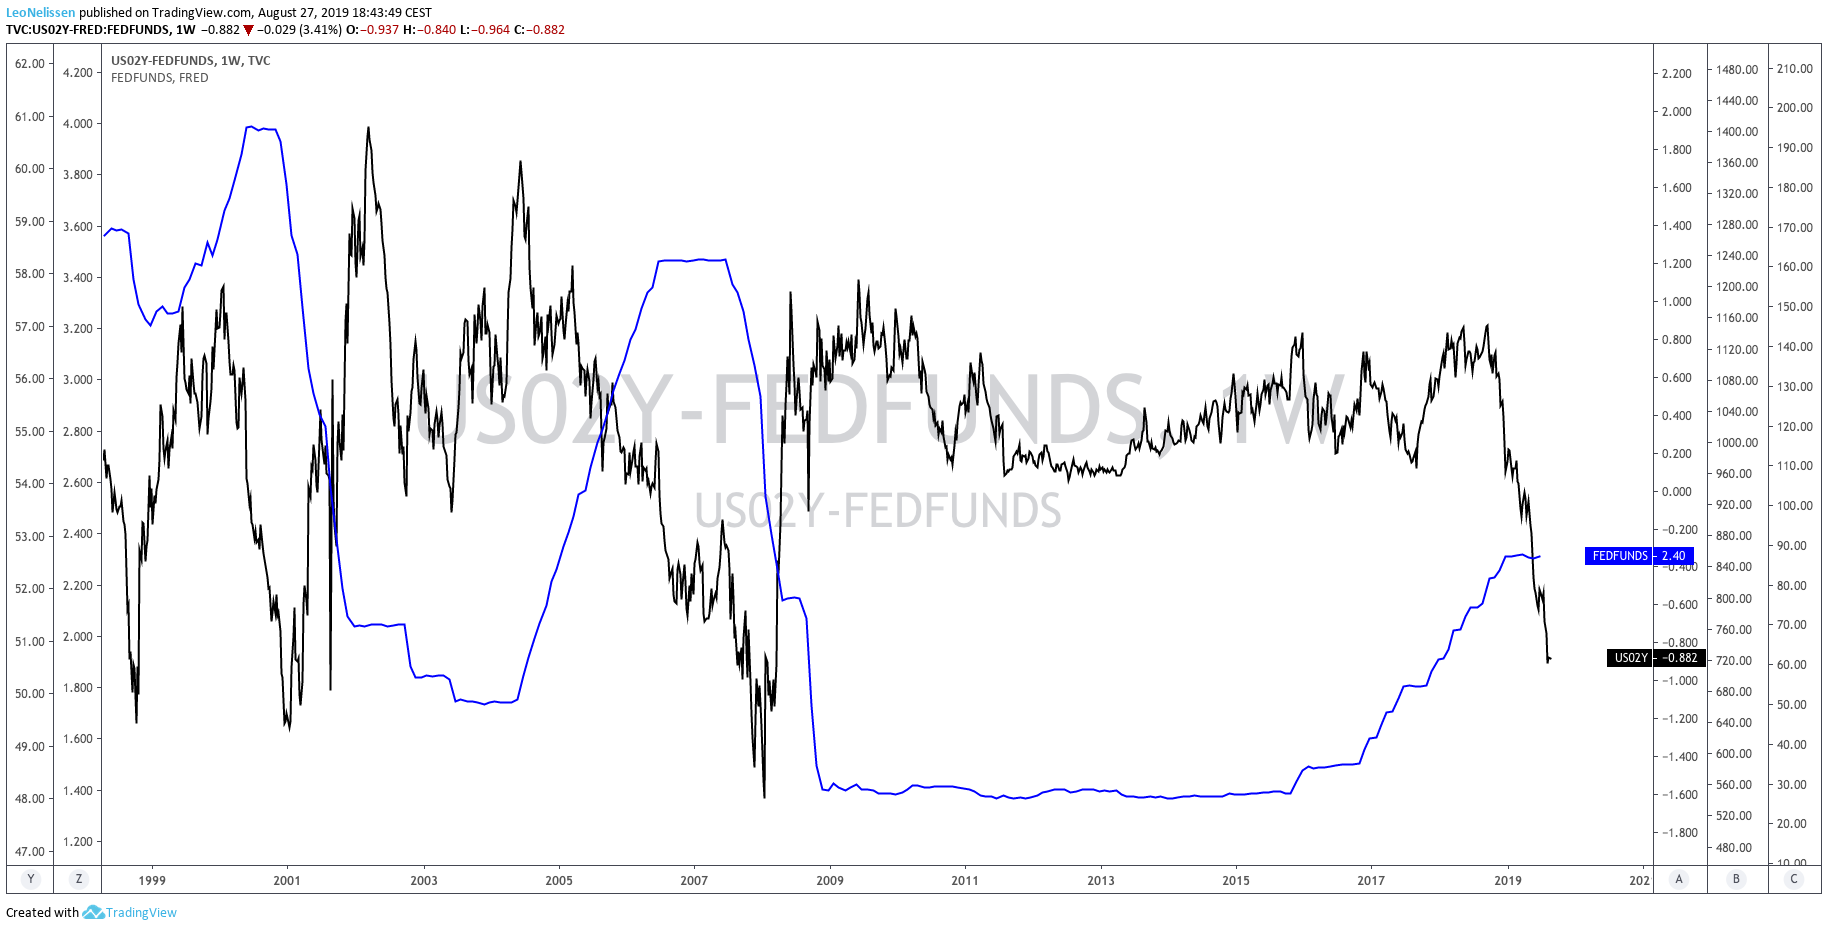
Moving over to the US 2-year bond yield, one could make the case that traders are now fully expecting a Fed easing cycle. The graph below shows two lines. The black line displays the difference between the US 2-year bond yield and the Federal funds rate. A value below 0 indicates that the Fed rate is too high. A value above 0 does the exact opposite.
Source: TradingView
Values close to zero without a trend are useless. It gets interesting once we are seeing a clear trend like we did in 2017 before the Fed fund rate started to peak. At this point, the difference between the 2-year yield and Fed fund rate is at 0.88 according to the graph above. Note that the graph does not yet display the most recent rate cut to 2.00-2.25%. In other words, the difference is close to 75 basis points. This indicates that the market is expecting 3 more rate cuts on the mid-term. There are a lot of different expectations ‘out there’ but I only care about this one. No indicator has better predicted hiking/easing cycles and it erases a lot of noise.
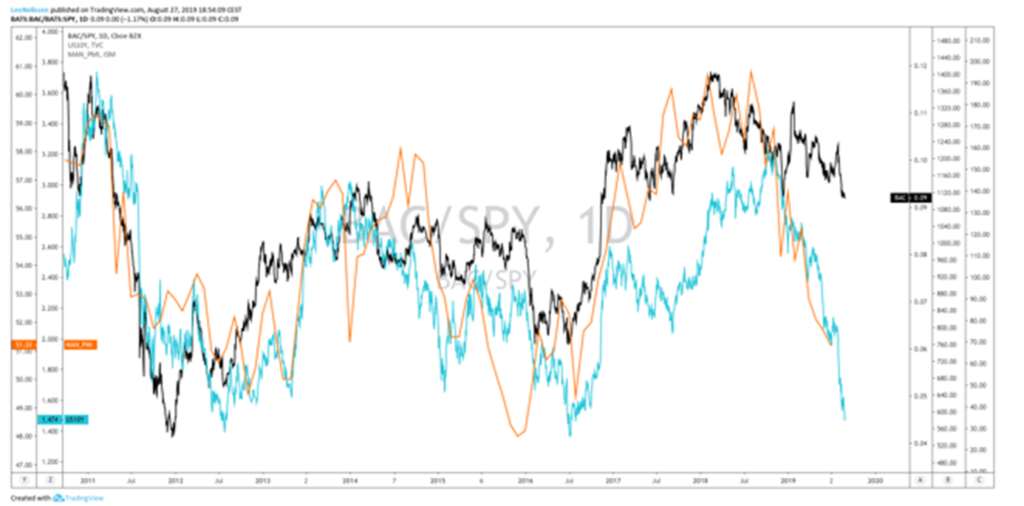
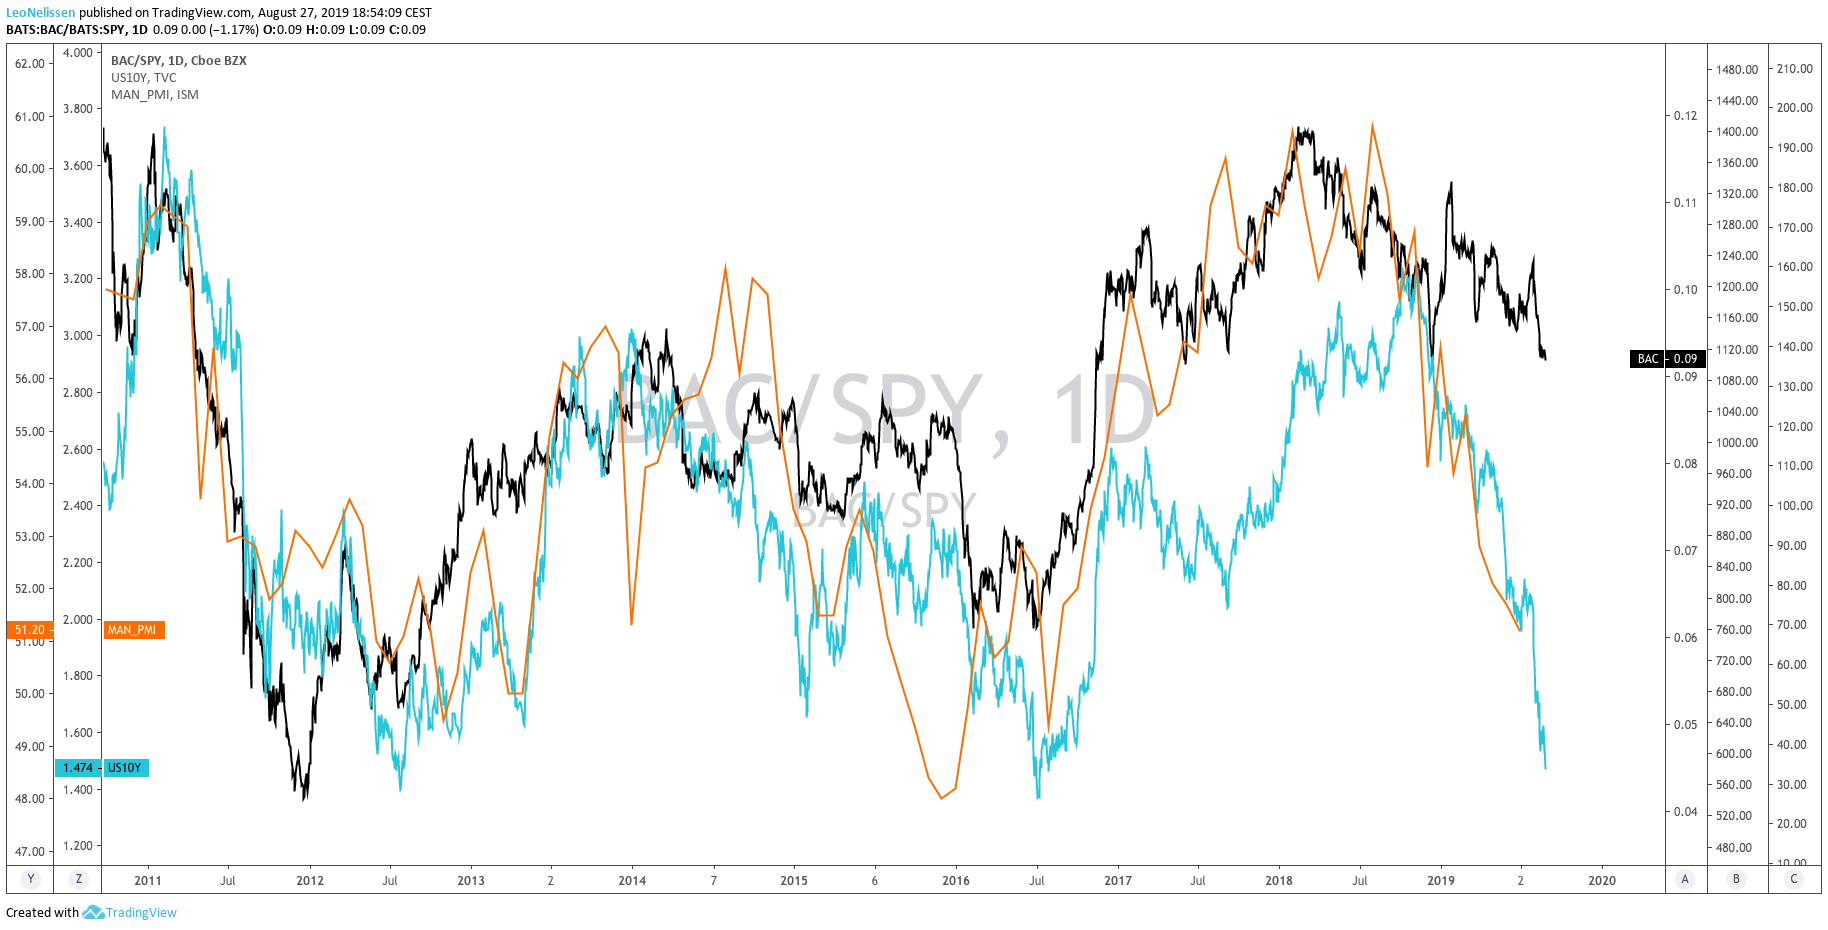
So, does it mean that Bank of America is useless until the Fed starts to hike again? The answer is clearly NO. The graph below shows why. The orange line once again displays the ISM index. The blue line represents the US 10-year bond yield while the black line is not the Bank of America stock price but the ratio between Bank of America and the S&P 500.
Source: TradingView
I used all three graphs to display the most recent business cycles. Bank of America is a steady outperformer as you can see. The stock has been through a few tough cycles but always manages to come back stronger than before. In other words, if the yellow line starts to bottom, you can start buying Bank of America with both hands.
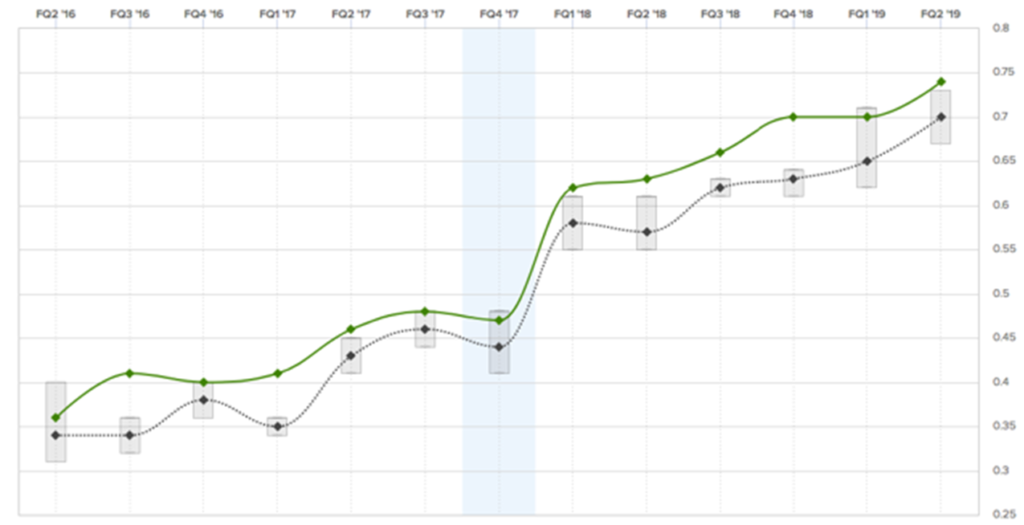
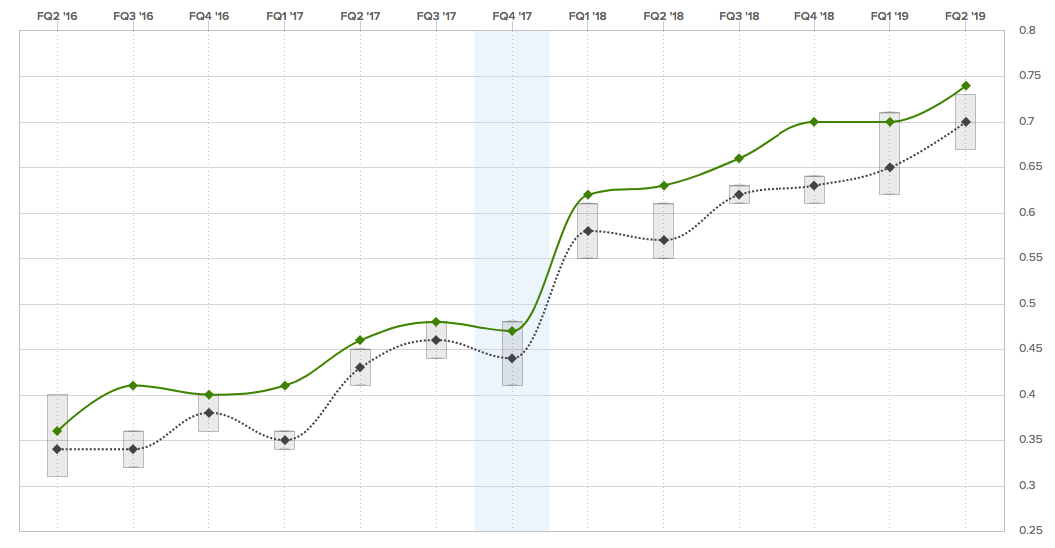
And when I say the stock comes back stronger than before, I think we get proof from the most recent EPS results. Adjusted EPS has not only continued its uptrend but has beaten expectations every single time during the most recent quarter. The most recent second quarter pushed EPS $0.04 above expectations and 17% higher compared to the prior-year quarter.
Source: Estimize
It’s truly stunning to see this kind of earnings power even when one considers that the global economy peaked 4 quarters ago!
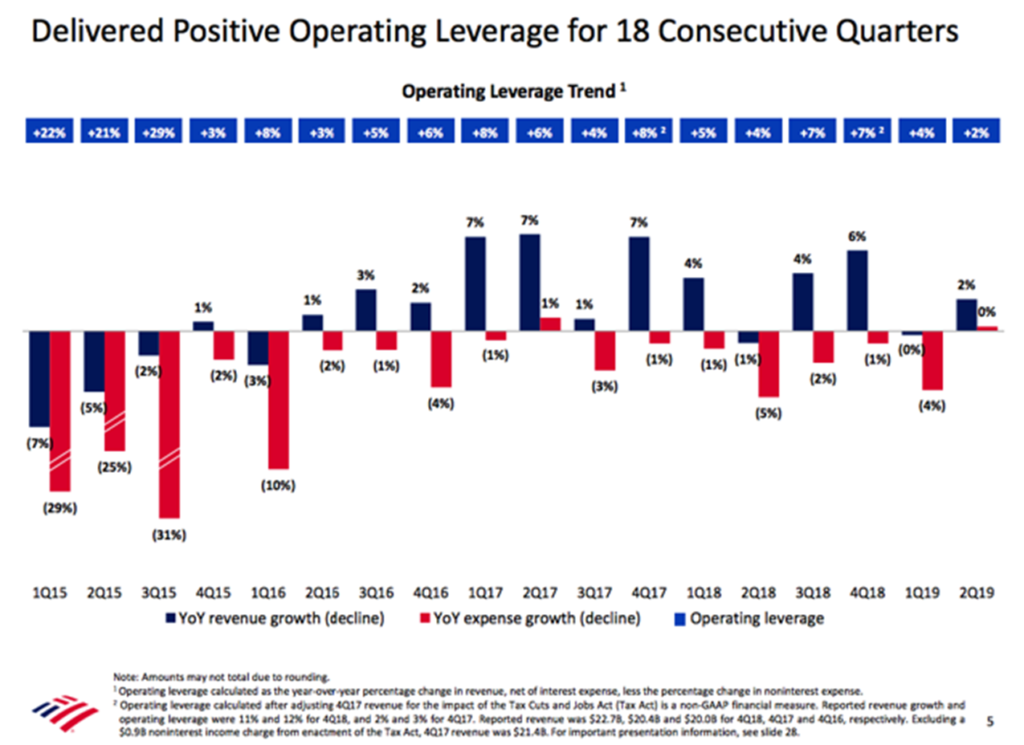
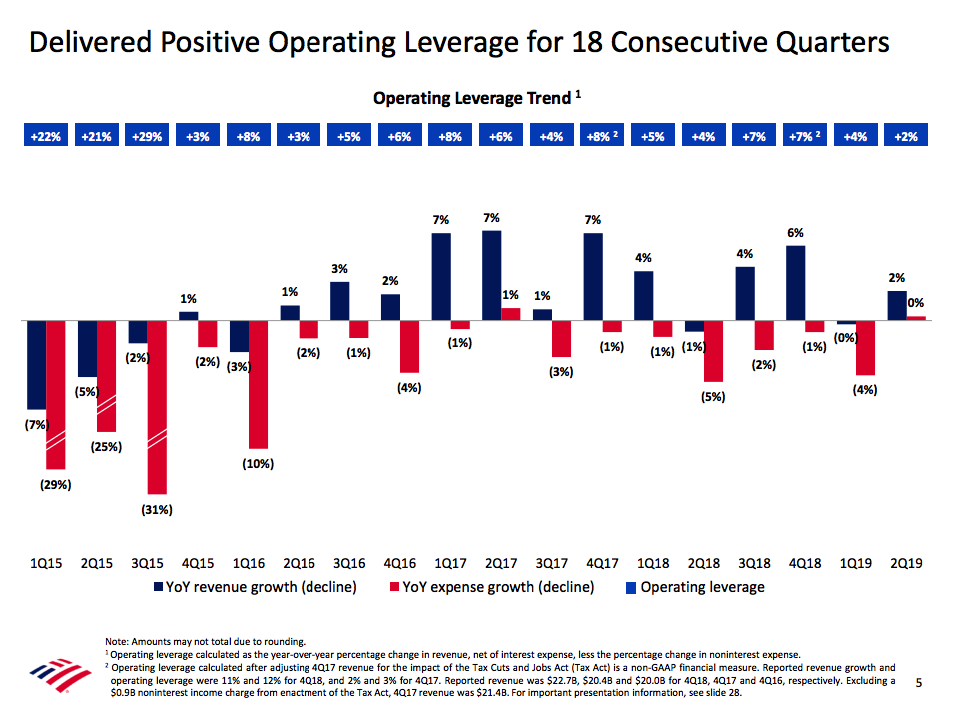
And even when times are tough, the bank manages to grow its operating result by outperforming cost declines.
Source: Bank of America Q2/2019 Earnings Presentation
Also note that the reported net interest yield of 2.44% is less than 10 basis points below Q2/2018 cycle-peak levels of 2.52%. The efficiency ratio remained unchanged at 57% compared to the prior quarter.
So, why is the stock down more than 13% over the past 12 months? The simple reason as I explained earlier is that traders started to price in headwinds from the global economy. Regardless of the company’s ongoing and past successes.
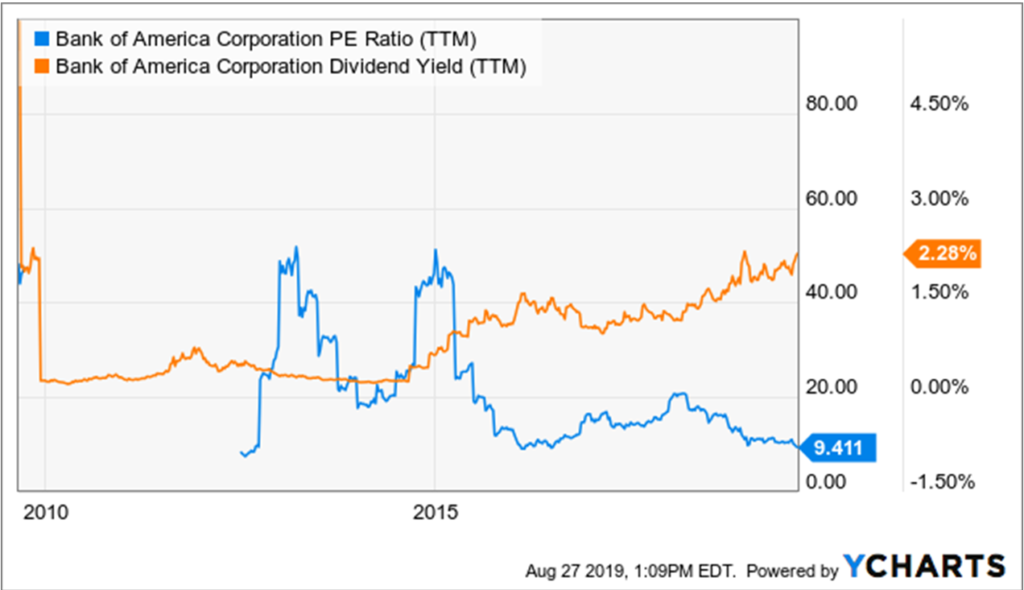
As a result, the company’s valuation is currently at a multi-year low while the dividend yield is about to hit a new multi-year high as well.
Data by YCharts
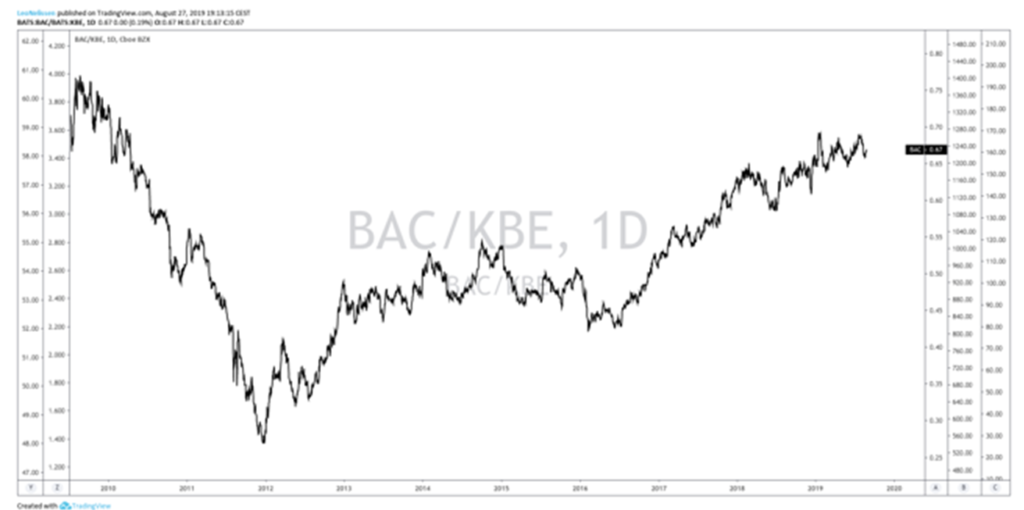
On a side note, before I end this article, let me show you a graph that perfectly confirms everything said so far. The line below shows the ratio between Bank of America and the banking ETF (KBE).
Regardless of macro headwinds, Bank of America is still one of the best banking stocks as the ratio could hit a new high on the short-term. Also note the uptrend after 2016 when Bank of America crushed its competition.

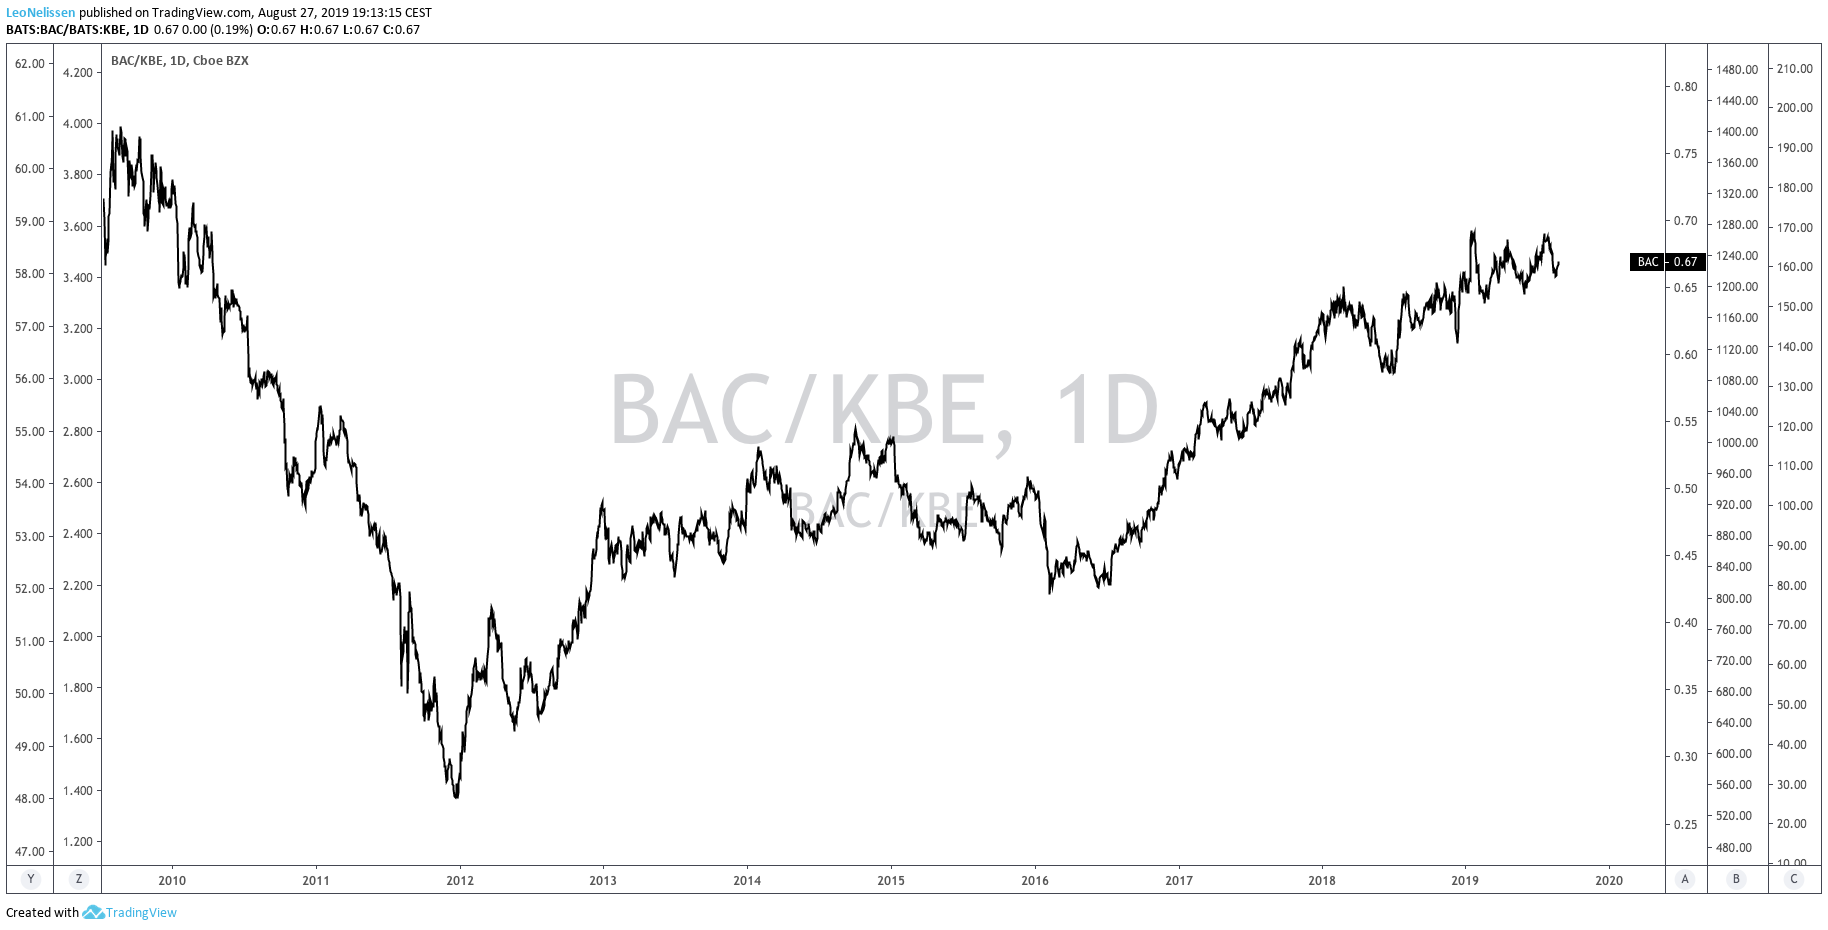
Source: TradingView
Bottom Line
Bank of America is in an interesting spot. The stock price looks terrible and could break down any moment. Moreover, the stock is down double-digits over the past 12 months and has significantly outperformed the S&P 500.
Nonetheless, I am not complaining as I am looking to buy this stock as soon as there are signs of a bottoming economy. For now, it is very likely that the Fed will continue to cut rates even after the economy has bottomed. However, that won’t keep Bank of America from outperforming as soon as traders/investors see hope on the horizon. At that point, it gets incredibly interesting to buy this stock with a multi-year high dividends yield and a ‘cheap’ valuation.
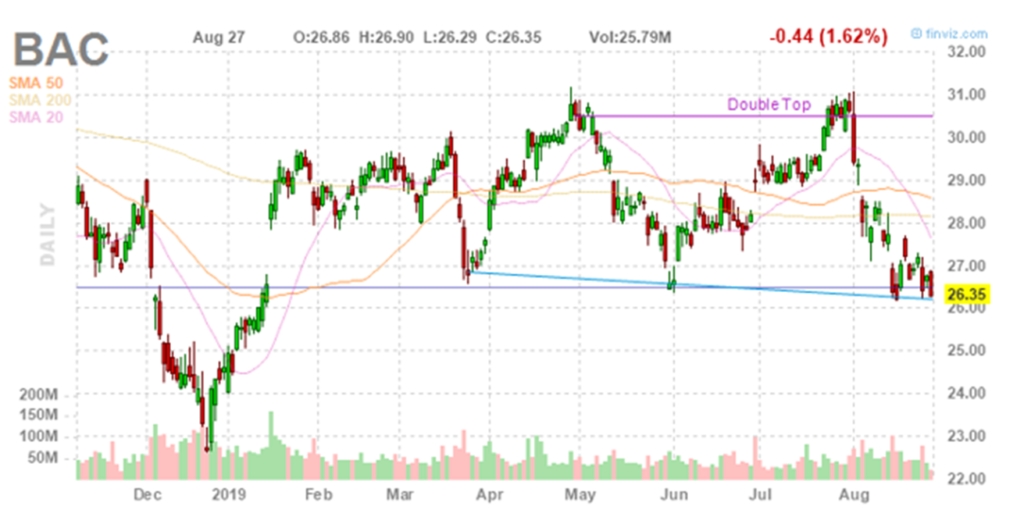
Source: FINVIZ
Unfortunately for now, and regardless of the good financial results, the company remains a hold for long-term investors and a case of ‘stay on the sidelines’ for traders. Don’t worry though, this company will become a tremendous buy maybe even sooner than later.
Stay tuned!
Thank you very much for reading my article. Feel free to click on the “Like” button and don’t forget to share your opinion in the comment section down below!
Disclosure: I/we have no positions in any stocks mentioned, and no plans to initiate any positions within the next 72 hours. I wrote this article myself, and it expresses my own opinions. I am not receiving compensation for it (other than from Seeking Alpha). I have no business relationship with any company whose stock is mentioned in this article.
Additional disclosure: This article serves the sole purpose of adding value to the research process. Always take care of your own risk management and asset allocation.
to turn $100 into $1 million, according to 9 self-made millionaires
Published Fri, Aug 30 2019 10:44 AM EDTUpdated Fri, Aug 30 2019 10:49 AM EDT
The Oracles, Contributor@THEORACLES
Most of us can find ways to save $100. But how do we use that money to boost our finances?
We asked nine successful investors, self-made millionairesand advisors at The Oracles to share their ideas on how to turn $100 into $1 million.
1. ‘Invest in something you love.’
“It’s difficult to acquire wealth. You either have to save diligently, make a lot of money on a business deal or invest. Creating real security requires saving a lot more than you think. It’s also expensive to continue growing a business after it’s successful.
That’s why I’d invest. Find a solid group of people you trust and combine your $100 with theirs to make an educated and solid, yet aggressive, investment. Invest in what you know — and have a vision for it.
You can even invest emotionally. With real estate, for example, I always pick somewhere I would live if everything went bad. Whatever approach you choose, pick something you love. I believe that if you love something, you’ll be good at it. ”
—Bethenny Frankel, founder of Skinnygirl, cast member of“The Real Housewives of New York City,” New York Times best-selling author and guest judge on “Shark Tank.” Follow Bethenny on Instagram.
2. ‘Buy and sell items from garage sales.’
“Go to garage sales and look for underpriced items like action figures or stuffed animals. Then search eBay’s ‘sold’ listings to see what they’re worth. If there’s a large enough price difference, buy it and sell it on eBay for a profit. Use the rest of your $100 to cover transportation and shipping costs.
(You might be thinking: But Gary, that won’t make $1 million! And you’re probably right. But if you try hard enough, you can make, at the very least, $100,000.)
Then comes the hard part. You have to save what you made. When I was in my 20s, I didn’t go on vacation or buy fancy things. I saved my money instead. And by the time I was in my 30s, I had hundreds of thousands of dollars. Then I invested those hundreds of thousands — and theymade millions. You just have to be patient. ”
—Gary Vaynerchuk, founder and CEO of VaynerX; New York Times best-selling author of “Crushing It!”
3. ‘Improve and invest in yourself.’
“Of course, there are people who have invested in an opportunity at the right time and made a fortune. Had you invested $100 in Bitcoin in 2010, you would’ve done well. But to me, that’s like playing the lottery.
A more reliable way to get rich with just $100 is to invest it in a course, book, audio program or event that will help you improve yourself. Spend it on developing new skills, gaining knowledge and making powerful connections. When you invest in yourself, you can’t lose. ”
—Grant Cardone, sales expert who built a $750 million real estate empire and New York Times best-selling author. Follow Grant on Facebook, Instagram and YouTube.
4. ‘Learn a high-income skill.’
“If you don’t have money to start a business, then don’t start a business. Instead, spend your $100 on books and training to learn a skill that will make you $10,000 per month or more.
Choose a high-income skill that helps organizations bring in revenue, such as copywriting, marketing or sales. You can learn them relatively quickly and they’re transferable across many industries.
Once you make enough money, you can turn your side hustle into a full-time job. Then, scale and invest your profits. That’s how you build real wealth. If you’re persistent and good at what you do, you’ll get there. But it won’t happen overnight, so take baby steps. ”
—Dan Lok, global educator, best-selling author of “Unlock It!” and founder of Closers.com. Follow Dan on YouTube, Facebook and Instagram.
5. ‘Write an e-book.’
“Six years ago, I hired someone for $100 to design my first e-book, ‘Crush The CPA Exam Study Guide.’ It only took about a week to create — and all I had to do was write the copy. It’s been selling on autopilot ever since, and I’ve made at least $100,000 as a result. It was shockingly easy.
Use your knowledge and resources to write a book. Then, pay a designer from a global freelancing platform (e.g., Upwork) $100 to make it look nice and incentive people to sell it for you through an affiliate marketing program. Simply contact the websites that show up in Google when you search for your e-book topic (e.g., type in ‘best CPA study guides’).
Offer to pay them a commission for any sales they send to you. When you leverage their traffic and the trust they have built with their audience, you don’t even have to build a website. ”
—Bryce Welker, CEO of online education company Crush Empire and founder of Crush The CPA Exam. Follow Bryce on LinkedIn.
6. ‘Buy a multimillion-dollar business with other peoples’ money.′
“You don’t even need $100 if you’re willing to buy an established business. Many baby boomers are looking for someone trustworthy to take over their multimillion-dollar businesses so that they can retire. It’s common to negotiate a deal where you pay just 30% of the purchase price at closing.
Financial institutions that specialize in acquisitions will lend you the down payment regardless of your credit because they can use the business assets as collateral. You get the business with no money down and pay the remaining 70% over time using earnings from the business.
You don’t even need relevant experience — you just need to find a business that has been around for five or 10 years. The owner will mentor you through the transition, and you can give an expert equity to manage the business for you.
Why doesn’t everyone do this? Because starting the next Uber or Facebook seems sexier than buying professional services or businesses (e.g., in construction or plumbing). But with this approach, you get to skip the struggles that cause 90% of startups to fail. ”
—Moran Pober, founder and CEO of Acquisitions.com and former partner at Wekix.com and ABD Assets. Follow Moran on LinkedIn, Facebook and Instagram.
7. ‘Build a personal brand.’
“Entrepreneurship is the sexy thing that everyone wants to be involved in today. You can make millions by building your own brand as an influencer or business. But anyone can have a voice, thanks to social media, so it’s not easy to get heard above the noise.
With so many brands pushing online offers, building a trustworthy one is the secret to success. To do that, you need a clear statement that defines your mission and how it helps others. This message should be based on how you solved your own problems.
People will only follow you if they understand why you do what you do and if they identify with your mission. Film a video explaining your story, then invest $100 in Facebook ads to get it in front of people who are like you and may be in your situation. ”
—Torben Platzer, founder and CEO of personal branding agency TPA Media GmbH, founder of business education program SELFMADE and host of the German podcast“SELFMADE.” Follow Torben on Facebook, Instagram and YouTube.
8. ‘Start a business on Amazon.’
“I would invest $100 in business education. Start with free online content from proven business leaders, then read every book you can get from the ones that resonate with you.
Next, find a product that you can buy on Alibaba.com for 10% to 30% of what you can sell it for on Amazon. To find products that sell well, look for those with a ‘Best Sellers Rank’ between one and 5,000 in the high-level categories.
Save, hustle or borrow to get another $500 to buy your inventory. Try different marketing strategies to sell the product — starting with social media, online advertising and content marketing. Then stop doing what isn’t working and start doing what is working.
To grow your business, focus on increasing the profit margin and the quantity you sell. Eventually, you want to own the brand so you have a valuable asset that produces wealth. ”
—Matt Clark, co-founder and chairman of Amazing.comand co-creator of Amazing Selling Machine. Follow Matt on Instagram.
9. ‘Launch a coaching business.’
“I’ve built two seven-figure businesses from nothing and helped others reach similar success. While I had more than $100 to start, it wasn’t much more.
Once you’ve invested your $100 in developing skills that make you an expert, you can build a coaching, consulting or mentoring business in your area of expertise.
This model is popular for many reasons: It’s fast, effective and requires minimal investment because the only cost is your time. When you’ve made some money from your business, invest the profits in Facebook ads to get more clients.
If you’re good at what you do, you can grow that investment into tens of thousands of dollars. To exceed the million-dollar mark, automate some of the coaching and hire other coaches to work for you. ”
—Rudy Mawer, founder and CEO of ROI Machines and RudyMawer.com, Facebook marketing and ad expert, who built a multimillion-dollar business by age 26. Follow Rudy on Instagram.
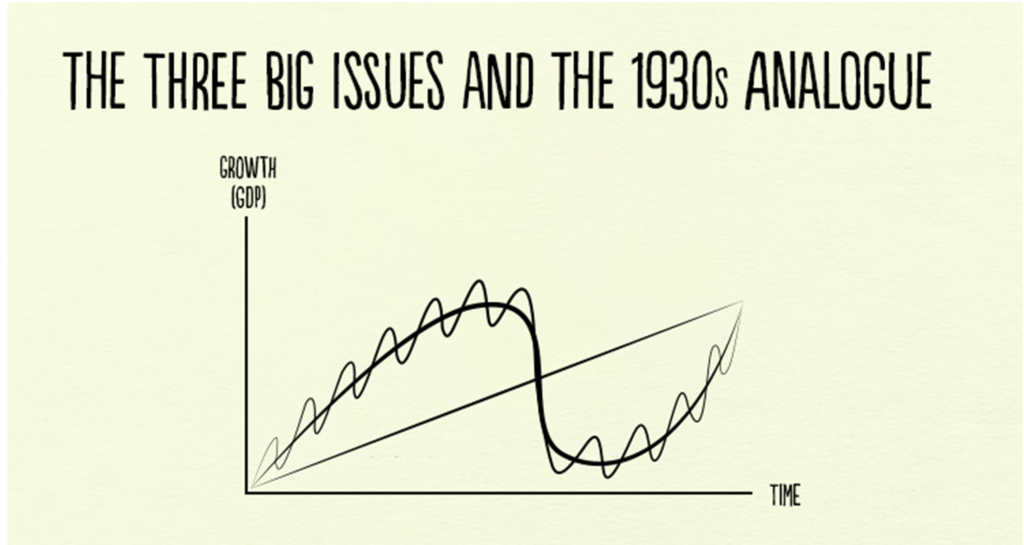
The Three Big Issues and the 1930s Analogue
- Published on August 28, 2019
Ray Dalio
Co-Chief Investment Officer & Co-Chairman of Bridgewater Associates, L.P.
The most important forces that now exist are:
1) The End of the Long-Term Debt Cycle (When Central Banks Are No Longer Effective)
+
2) The Large Wealth Gap and Political Polarity
+
3) A Rising Work Power Challenging an Existing World Power
=
The Bond Blow-Off, Rising Gold Prices, and the Late 1930s Analogue
In other words now 1) central banks have limited ability to stimulate, 2) there is large wealth and political polarity and 3) there is a conflict between China as a rising power and the U.S. as an existing world power. If/when there is an economic downturn, that will produce serious problems in ways that are analogous to the ways that the confluence of those three influences produced serious problems in the late 1930s.
Before I get into the meat of what I hope to convey, I will repeat my simple timeless and universal template for understanding and anticipating what is happening in the economy and markets.
My Template
There are four important influences that drive economies and markets:
- Productivity
- The short-term debt/business cycle
- The long-term debt cycle
- Politics (within countries and between countries).
There are three equilibriums:
- Debt growth is in line with the income growth required to service the debt,
- The economy’s operating rate is neither too high (because that will produce unacceptable inflation and inefficiencies) nor too low (because economically depressed levels of activity will produce unacceptable pain and political changes), and
- The projected returns of cash are below the projected returns of bonds, which are below the projected returns of equities and the projected returns of other “risky assets.”
And there are two levers that the government has to try to bring things into equilibrium:
- Monetary policy
- Fiscal policy
The equilibriums move around in relation to each other to produce changes in each like a perpetual motion machine, simultaneously trying to find their equilibrium level. When there are big deviations from one or more of the equilibriums, the forces and policy levers react in ways that one can pretty much expect in order to move them toward their equilibriums. For example, when growth and inflation fall to lower than the desired equilibrium levels, central banks will ease monetary policies which lowers the short term interest rate relative to expected bond returns, expected returns on equities, and expected inflation. Expected bond returns, equity returns, and inflation themselves change in response to changes in expected conditions (e.g. if expected growth is falling, bond yields will fall and stock prices will fall). These price changes happen until debt and spending growth pick up to shift growth and inflation back toward inflation. And of course all this affects politics (because political changes will happen if the equilibriums get too far out of line), which affects fiscal and monetary policy. More simply and most importantly said, the central bank has the stimulant which can be injected or withdrawn and cause these things to change most quickly. Fiscal policy, which changes taxes and spending in politically motivated ways, can also be changed to be more stimulative or less stimulative in response to what is needed but that happens in lagging and highly inefficient ways.
For a simpler explanation of this template see my 30-minute animated video “How the Economic Machine Works” and for a more comprehensive explanation see my book Understanding the Principles of Big Debt Crises, which is available free as a PDF here or in print on Amazon. Also, to learn more about our extensive debt cycle research, please visit our debt crises research library on Bridgewater.com.
Looking at What is Happening Now in the Context of That Template
Regarding the above template and where we are now, in my opinion, the most important things that are happening (which last happened in the late 1930s) are a) we are approaching the ends of both the short-term and long-term debt cycles in the world’s three major reserve currencies, while b) the debt and non-debt obligations (e.g., healthcare and pensions) that are coming at us are larger than the incomes that are required to fund them, c) large wealth and political gaps are producing political conflicts within countries that are characterized by larger and more extreme levels of internal conflicts between the rich and the poor and between capitalists and socialists, d) external politics is driven by the rising of an emerging power (China) to challenge the existing world power (the U.S.), which is leading to a more extreme external conflict and will eventually lead to a change in the world order, and e) the excess expected returns of bonds is compressing relative to the returns on the cash rates central banks are providing.
As for monetary policy and fiscal policy responses, it seems to me that we are classically in the late stages of the long term debt cycle when central banks’ power to ease in order to reverse an economic downturn is coming to an end because:
- Monetary Policy 1 (i.e., the ability to lower interest rates) doesn’t work effectively because interest rates get so low that lowering them enough to stimulate growth doesn’t work well,
- Monetary Policy 2 (i.e., printing money and buying financial assets) doesn’t work well because that doesn’t produce adequate credit in the real economy (as distinct from credit growth to leverage up investment assets), so there is “pushing on a string.” That creates the need for…
- Monetary Policy 3 (large budget deficits and monetizing of them) which is problematic especially in this highly politicized and undisciplined environment.
More specifically, central bank policies will push short-term and long-term real and nominal interest rates very low and print money to buy financial assets because they will need to set short-term interest rates as low as possible due to the large debt and other obligations (e.g. pensions and healthcare obligation) that are coming due and because of weakness in the economy and low inflation. Their hope will be that doing so will drive the expected returns of cash below the expected returns of bonds, but that won’t work well because a) these rates are too close to their floors, b) there is a weakening in growth and inflation expectations which is also lowering the expected returns of equities, c) real rates need to go very low because of the large debt and other obligations coming due, and d) the purchases of financial assets by central banks stays in the hands of investors rather than trickles down to most of the economy (which worsens the wealth gap and the populist political responses). This has happened at a time when investors have become increasingly leveraged long due to the low interest rates and their increased liquidity. As a result we see the market driving down short term rates while central banks are also turning more toward long-term interest rate and yield curve controls, just as they did from the late 1930s through most of the 1940s.
To put this interest rate situation in perspective, see the long-term debt/interest rate wave in the following chart. As shown below, there was a big inflationary blow-off that drove interest rates into a blow-off in 1980-82. During that period, Paul Volcker raised real and nominal interest rates to what were called the highest levels “since the birth of Jesus Christ,” which caused the reversal.
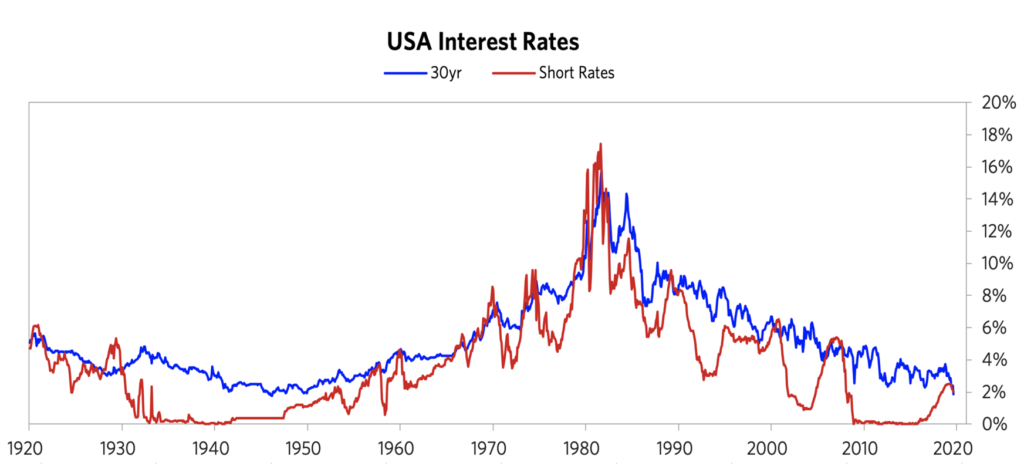
During the period leading into the 1980-82 peak, we saw the blow-off in gold. The below chart shows the gold price from 1944 (near the end of the war and the beginning of the Bretton Woods monetary system) into the 1980-82 period (the end of the inflationary blow-off). Note that the bull move in gold began in 1971, when the Bretton Woods monetary system that linked the dollar to gold broke down and was replaced by the current fiat monetary system. The de-linking of the dollar from gold set off that big move. During the resulting inflationary/gold blow-off, there was the big bear move in bonds that reversed with the extremely tight monetary policies of 1979-82.
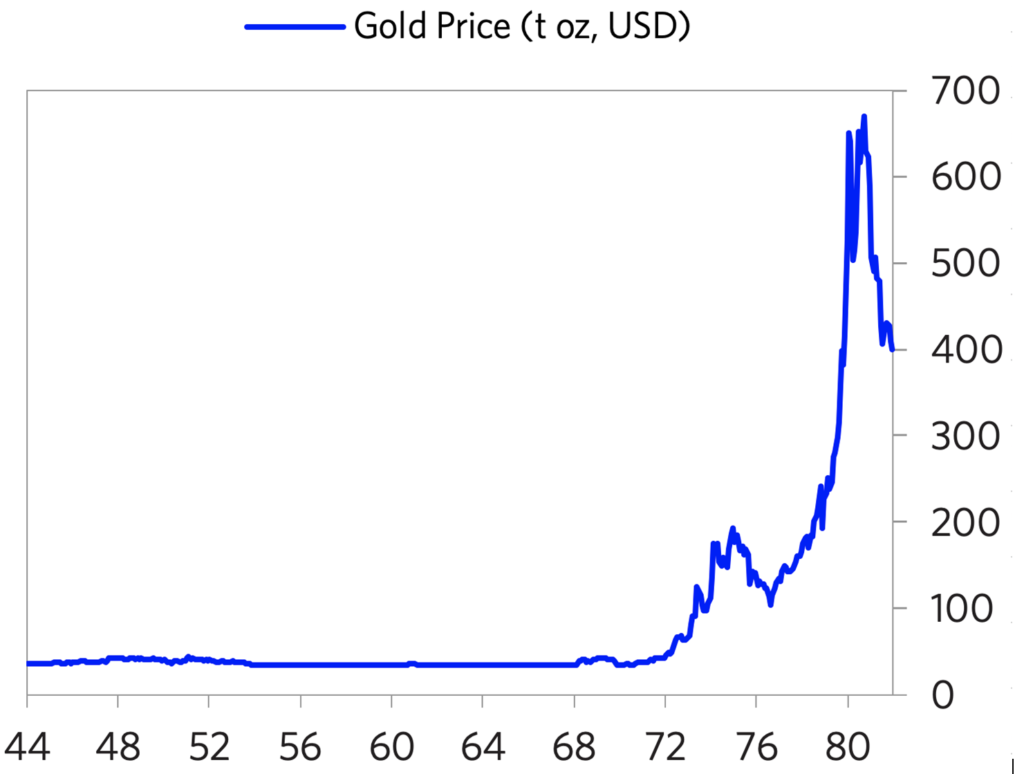
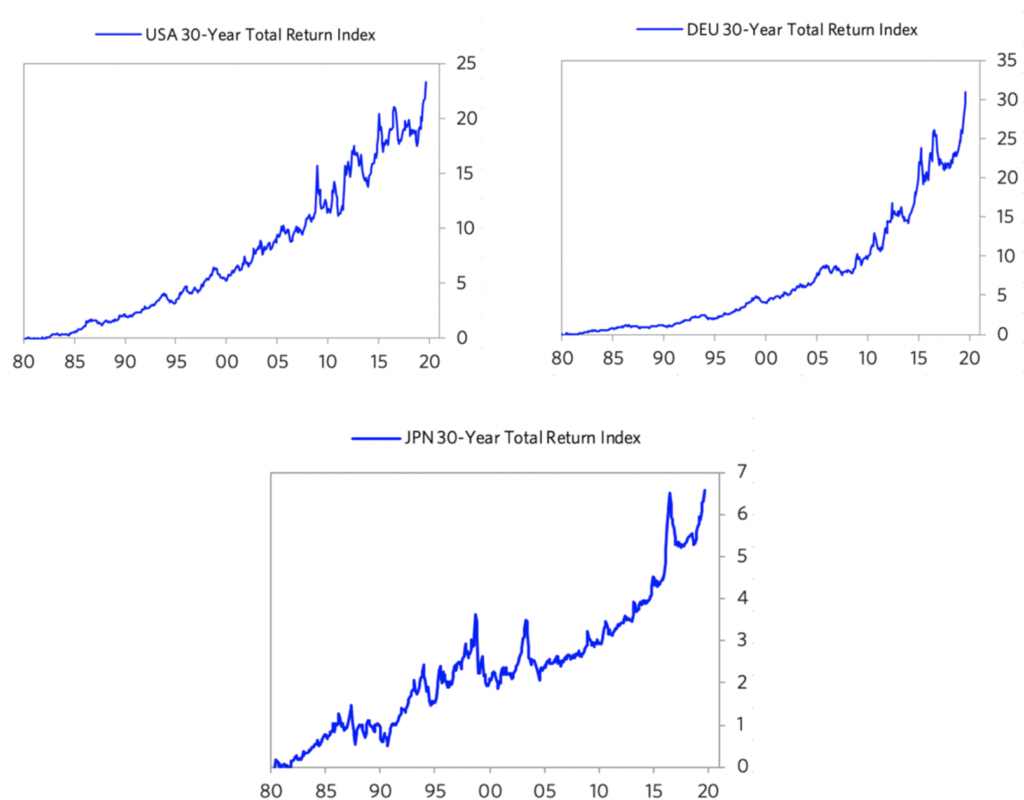
Since then, we have had a mirror-like symmetrical reversal (a dis/deflationary blow-off). Look at the current inflation rates at the current cyclical peaks (i.e. not much inflation despite the world economy and financial markets being near a peak and despite all the central banks’ money printing) and imagine what they will be at the next cyclical lows. That is because there are strong deflationary forces at work as productive capacity has increased greatly. These forces are creating the need for extremely loose monetary policies that are forcing central banks to drive interest rates to such low levels and will lead to enormous deficits that are monetized, which is creating the blow-off in bonds that is the reciprocal of the 1980-82 blow-off in gold. The charts below show the 30-year T-bond returns from that 1980-82 period until now, which highlight the blow-off in bonds.
To understand the current period, I recommend that you understand the workings of the 1935-45 period closely, which is the last time similar forces were at work to produce a similar dynamic.
Please understand that I’m not saying that the past is prologue in an identical way. What I am saying that the basic cause/effect relationships are analogous: a) approaching the ends of the short-term and long-term debt cycles, while b) the internal politics is driven by large wealth and political gaps, which are producing large internal conflicts between the rich and the poor and between capitalists and socialists, and c) the external political conflict that is driven by the rising of an emerging power to challenge the existing world power, leading to significant external conflict that eventually leads to a change in the world order. As a result, there is a lot to be learned by understanding the mechanics of what happened then (and in other analogous times before then) in order to understand the mechanics of what is happening now. It is also worth understanding how paradigm shifts work and how to diversify well to protect oneself against them.
—————————————————————————————————————
Bridgewater Daily Observations is prepared by and is the property of Bridgewater Associates, LP and is circulated for informational and educational purposes only. There is no consideration given to the specific investment needs, objectives or tolerances of any of the recipients. Additionally, Bridgewater’s actual investment positions may, and often will, vary from its conclusions discussed herein based on any number of factors, such as client investment restrictions, portfolio rebalancing and transactions costs, among others. Recipients should consult their own advisors, including tax advisors, before making any investment decision. This report is not an offer to sell or the solicitation of an offer to buy the securities or other instruments mentioned.
Bridgewater research utilizes data and information from public, private and internal sources, including data from actual Bridgewater trades. Sources include the Australian Bureau of Statistics, Barclays Capital Inc., Bloomberg Finance L.P., CBRE, Inc., CEIC Data Company Ltd., Consensus Economics Inc., Corelogic, Inc., CoStar Realty Information, Inc., CreditSights, Inc., Credit Market Analysis Ltd., Dealogic LLC, DTCC Data Repository (U.S.), LLC, Ecoanalitica, EPFR Global, Eurasia Group Ltd., European Money Markets Institute – EMMI, Factset Research Systems, Inc., The Financial Times Limited, GaveKal Research Ltd., Global Financial Data, Inc., Haver Analytics, Inc., The Investment Funds Institute of Canada, Intercontinental Exchange (ICE), International Energy Agency, Lombard Street Research, Markit Economics Limited, Mergent, Inc., Metals Focus Ltd, Moody’s Analytics, Inc., MSCI, Inc., National Bureau of Economic Research, Organisation for Economic Cooperation and Development, Pensions & Investments Research Center, Renwood Realtytrac, LLC RP Data Ltd, Rystad Energy, Inc., S&P Global Market Intelligence Inc., Sentix Gmbh, Spears & Associates, Inc., State Street Bank and Trust Company, Sun Hung Kai Financial (UK), Refinitiv, Tokyo Stock Exchange, United Nations, US Department of Commerce, Wind Information (Shanghai) Co Ltd, Wood Mackenzie Limited, World Bureau of Metal Statistics, and World Economic Forum. While we consider information from external sources to be reliable, we do not assume responsibility for its accuracy.
The views expressed herein are solely those of Bridgewater as of the date of this report and are subject to change without notice. Bridgewater may have a significant financial interest in one or more of the positions and/or securities or derivatives discussed. Those responsible for preparing this report receive compensation based upon various factors, including, among other things, the quality of their work and firm revenues.
https://www.marketwatch.com/story/the-media-is-lying-to-you-about-trumps-china-tariffs-2019-05-14
Opinion: The media is lying to you about Trump’s China tariffs
By Brett Arends
Published: May 15, 2019 10:04 a.m. ET
The hysteria must have a political agenda because the amount that’s being charged is peanuts
A sell-off worse than December can arrive in a week, says analyst who is predicting ‘Lehman-like’ drop
PUBLISHED MON, AUG 26 2019 2:00 PM EDTUPDATED MON, AUG 26 2019 4:27 PM EDT
KEY POINTS
- “The U.S. stock market especially is facing its greatest test of the year thus far,” says Takada.
- The strategist pointed out market movements over the past two weeks showed an “uncanny resemblance” between now and 2008.
- Takada’s view, the most pessimistic on Wall Street, is based on macro and quantitative data including flows from hedge funds and other players.
Remember the brutal sell-off last year when stocks suffered their worst December since the Great Depression? Something worse than that could happen in days, a Nomura analyst said.
Macro and quant strategist Masanari Takada turned heads earlier this month with his bold call for a “Lehman-like” plunge. He’s sticking with this prediction as market sentiment shows no signs of improving, leading him to believe a monster sell-off could arrive this week.
“The U.S. stock market especially is facing its greatest test of the year thus far,” Takada said in a note to clients on Monday. Low sentiment is poised to prompt “panic-selling by fundamentals-oriented investors and systematic selling by trend-following technical investors along the way,” he said.
Takada’s view, the most pessimistic on Wall Street, is based on macro and quantitative data including flows from hedge funds and other players, which showed sentiment is approaching the lowest level of the current cycle. He had predicted the first explosion in the Cboe Volatility Index, aka Wall Street’s “fear gauge,” which swung to the highest in 2019 on Aug. 5 when China allowed its currency to drop to a level unseen since the financial crisis amid the trade war.
This week is also the last week before the Labor Day weekend. Volumes are typically low at the end of August, which could exaggerate market moves.
The Dow tanked more than 33% in 2008, the year in which Lehman Brothers went bust. The collapse helped catalyze the financial crisis and bring on the Great Recession. By March 2009, the benchmark hit its lowest level of 6,443.27, a peak-to-trough decline of about 55%.
‘Uncanny resemblance’
Takada pointed out market performance over the past two weeks showed an “uncanny resemblance” between now and 2008. Technical investors including Commodity Trading Advisors are already trimming their long positions “at an accelerating pace,” which could exacerbate selling going forward, Takada said. CTAs are trend-following quants that trade futures contracts and commodity options.
“The correlation between sentiment then and now remains quite high,” Takata said. “Even the passing risk-on phase after the initial shock of the yield curve inversion … and the risk-off mood that struck on 23 August neatly track the pattern recorded in 2008.”
“If this uncanny resemblance between the two patterns continues to hold, sentiment could soon fall to a level not seen since December 2018,” he added.
The Dow Jones Industrial Average suffered its worst day of the year Aug. 14 when the yield on the benchmark 10-year Treasury note broke below the 2-year rate, an odd bond market phenomenon that historically has preceded recessions. The curve has since repeatedly inverted as the longer-term yields continued to fall on trade war fears.
Stocks also took a big hit on Friday after China struck back by slapping retaliatory tariffs on U.S. goods. August has been a volatile month for stocks with the S&P 500 losing 3.5% so far.
Disney+ is cheap, chock-full of content and poised for a massive November launch
PUBLISHED MON, AUG 26 2019 3:56 PM EDTUPDATED TUE, AUG 27 2019 7:25 AM EDT
KEY POINTS
- Disney+ will debut on November 12 and will cost $6.99 per month.
- Analysts foresee a massive sign-up for the streaming service because of its cheap cost and huge library.
- Early sign-up at kiosks at the D23 Expo were packed throughout the three-day event. There fans could commit to a three-year subscription and save $23 each year.
With a little more than two months before the debut of its streaming service, Disney dazzled its hardcore fans with celebrity guests and teaser trailers over the weekend at its D23 Expo.
The company showcased a number of programs it had previously announced, like “Lady and the Tramp,” “WandaVision” and “The World According to Jeff Goldblum,” as well as a number of shriek-inducing reveals like three more Marvel shows and an Obi-Wan Kenobi show.
“Bob Iger always said that Disney+ is his top priority for 2019,” Peter Csathy, founder and chairman of Creatv Media, said. “He has kicked his entire global multi-tentacled marketing machine into gear to demonstrate just how serious he is. Yet another reason for Netflix shareholders to duck, cover and hold. ”
If the crowd at the Disney+ panel on Friday was any indication of consumer interest, Disney will have no trouble getting people to sign up for its service. The company offered attendees at this year’s D23 a special offer for signing up at the convention — $23 off each year when they signed up for a three-year deal.
It’s unclear how many D23 attendees signed up for the service, but kiosks in the Anaheim Convention Center were packed throughout the three-day event. Disney did not immediately respond to CNBC’s request for comment.
Wedbush’s Michael Pachter noted that there are currently 60 million Netflix subscribers in the U.S. and that around 75% of those users are above median income. For these subscribers, it’s easy to spend the money to add another service to their roster.
Pachter said he expects Disney to add between 10 million and 15 million subscribers to its service each year until they reach around 45 million. Other analysts foresee a faster sign-up rate because of Disney+’s cheap cost.
On its own Disney+ will cost users $6.99 a month, or $69.99 for a full year, but together with ESPN+ and ad-supported Hulu, customers will shell out just $12.99 per month for the bundle.
“It’s their package deal that really has people talking and truly sets them apart from other streaming competition,” Jeff Bock, senior box office analyst at Exhibitor Relations, said. “I mean, that’s a slam dunk, that’s a no-brainer. Just take our collective debit cards and charge them as you see fit. And that price point is perfection.”
Of course, Disney+ isn’t an instant Netflix-killer. Most entertainment junkies will simply add the service to their collection of streaming platforms. It’s possible down the line, however, if prices shift that subscribers may begin to drop services in favor of others.
And it doesn’t hurt that Disney will have new content and old favorites from each of its mega-brands as well as the newly acquired Fox, Paul Dergarabedian, senior media analyst at Comscore said.
“Disney+ is poised for a massive launch in November,” he said. “For any streaming service content is king and a series like ‘The Mandalorian’ is just the type of eye candy to entice the early adopters who were lined up at D23 to purchase the service a full three months before launch.”
HI Financial Services Mid-Week 06-24-2014