HI Market View Commentary 08-22-2022
Why HI? Because we do things different!
We have weekly webinars to find out what we are thinking, what we are doing to portfolio and to ask questions
We add protection = AAPL, BA, F, META, V, UAA, DIS
We didn’t protect banks yet? Fed hikes and interest rate hikes benefit banks
YES we let BIDU run without protection
We run portfolios under the Warren Buffet fundamental analysis but we also protect with long puts
A couple of people have been asking me about Dave Ramnsey, Phil Town = Yes they have basic investing suggestions that everyone should already know, yes they don’t make their money from the stock market and the don’t actively trade, YES they make their money from books and seminars/youtube
Our expectation is to be in full collar trade with the short call to make every penny on the way down.
How long? Most likely into October because the fed is going to do another 50 or 75 basis point rate hike
Pay off your credit cards !!! Reset your mortgage rates!!!!
Today was the worst day in the stock market since June
Yes this is the third and last week of retail sales companies
Earnings dates:
BIDU 8/30 BMO – Pricing power
COST 9/22 AMC – ????
DG 8/25 AMC – NO
MU 9/28 – NO
https://www.briefing.com/the-big-picture
The Big Picture
Last Updated: 19-Aug-22 15:49 ET | Archive
Fundamental support factors still lacking
When publishing updated market views, we sometimes pick up where we left off. That is precisely what we will do today.
Here is the parting thought from the Market View we published on May 20:
Stock prices have come down a lot, which leaves them ripe for a tactical rally effort, yet earnings estimates have not come down at all. They will, which is why today’s discounted P/E multiple can’t be looked at unequivocally as being cheap and why sentiment-driven rallies will eventually hit a wall of fundamental resistance.
Following that post, the S&P 500 declined another 6.8% to its intraday low on June 17, leaving it down 23.7% for the year. In other words, the expected tactical rally effort was deferred, but as everyone knows, it was not denied.
The S&P 500 is now down “just” 11.2% for the year, having rallied off the June 17 low in a fast and furious manner but leaving it on a collision course with a wall of fundamental resistance.
Looking Back at Forward-Thinking Market
Before moving forward with our market view, it is imperative that we look back at why there was such a shift in sentiment.
The succinct answer is that there was a collective acceptance of the idea that the market got too bearish during the selloff in the first half of the year. The acceptance of that view had three, proximate catalysts.
The first was a belief that the Federal Reserve might not have to get as restrictive with monetary policy as had been previously feared. Ironically, that was because the incoming economic data was exposing a clear deterioration in economic activity. GDP was negative in both the first and second quarters.
The second catalyst was a BofA Global Fund Manager Survey that revealed the most underweight position in equities since the Lehman Bros. crisis in 2008 and the highest cash levels since 2001. That was contrarian fuel poured on a rebound fire that was already burning.
The third catalyst was an emerging belief that the Federal Reserve might be able to manage a soft landing for the economy after all. That view was aided by the arrival of better-than-feared earnings results for the June quarter, a welcome dose of disinflation in July, and a remarkably good employment report for July that featured a 528,000 increase in nonfarm payrolls.
The confluence of these forces got the rebound streams flowing. The current then ran faster on the peak inflation/peak Fed narratives which filtered trading excitement into many tributaries that included mega-cap stocks, cryptocurrencies, growth stocks, and meme stocks.
Almost nothing has been left behind. All 11 S&P 500 sectors are higher quarter-to-date and 89% of S&P 500 stocks are above their 50-day moving average (88% of S&P 500 stocks were trading below their 50-day moving average when we published our Market View in May). The CBOE Volatility Index, which hit 33.31 on June 17, fell below 20.00 a few weeks ago.
It has been a rush of rebound excitement, exacerbated by short-covering activity and “flat squeezes,” which is to say sidelined investors sitting on cash have been compelled to put it to work out of fear of missing out on further gains.
Generally speaking, since June 17 it has not paid to be bearish. The S&P 500 hit 3,636.87 that day and late last week it hit 4,325.28, stopping just shy of key technical resistance at its 200-day moving average.
What’s Next?
The question on everyone’s mind is, what’s next? Is there a breakout or a breakdown? It is conceivable that we will see neither. The market could display more lateral movement, taking some extra time to consolidate its recent gains. Fundamentally, though, the support factors for a breakout are lacking.
- The Federal Reserve, with a stated aim of weakening demand, is going to continue to raise policy rates.
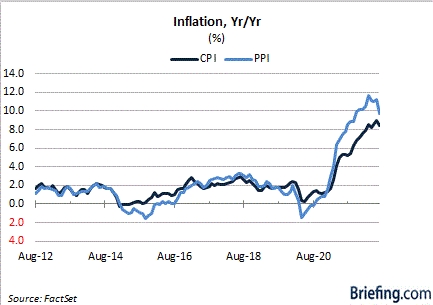
- The CPI and PPI inflation rates are still far too high, and have been matched, or exceeded, in other parts of the world.
- Quantitative tightening (i.e., an effort to reduce the size of the Fed’s balance sheet) is going to ramp up.
- Excluding the Bank of Japan and the People’s Bank of China, central banks around the world are aggressively raising policy rates to fight inflation.
- Earnings estimates have not been cut sufficiently to account for a more challenging economic environment.
- Real disposable personal income is negative at a time when the personal savings rate is at its lowest since 2009.

- A growing list of companies have announced plans to slow their hiring activity or to cut jobs.
- China continues to embrace a zero-COVID policy, which creates a persistent risk of manufacturing shortfalls, weaker trade activity, and supply chain bottlenecks.
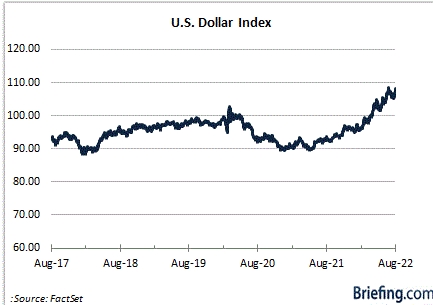
- The U.S. dollar continues to be a force against other major currencies, which is a headwind for U.S. multinational companies and emerging market economies.
- The housing sector is cooling off rapidly as rising mortgage rates have created added affordability pressures.
- (Geo)political uncertainty is rising with the mid-term elections approaching and the U.S. and China at odds over Taiwan.
- Europe continues to be confronted with an energy crisis, and possible recession, given Russia’s ongoing war with Ukraine.
- Consumer confidence and business confidence have deteriorated, weighing on spending plans.
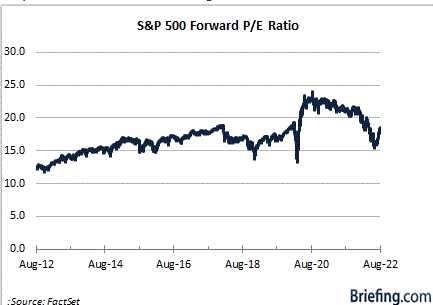
- The market is not cheap at 18.2x forward 12-month earnings estimates. That is a modest premium to the 10-year average (17.0), according to FactSet data, before any additional cuts to earnings estimates and with market rates expected to press higher.
Not Your Average Year
There has been some welcome improvement with energy prices, particularly gasoline prices. They have pulled back noticeably, which is helpful for consumers’ psyche if not entirely for their budget. The current national average for regular gasoline is $3.918/gallon, according to AAA. That’s down 12.8% from $4.495/gallon a month ago and down 21.9% from the highest recorded average of $5.016 on June 14, but it is still up 23.3% from the year-ago average.
Costs for most goods and services are still up significantly from a year ago, which is why various Fed officials have emphasized that the Fed is a long way from declaring victory over inflation.
The current target range for the fed funds rate sits at 2.25-2.50%. The projections provided by the Fed following its June 15 meeting show a median fed funds rate of 3.80% for 2023, meaning there could be at least another 125-150 basis points worth of rate hikes on the way.
The debate right now is whether the Fed will raise by 50 basis points or 75 basis points at its September 20-21 FOMC meeting and when it will ultimately pivot to a rate-cut cycle. The prevailing mantra at the Fed seems to be “higher for longer,” whereas the stock market wants to believe the target range for the fed funds rate will only be “higher for shorter.”
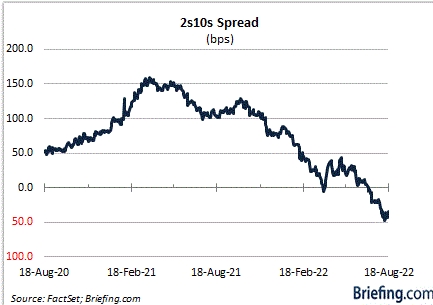
The Treasury market isn’t wrapped up in that idea so much as it appears to be wrapped in concerns about the economic outlook. The inverted yield curve reflects a belief that there will be a significant slowdown in the economy, if not an actual recession, that is sparked by the Fed’s aggressive rate hikes.
How that translates for stocks remains to be seen, but if the Treasury market is right, then it will become clear that earnings estimates are too high.
Those estimates have come down some, yet it has been a fairly stubborn downward revision. The forward 12-month EPS estimate reached $238.15 on June 27, according to FactSet. Today, it sits at $230.79, down just 3.1% from that peak. For calendar year 2022, S&P 500 EPS growth is still projected to be 6.0% versus 9.2% when the year began.
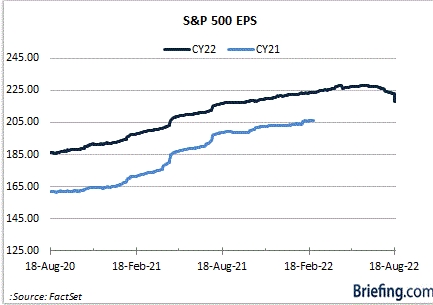
The point is that current earnings growth projections are a long way from recession territory, meaning they would have much more room to fall if a recession came to pass.
Frankly, a projection for 6.0% growth is closer to an average year, and we would submit that this is anything but an average year with the inflation rate still at 8.5%, Russia at war with Ukraine, natural gas prices hitting a 15-year high, consumer sentiment recently hitting an all-time low, the yield curve inverted, and the Fed wanting to use its rate hikes to create some softness in the labor market.
What It All Means
The stock market scaled a wall of worry off its June 17 lows. It did so helped in part by a recognition that things were not as bad as feared on the economic and earnings fronts.
Of course, that is different than saying things are good on the economic and earnings front. They are not. There are cracks in both that will create more challenging conditions on further climbing efforts.
This stock market needs the Fed on its side. It does not have that yet. This stock market needs confidence that the prevailing earnings revision will be higher. It does not have that yet. This stock market needs a positively sloped yield curve. It does not have that yet. This stock market needs an inflation rate closer to 2.0%. It does not have anything close to that yet. This stock market needs further energy price relief. It does not have that yet.
Sentiment has taken this stock market a long way in a short period of time, but this stock market needs a lot more fundamental support to achieve a sustainable breakout from here. That support is still lacking.
—Patrick J. O’Hare, Briefing.com
| https://go.ycharts.com/weekly-pulse Market Recap WEEK OF AUG. 15 THROUGH AUG. 19, 2022 The S&P 500 index slipped 1.2% last week amid mixed earnings from retailers while rate worries also ramped up ahead of a gathering of central bank officials being held next week in Jackson Hole, Wyo. The market benchmark ended Friday’s session at 4,228.48, down from last Friday’s closing level of 4,280.15. This marks the first week in the red since the week ended July 15. The index is still up 2.4% for the month of August so far but still solidly in the red for 2022 with a year-to-date decline of 11%. The slight decline came as investors tried to make sense of retail earnings and FOMC minutes released last week. Among the retail reports, Walmart (WMT) reported fiscal Q2 results above analysts’ expectations and boosted its earnings guidance for fiscal 2023 as the retailer benefited from higher prices, supply chain cost reductions and consumer shopping sprees. Target (TGT), however, reported a larger-than-expected drop in its fiscal Q2 earnings as actions taken to manage inventory levels drove margin pressure, although the retailer still maintained its full-year revenue expectations. Kohl’s (KSS), meanwhile, not only reported lower-than-expected fiscal Q2 results but also slashed its full-year outlook as high inflation is expected to further hurt demand. Investors parsed central bank officials’ comments ahead of the Jackson Hole meeting next week. On Thursday, Federal Reserve Bank of St. Louis President James Bullard said he would “lean toward” a rate increase of 75 basis points at next month’s Federal Open Market Committee meeting. Minutes released last week from the July meeting of the Federal Reserve’s monetary policy-setting committee also showed the committee’s members anticipated “significant policy tightening” in their upcoming meetings to combat inflation. By sector, communication services led to the downside with a 3.3% weekly drop, followed by a 2.4% decline in materials. Other decliners included real estate, financials, technology, consumer discretionary, industrials and health care. Still, three sectors climbed on the week. Consumer staples had the largest percentage increase of the week, up 1.9%, followed by a 1.2% rise in utilities and a 1% gain in energy. The decliners in communication services included Charter Communications (CHTR), whose shares were downgraded by Atlantic Equities to neutral from overweight while the firm slashed its price target on the stock to $477 from $755. Shares fell 4.9% on the week. The materials sector’s drop came amid a slide in gold futures. Decliners included shares of Newmont (NEM), which fell 6.5%, and Freeport-McMoRan (FCX), down 3.7%. Walmart helped drive the advance in the consumer staples sector. The retailer’s shares climbed 3.6% on the week amid relief that the company posted better-than-expected fiscal Q2 results and pared the size of its expected drop in fiscal 2023 adjusted earnings. Cisco (CSCO) also gave consumer staples a big boost as the networking products company reported fiscal Q4 results above analysts’ expectations and said it expects the impact of price increases to lift its gross margin in the current financial year. Cisco’s shares rose 4.5%. Companies expected to release quarterly earnings results next week include Intuit (INTU), Medtronic (MDT), J.M. Smucker (SJM), NVIDIA (NVDA), Salesforce (CRM), Dollar General (DG) and Dollar Tree (DLTR). The market will get readings earlier in the week on US manufacturing and services sector activity for August as well as new and pending home sales for July, but July inflation numbers to be released on Friday are likely to receive the most attention. Provided by MT Newswires |
Where will our markets end this week?
Lower
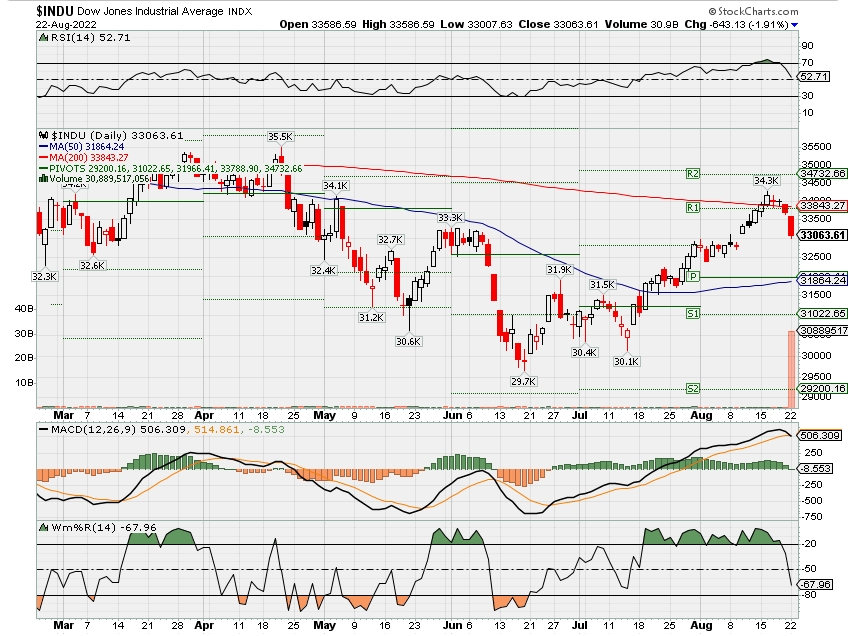
DJIA – Bullish but turned and heading bearish
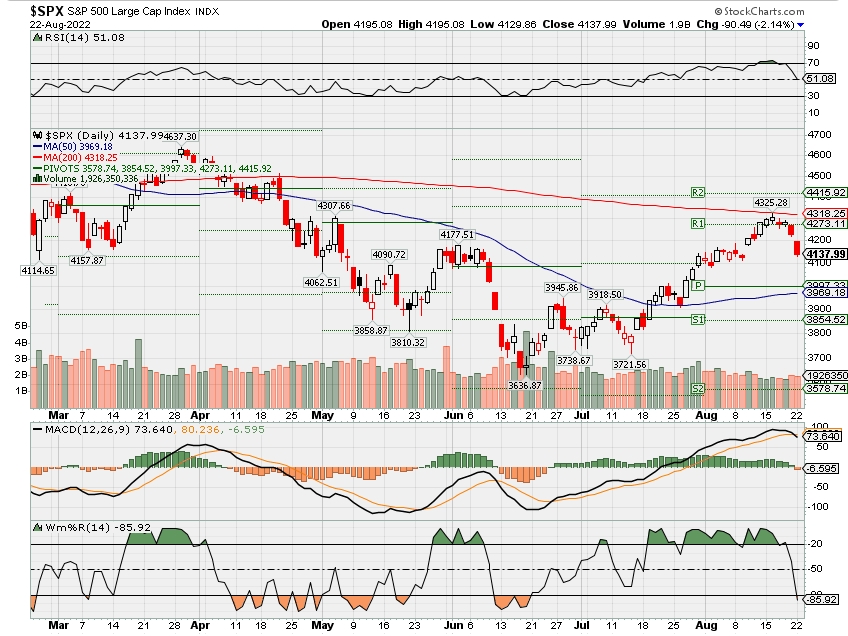
SPX – Bullish but ALMOST technically bearish
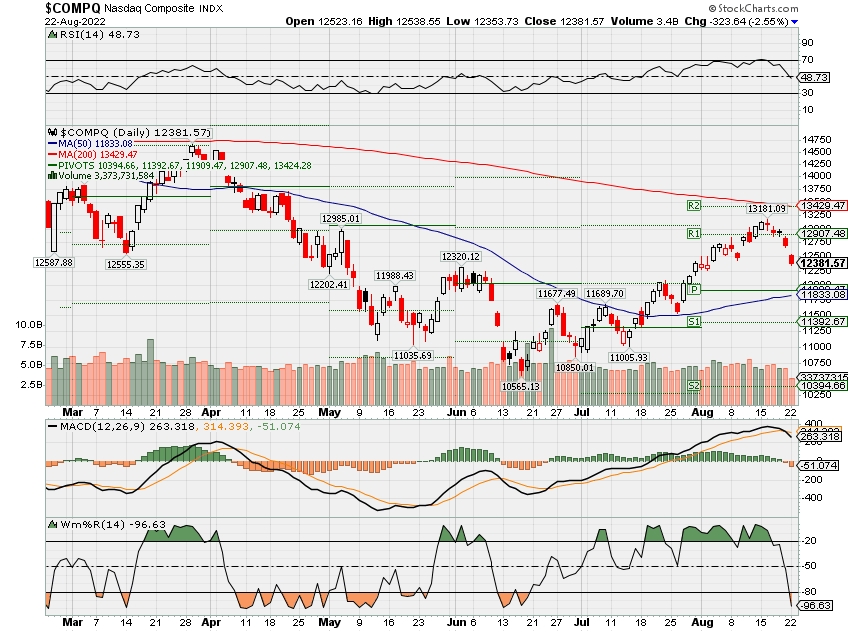
COMP – Bearish
Where Will the SPX end August 2022?
08-22-2022 +2.0%
08-15-2022 +2.0%
08-08-2022 +2.0%
08-01-2022 +2.0%
Earnings:
Mon: PAWN, ZM,
Tues: JD, M, DKS, JWN, TOL, URBN,
Wed: GES, NTAP, NVDA, CRM, SNOW
Thur: ANF, BURL, DG, DLTR, DELL, GPS, MRVL, ULTA, VMW
Fri:
Econ Reports:
Mon:
Tues: New Home Sales,
Wed: MBA, Durable Goods, Durable ex-trans, Pending Home Sales
Thur: Initial Claims, Continuing Claims, GDP, GDP Deflator
Fri: Personal Income, Personal Spending, PCE Prices, Michigan Sentiment
How am I looking to trade?
Currently protection on most core holdings and letting some stocks run
www.myhurleyinvestment.com = Blogsite
customerservice@hurleyinvestments.com = Email
Questions???
So if we start to head sideways I will add the short call at higher strike prices to create a short term revenue stream
What is the full collar trade
Long stock = Bullish
Long Put = Act like insurance when stocks go down
Short Call = Obligation to sell our stock at t a certain price for a certain period of time = Credit into our account
Apple Reportedly Shifting Watch And MacBook Production To Vietnam
BY TYLER DURDEN
WEDNESDAY, AUG 17, 2022 – 04:30 PM
Wary of soaring tensions surrounding out-of-favor countries like China, multinational corporations such as Apple are diversifying production to places with less geopolitical risk.
Nikkei Asia spoke to three sources with direct knowledge of Apple’s plans to shift Watch and MacBook production out of China to Vietnam for the first time.
Apple suppliers Luxshare Precision Industry and Foxconn have already piloted a production run of the Watch in northern Vietnam. The move by Apple is a further win for the Southeast Asian country as it already produces iPads and AirPods.
Two sources told Nikkei Asia that Apple had requested suppliers to set up a MacBook test production line in Vietnam. They said progress in constructing laptop production in the country has been “slow, partly due to pandemic-related disruptions but also because notebook computer production involves a larger supply chain.”
“AirPods, Apple Watch, HomePod and more … Apple has big plans in Vietnam, apart from iPhone manufacturing,” one of the people with direct knowledge of Apple’s plans said. “The components for MacBooks have become more modularized than in the past, which makes it easier to produce the laptops outside of China. But how to make it cost-competitive is another challenge.”
This trend is called “friendshoring.” While it’s a play on “offshoring,” this isn’t about companies moving operations back to the US and Europe, but rather seeking foreign alternatives that retain the benefit of low labor costs but with less international controversy.
Apple’s production diversification comes as the US and China already had an increasingly adversarial relationship before House Speaker Nancy Pelosi’s visit to Taiwan sparked anger with Beijing. The fact is, geopolitical and trade war tensions aren’t going away anytime soon and will only push Apple further away from China. Though reshoring production to the US is unfeasible because of labor costs, maybe robotics can offset some of those costs or perhaps set up shop in Mexico, where there’s abundant cheap labor and healthy demographics.
A recent Rabobank analysis of friendshoring showed that chief beneficiaries would include countries like Vietnam, India, Brazil, Bangladesh, Indonesia, Mexico, Turkey, Egypt, and South Africa.
Apple’s Tim Cook appears to have learned a valuable lesson this year that high exposure of supply chains to China during Beijing’s zero-Covid policies and worsening geopolitical tensions with the West is a dangerous cocktail, and the need to diversify production in a trend dubbed friendshoring is essential for survival in a multi-polar world.
Recession isn’t priced into stocks, says this $1.4 trillion fund manager that has just turned more cautious
Last Updated: Aug. 17, 2022 at 8:57 a.m. ETFirst Published: Aug. 17, 2022 at 6:50 a.m. ET
By Steve GoldsteinWill the FOMC put an end to the FOMO in markets? More on that in a second.
But first we’ll discuss this bearish call from Invesco, the fund manager with $1.4 trillion in assets under management.
For the first time since Feb. 2020, Invesco’s macro framework has entered what it calls a contraction regime, which means both that the economy is growing below its long-term trend and is expected to decelerate. Its definition includes, but doesn’t require, recession.
Invesco’s global leading economic indicator has dropped below its long-term trend for the first time since the second quarter of 2020, when the world was first confronting the coronavirus pandemic, as both the U.S. and the developed ex-U.S. leading indexes have dropped for three straight months. They were dragged down by business surveys, housing indicators, industrial orders, consumer sentiment and labor market conditions in manufacturing — so basically everything, except maybe meme stocks.

INVESCO
Contraction regimes, Invesco says, last an average of 7 months but have run up to 15 months. During those periods, the average annual performance of U.S. stocks vs. the 10-year Treasury is -12%, with global equities performing an even worse -16%. Defensive factors outperform the broader by an average of 4%, Invesco says.
Markets, the firm adds, have largely not priced in a recession. The underperformance of stocks this year is almost entirely in line with the underperformance in 30-year government bonds TMUBMUSD30Y, 3.232%.
https://347614d7421ce9c67455fb2d73eab822.safeframe.googlesyndication.com/safeframe/1-0-38/html/container.html “Broadly speaking, equity and credit markets have not discounted the additional underperformance due to lower earnings growth to be expected in a recessionary scenario,” said Alessio de Longis, senior portfolio manager and head of tactical asset allocation for Invesco Investment Solutions.
The firm sees parallels with the hot inflation of the 1970s and 1980s, although unlike those periods, inflation expectations are less severe and core inflation is not as high. “Our gauge of U.S. inflation momentum provides some early indication of peaking inflationary pressures over the past 3 months, but it is too early to judge the persistence of this negative momentum,” he added.
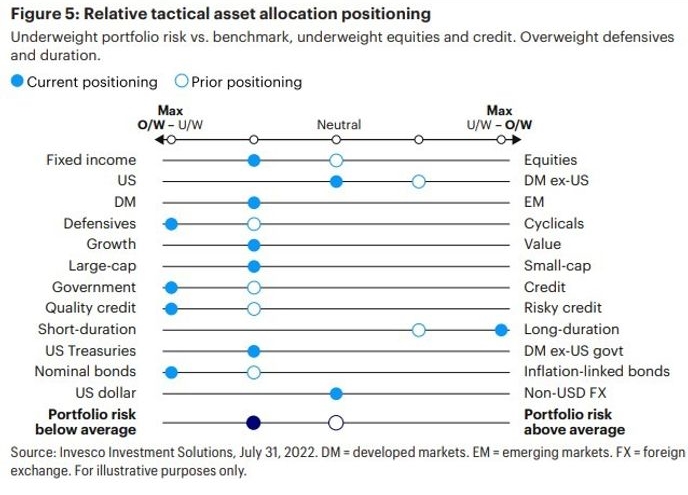
Its asset allocation recommendations reflect the increased caution — more toward bonds than stocks, toward U.S. than developed rivals and toward defensives from cyclicals.
The chart
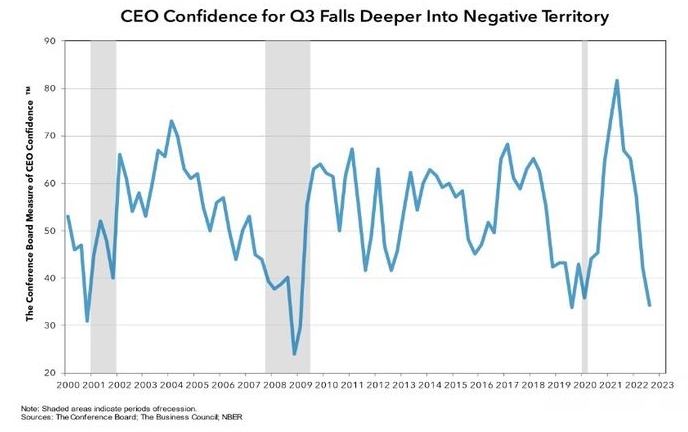
CEOs have not been this pessimistic since the start of the pandemic, according to a quarterly survey from The Conference Board in collaboration with The Business Council. Some 81% said they were preparing for a brief and shallow U.S. recession, with 12% expecting a deep recession and 7% not anticipating any recession at all.
Disney CEO Bob Chapek again distances himself from Bob Iger with Disney+ pricing decision
KEY POINTS
- Disney CEO Bob Chapek’s decision to hike Disney+’s price by $3 per month runs counter to the strategy his predecessor, Bob Iger, had set in place.
- Chapek’s pricing decisions were his alone, according to people familiar with the matter.
- The new strategy emphasizes profitability over subscriber additions.
Disney Chief Executive Officer Bob Chapek keeps making decisions that distance himself from his predecessor, Bob Iger.
As CNBC reported earlier this year, Iger hasn’t agreed with several decisions Chapek has made as Disney’s CEO, including his reorganization of the company and his handling of Florida’s controversial “Don’t Say Gay” legislation.
The latest break is the 38% price increase for Disney+, announced last week as part of a slew of announcements surrounding Disney’s new advertising-supported service, which will launch on Dec. 8. Disney+, without ads, will increase from $7.99 per month to $10.99 per month. Disney+ with ads will begin at $7.99 per month.
Chapek’s pricing strategy differs from the philosophy Iger espoused, according to people familiar with both men’s thinking. Iger wanted Disney+ to be the lowest-priced major streaming offering, said the people, who asked not to be named because the discussions were private. That way, customers would view Disney+ as a stronger value proposition to its competitors even if it felt other services’ content might be more robust. This is also why Iger argued to keep Disney+ separate from Hulu and ESPN+, a strategy Chapek has thus far maintained.
At $7.99 per month with ads, Disney+ will now be more expensive than several other ad-supported products, including NBCUniveral’s Peacock ($4.99) and Paramount Global’s Paramount+ ($4.99), though it will remain cheaper than Warner Bros. Discovery’s HBO Max ($9.99). At $10.99, the ad-free Disney+ will not only be more expensive than Peacock and Paramount+, but it will also be pricier than Amazon Prime Video ($8.99), which also doesn’t include commercials.
Disney+ without ads will still significantly underprice Netflix ($15.49) and HBO Max ($14.99). Disney’s bundled offering of Disney+, Hulu with ads and ESPN+ with ads, will be $14.99 per month, an increase of $1 from its previous cost.
“We launched at an extraordinarily compelling price across all the platforms that we have for streaming,” Chapek said last week. “I think it was easy to say that we’re probably the best value in streaming. Since that initial launch, we’ve continued to invest handsomely in our content. We believe because the increase in the investment over the past two-and-a-half years relative to a very good price point that we have plenty of room on price value.”
Iger vs. Chapek
Iger’s strategy was to slowly raise prices over time, targeting a $1 per month increase each year for the near future, the people said. That’s what happened in March 2021, when Chapek was CEO and Iger was still chair. Disney+ jumped from $6.99 to $7.99. Iger stepped down as Disney’s chair in December.
Slow price increases would allow Disney to suck up as many consumers at each price level — $6.99, $7.99, $8.99, etc. — as possible. Iger declined to comment about Disney+’s new pricing. A Disney spokesperson declined to comment on the differences between Chapek’s and Iger’s strategies.
Chapek’s decision to bump Disney+ by $3 per month, from $7.99 to $10.99, suggests he’s moving Disney’s strategy from maximizing subscriber growth to emphasizing profitability. The pricing decision goes hand-in-hand with Chapek’s decision not to pay for the streaming rights of Indian Premier League, the country’s top cricket league. Chapek also decided to raise ESPN+’s price by $3 per month, from $6.99 to $9.99.
Without the Indian Premier League, starting in 2023, Chapek lowered Disney’s guidance, first made in 2020, that Disney+ would have 230 million to 260 million subscribers by the end of 2024. Disney’s new subscriber forecast by the end of 2024 is 215 million to 245 million.
During the last two years of Iger’s tenure, in 2020 and 2021, lowering streaming guidance likely would have led to Disney shares plummeting. Instead, last week, Disney shares barely budged when CFO Christine McCarthy announced the news on a conference call and rose 6% the day after Disney’s earnings, which included a 15 million Disney+ subscriber gain in the quarter.
The change has to do with investors’ collective souring on Netflix this year, which has affected the entire streaming video industry.
Netflix effect
Chapek is betting investors are OK with a smaller total addressable market of streaming subscribers if the paying customers lead to a profitable business. Disney’s streaming services lost $1.1 billion in its most recent quarter. The large price hikes should get the streaming business to profitability by the end of 2024 even with a lower total subscriber count, Chapek said last quarter. Still, it’s notable Disney had previously planned on getting to streaming profitability by 2024 even before the price increases.
Netflix’s growth has, for the moment, topped out at around 220 million global subscribers. Shares are down more than 60% this year after Netflix has lost subscribers through the first half of the year and projects to add just 1 million paying customers in the third quarter.
The Netflix valuation decline gives cover to executives such as Chapek and Warner Bros. Discovery CEO David Zaslav to reprioritize profit over subscriber growth.
Disney is also taking strides to show the market that it should be focusing on average revenue per user now, rather than just Disney+ subscriber adds. Disney made a point during its third-quarter earnings presentation last week to separate its “core Disney+” subscribers from its Disney+ Hotstar subscribers, based in India, to showcase the much higher average revenue per user for Disney+. The average revenue per Disney+ subscriber was $6.29 per month at the end of Disney’s fiscal third quarter. The ARPU for a Hotstar subscriber was $1.20 per month.
Disney plans to have 135 million to 165 million core Disney+ subscribers by the end of 2024 and “up to” 80 million Hotstar customers.
Near-term profits
By pricing Disney+ with commercials at $7.99, the current price of Disney+, Chapek is favoring higher ARPU over accumulating data on how many customers may be willing to pay for Disney+ at a lower price that won’t subscribe at $7.99. Chapek ostensibly already knows the Disney+ market at $7.99 in the U.S. and Canada, because that’s what Disney+ is priced at currently.
Another of Iger’s motivations to underprice competition with incremental raises was that Disney could get a good sense of demand trends as they bumped Disney+ up by $1 per month per year, according to a person familiar with the matter.
Chapek could have learned how many subscribers would be interested in Disney+ at, say, $4.99 per month, if he made that the starting price with advertisements. His decision to start at $7.99 again suggests he’s more interested in near-term profitability rather than quick subscriber gains that could morph into higher paying customers over time.
It also suggests he’s confident the price increase won’t cause a drop in Disney+ demand.
“We do not believe that there’s going to be any meaningful long-term impact on our churn as a result” of the price hikes, Chapek said.
HI Financial Services Mid-Week 06-24-2014