
HI Market View Commentary 06-08-2020
Email response to Bill:
I think the tech and financials have just lead us out of the drop in the market. Primarily tech was the leader as these new technologies helped the labor markets. With the new, new normal with social distancing gave tech a leg up or an advantage over other industries. Did you notice the paradox we just went through? Shouldn’t it have been medical, bio pharma or patient care facilities that should have made out big? Didn’t happen and in fact most of the Health Care sector got hammered as a whole.
So let’s go over collar trading numbers “in theory” and the same thoughts on Leap calls
Let’s go over the collar trading numbers
IF your dollar loses 50% and gains 50% for 0% average return HOW much is that dollar worth
$1.00 loses 50% so it become $0.50 Gains 50% so it becomes $0.75
So let’s look and the collar trade in general
BTO Long, you BTO long put (2-3 months) and you STO a short calls (6-9 months) to pay for the long put
You have to spend more money or most of your profits to then pay for the next one to two earnings IF you still want long put protection
BTO long stock, BTO long put 2-3 months and STO short call 2-3 months = Means you will have some risk 1.5-4%
With new clientele I usually start off with this format trying to book a profit and then move the profits into leaps
So Now I am playing with the houses money
To MAKE BIG money ie… beat the market the collar trade works BEST with a first quarter big downward movement
BUT traditional collar trading makes up 70% ish to the downside and lowers your cost basis on the stock position
IF you collar trade you NEVER miss an up day in the markets
$100 stock
Spend $7 for long put $100
STO $3 for a short call $115
Total cost basis = 100 + 7 -3 = $104
Max profit 115-104= 12 %
The KEY to the collar trade is picking up more shares of stock !!!!!
So IF you bought 1000 shares @ $100 = $100,000
100000 losses 10% we can pick up 10% more shares of stock
If the stock is trading at $90 a share and we have 100,000/90 = 1,111 shares of stock
100000 losses 20% we can pick up 20% more shares of stock
If the stock is trading at $80 a share and we have 100,000/80 = 1,250 shares of stock
100000 losses 30% we can pick up 30% more shares of stock
If the stock is trading at $70 a share and we have 100,000/70 = 1,428 shares of stock
100000 losses 40% we can pick up 40% more shares of stock
If the stock is trading at $60 a share and we have 100,000/60 = 1,666 shares of stock
100000 losses 50% we can pick up 50% more shares of stock
If the stock is trading at $50 a share and we have 100,000/50 = 2000 shares of stock
1,111 = 96,000 BUT if we get back to $100 then we have 111,000
1250 =76,000 BUT if we get back to $100 then we have 125,000
1428 =66,000 BUT if we get back to $100 then we have 142,800
1666 =56,000 BUT if we get back to $100 then we have 166,600
2000 = 46,000 BUT if we get back to $100 then we have 200K
WHY is it som important to add the shares
Losses 50K = 46K profit for you and then the 100 shares get back to $100 = 100K + 46K = 146,000
My ideal trade is collar trade, get called out and then convert the profits to leap long call replacement strategy = Protects initial investment capital
JPM – 400 shares @ 98.59
Short call on 300 shares for $3.22 credit obligated to sell at $120
Profit would equal 120-98.59+3.22 = $24.63 per share
Current puts = 24.63 – 4.40 + 1.78 = overall profit of $22.01
I would buy the $115 Jan 22 Leap long calls for $11.05 = 6 contracts costing me $0.045 per contract for 597 days
So why don’t you use more long puts against the leaps?
IF I added long puts it would have cost me $4.40 or 40% of the cost basis on my leap
I personally would rather spend that money on dollar cost averaging
11 + 4.40 = 15.40 / 2 = $7.70
THE WHOEL IDEA behind the collar trade is surviving the market storms and allowing stocks to recover.
https://www.briefing.com/the-big-picture
The Big Picture
Last Updated: 05-Jun-20 14:37 ET
Hiring activity returns, but labor market not back yet
There were no Mayday calls following the May Employment Situation Report like many market watchers, including us, thought there would be. Those calls apparently were left behind in April, which featured a downwardly revised 20.687 million decline in nonfarm payrolls. For May, there was no such decline. In fact, there was no decline at all.
Nonfarm payrolls increased by 2.509 million while nonfarm private payrolls surged by 3.094 million. Economists were expecting a decline closer to 9.0 million for nonfarm payrolls.
We were even worse with our estimate, which called for an 11.0 million decline in nonfarm payrolls. Boy, was that ever wrong.
The hiring activity was a surprise to say the least, as it reflected an economy that was bouncing back sooner than thought from the darkest days of the COVID-19 shutdown. It’s still a gross overstatement, though, to say “we’re back.”
Good Things
Credit needs to be given where credit is due. It was hard at this point not to like the May employment report.
It’s a good thing when more people are working and making a steady income. It’s a good thing when businesses feel better about end demand that they feel the need to hire more workers. It’s a good thing when the labor force participation rate is increasing.
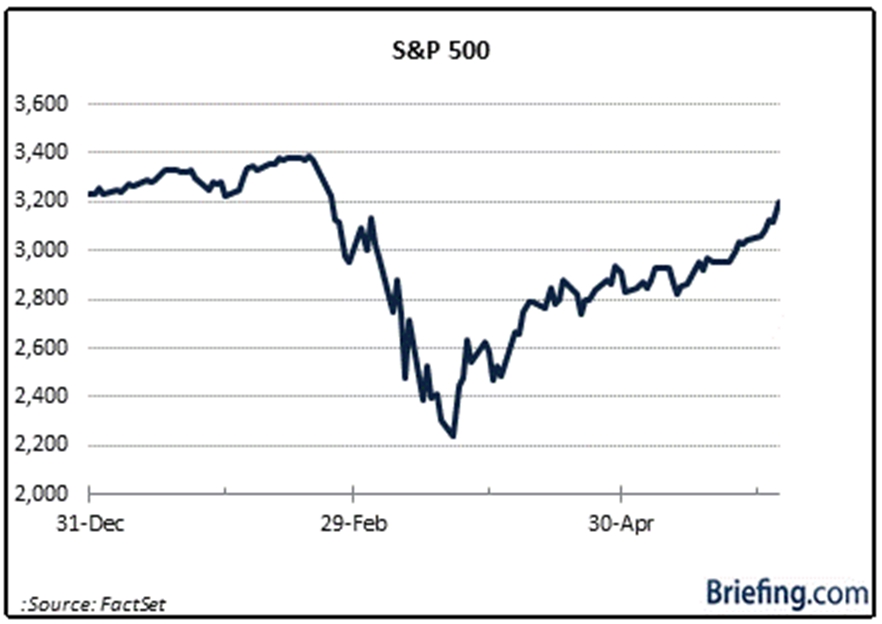
It is easy to generalize that the May employment report was right up the stock market’s bullish-minded alley. It could hardly ask for more at a time like this, so it took what it was given with appreciation and extended its monstrous rally off the March 23 low. As of this writing, the S&P 500 was up 46% from that low.
By the same token, it is easy to generalize that there is a lot of heavy lifting left to do before declaring that the labor market is back. That point understandably got swept under the rug in the excitement of the nonfarm payrolls gain.
We’re not aiming to be a Debbie Downer here. We’re just being objective given the data available in the report.
We’re Not Back
It was wonderful to see the pickup in nonfarm payrolls. It presumably had a lot to do with the Paycheck Protection Program (PPP), but it would be unfair to say it had everything to do with that program. After all, not all businesses were eligible to apply for the PPP, and it’s safe to say that reopening optimism spurred some employers to bring on more workers.
Nonetheless, one can extrapolate from the report some of the PPP influence given that the number of employees on temporary layoff declined by 2.72 million from April. That’s good news.
The bad news is that 15.343 million unemployed workers are still on temporary layoff. That’s a large number and it’s why we believe, along with other payroll statistics, that it’s a gross overstatement to say “we’re back.” The table of nonfarm payroll information below, which isn’t comprehensive, captures this view.
| Category | March 2020 (mln) | May 2020 (mln) | Difference (mln) |
| Goods-producing | 21.086 | 19.382 | 1.704 |
| Construction | 7.574 | 7.043 | 0.531 |
| Manufacturing | 12.806 | 11.707 | 1.099 |
| Retail Trade | 15.586 | 13.668 | 1.918 |
| Information | 2.888 | 2.578 | 0.310 |
| Financial Activities | 8.827 | 8.596 | 0.231 |
| Pro & Business Services | 21.456 | 19.394 | 2.062 |
| Education & Health | 24.408 | 22.242 | 2.166 |
| Leisure & Hospitality | 16.124 | 9.824 | 6.300 |
| Government | 22.728 | 21.180 | 1.548 |
| Unemployment Rate | |||
| White | 4.0% | 12.4% | 8.4 pp |
| Black | 6.7% | 16.8% | 10.1 pp |
| Asian | 4.1% | 15.0% | 10.9 pp |
| Hispanic | 6.0% | 17.6% | 11.6 pp |
Source: BLS
Labor Market CARES
The labor market data should continue to improve in coming months. How much it improves is the unanswered question.
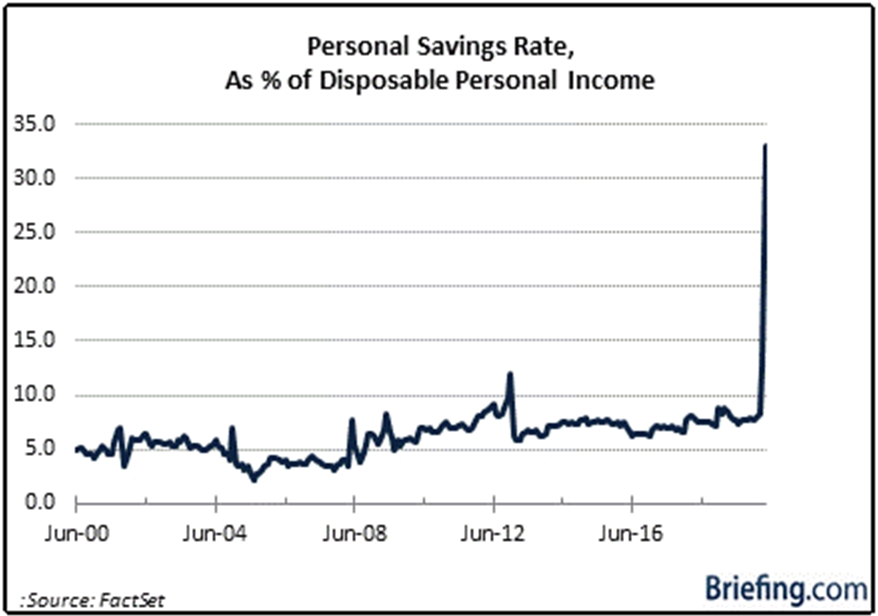
A lot of businesses are reopening, albeit with restricted capacity. The key to rehiring is in the pace of consumer spending. With the personal savings rate as a percentage of disposable income soaring to 33.0% in April, there is a lot of pent-up spending potential.
That potential won’t get unleashed, though, if consumers don’t feel confident about their job and income prospects. The May employment report should provide some hope there. It is a confidence booster on the surface along with recent reports that summer travel demand is picking up and that coronavirus cases for the nation as a whole are coming down.
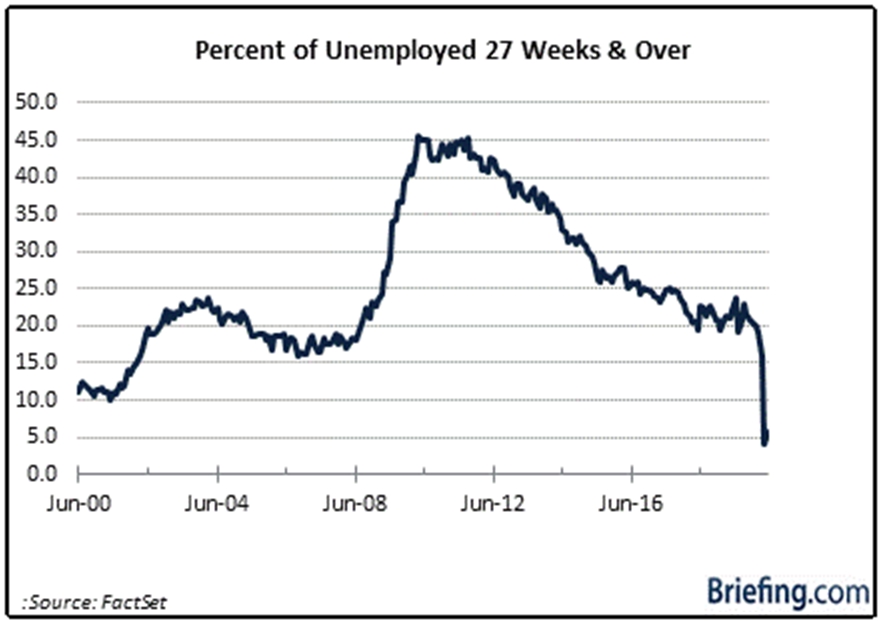
Still, there are a lot of people unemployed — 20.985 million, according to the BLS’s definition of unemployed — and 5.6% of the unemployed have been out of work 27 weeks or more, up from 4.1% in April but a far cry from the height of the Great Recession. This number isn’t registering much now, but it will be an increasingly important metric to watch leading up to the election in November.
What’s noteworthy is that the extra unemployment benefit of $600 per week under the CARES Act expires July 31. It’s being referred to as an “income cliff,” because income will drop precipitously after that date for workers collecting unemployment benefits if that provision is not extended.
Mindful of that, there could be an increased propensity to save more in the next few months, especially if one remains worried about a temporary layoff turning into a permanent job loss.
What It All Means
The May employment report didn’t come with a Mayday call, but there are still distress signals that can be heard in it. The ranks of the unemployed are still quite large and unemployment rates for all ethnic groups are extremely high.
The official unemployment rate of 13.3% is hard to believe considering it was just 4.4% only a few months ago. What some may find harder to believe is that the stock market was overjoyed to see an unemployment rate of 13.3%.
The reason being is that the stock market thought it would be more like 20.0%. On a relative basis, it is an encouraging statistic. On an absolute basis, it is terrible. The stock market, though, is operating on relative terms.
The May employment report was undeniably relatively good and a bit ahead of the times. Most were inclined to think that an increase in nonfarm payrolls wouldn’t show up until the June employment report. Now, it will almost certainly be expected.
That’s understandable for a labor market that is coming back from the depths of despair, but which still has a long way to go to get back to where it was only a few months ago. What transpired in May, though, was generally a step in the right direction for a stock market that has been ahead of the times.
—Patrick J. O’Hare, Briefing.com
Where will our markets end this week?
Bullish
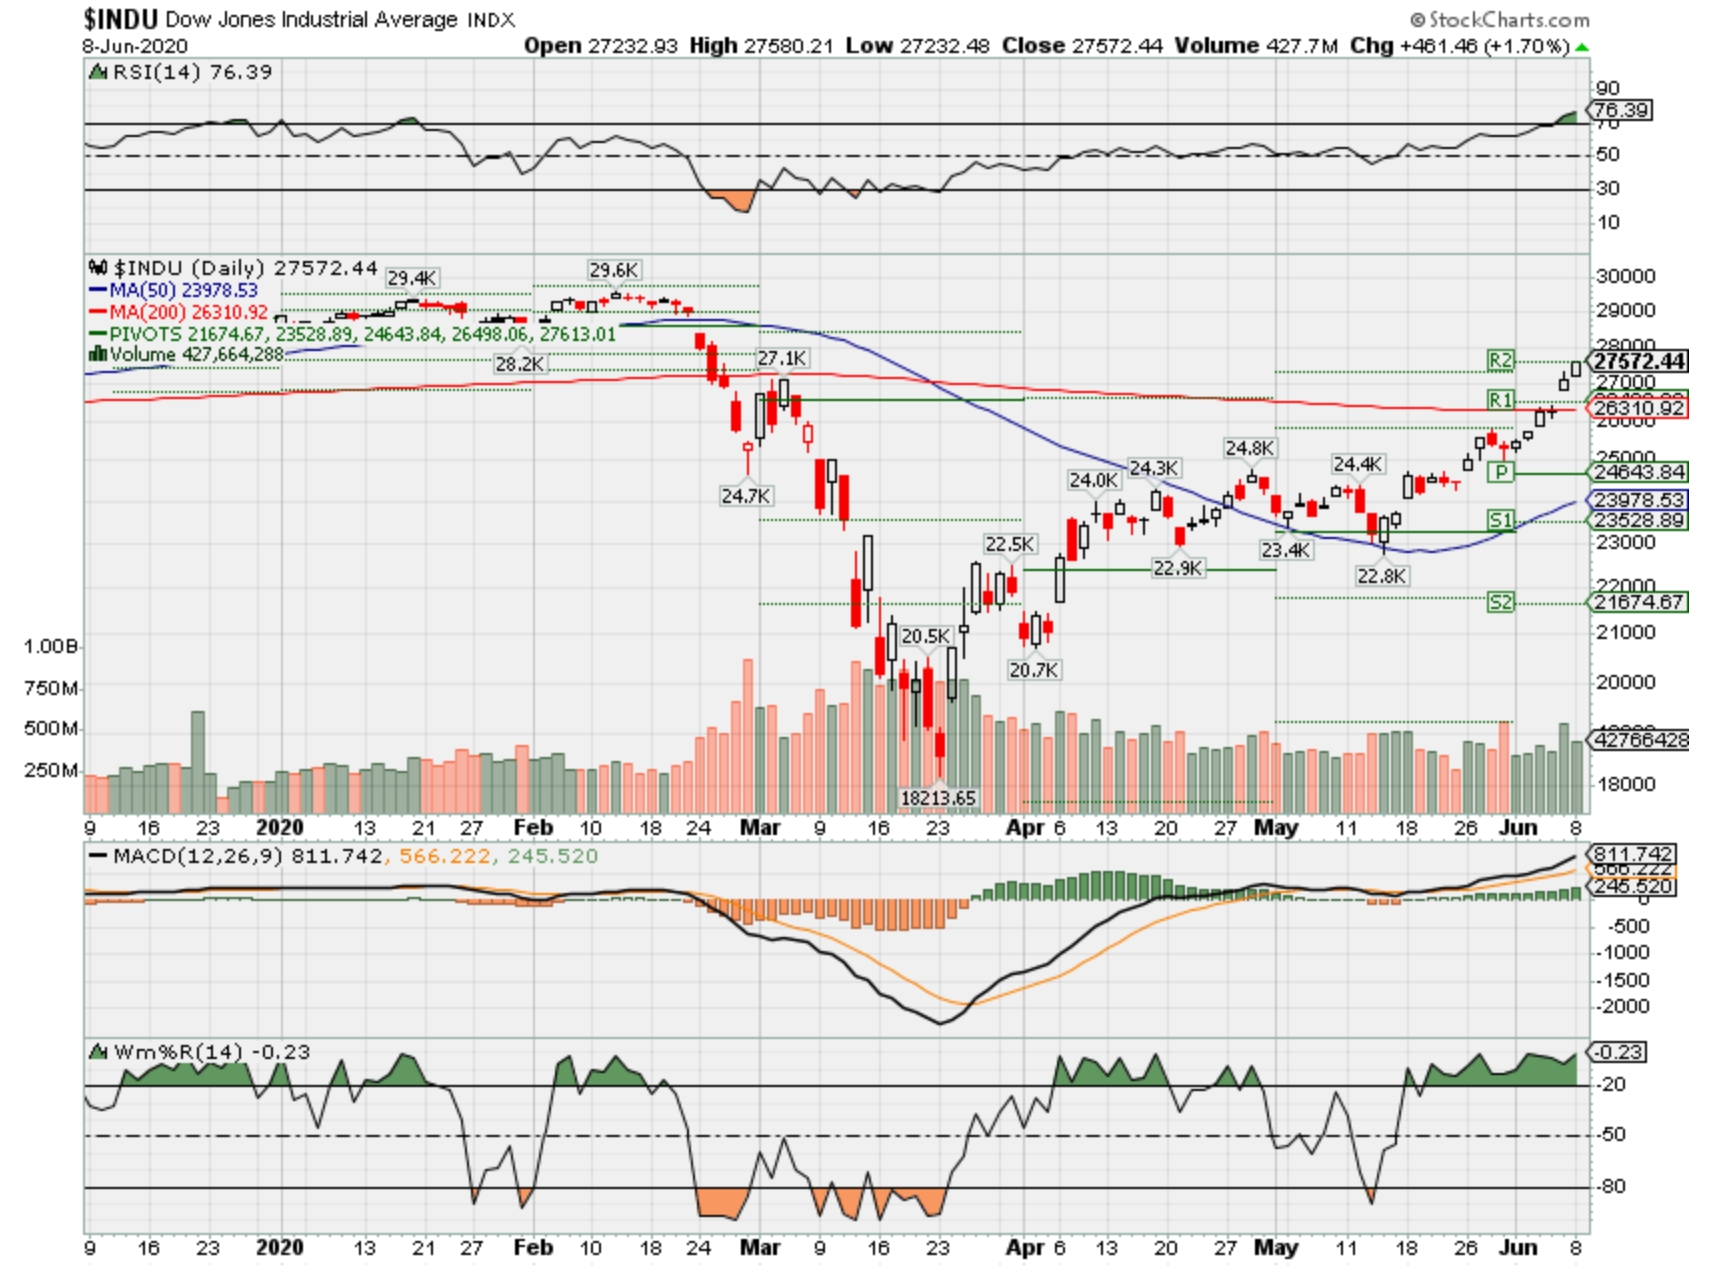
DJIA – Bullish but overbought
SPX – Bullish but overbought
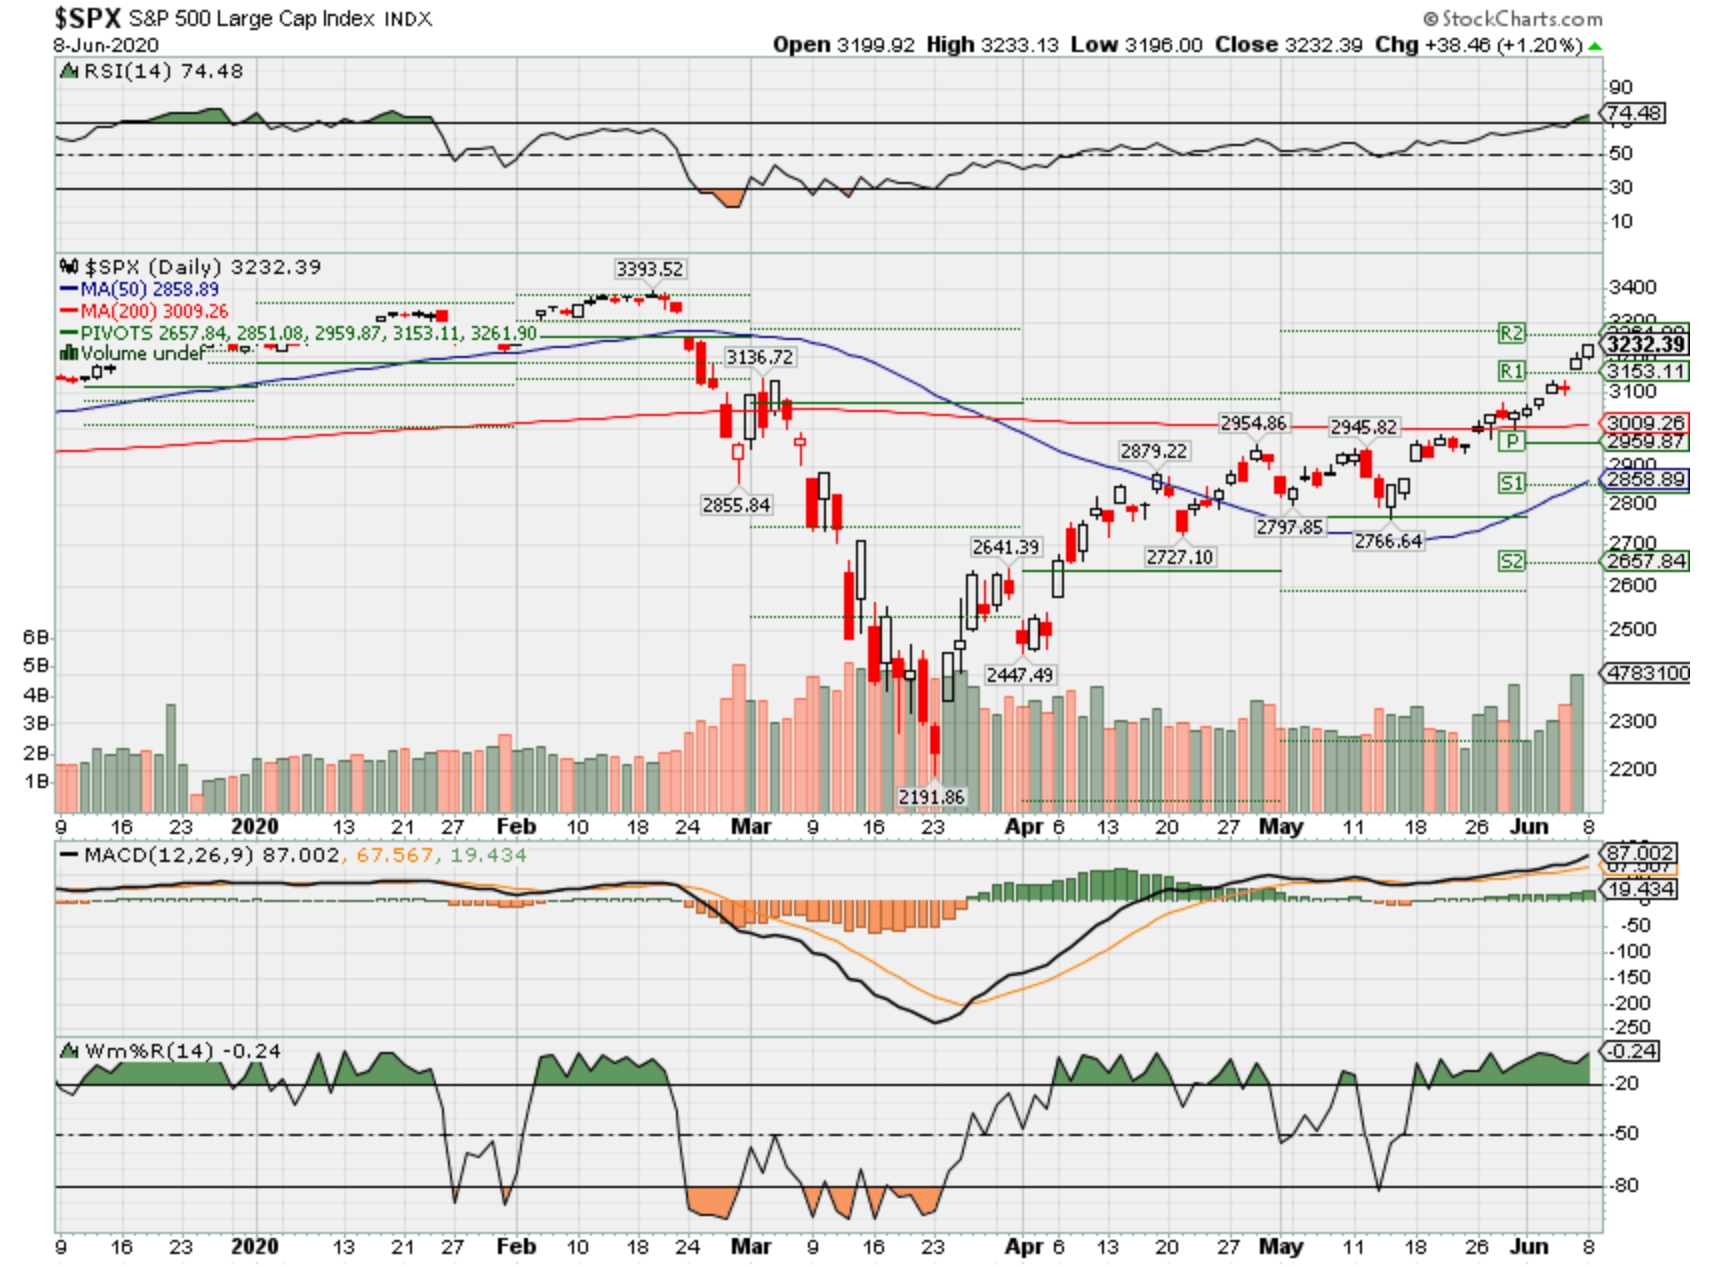
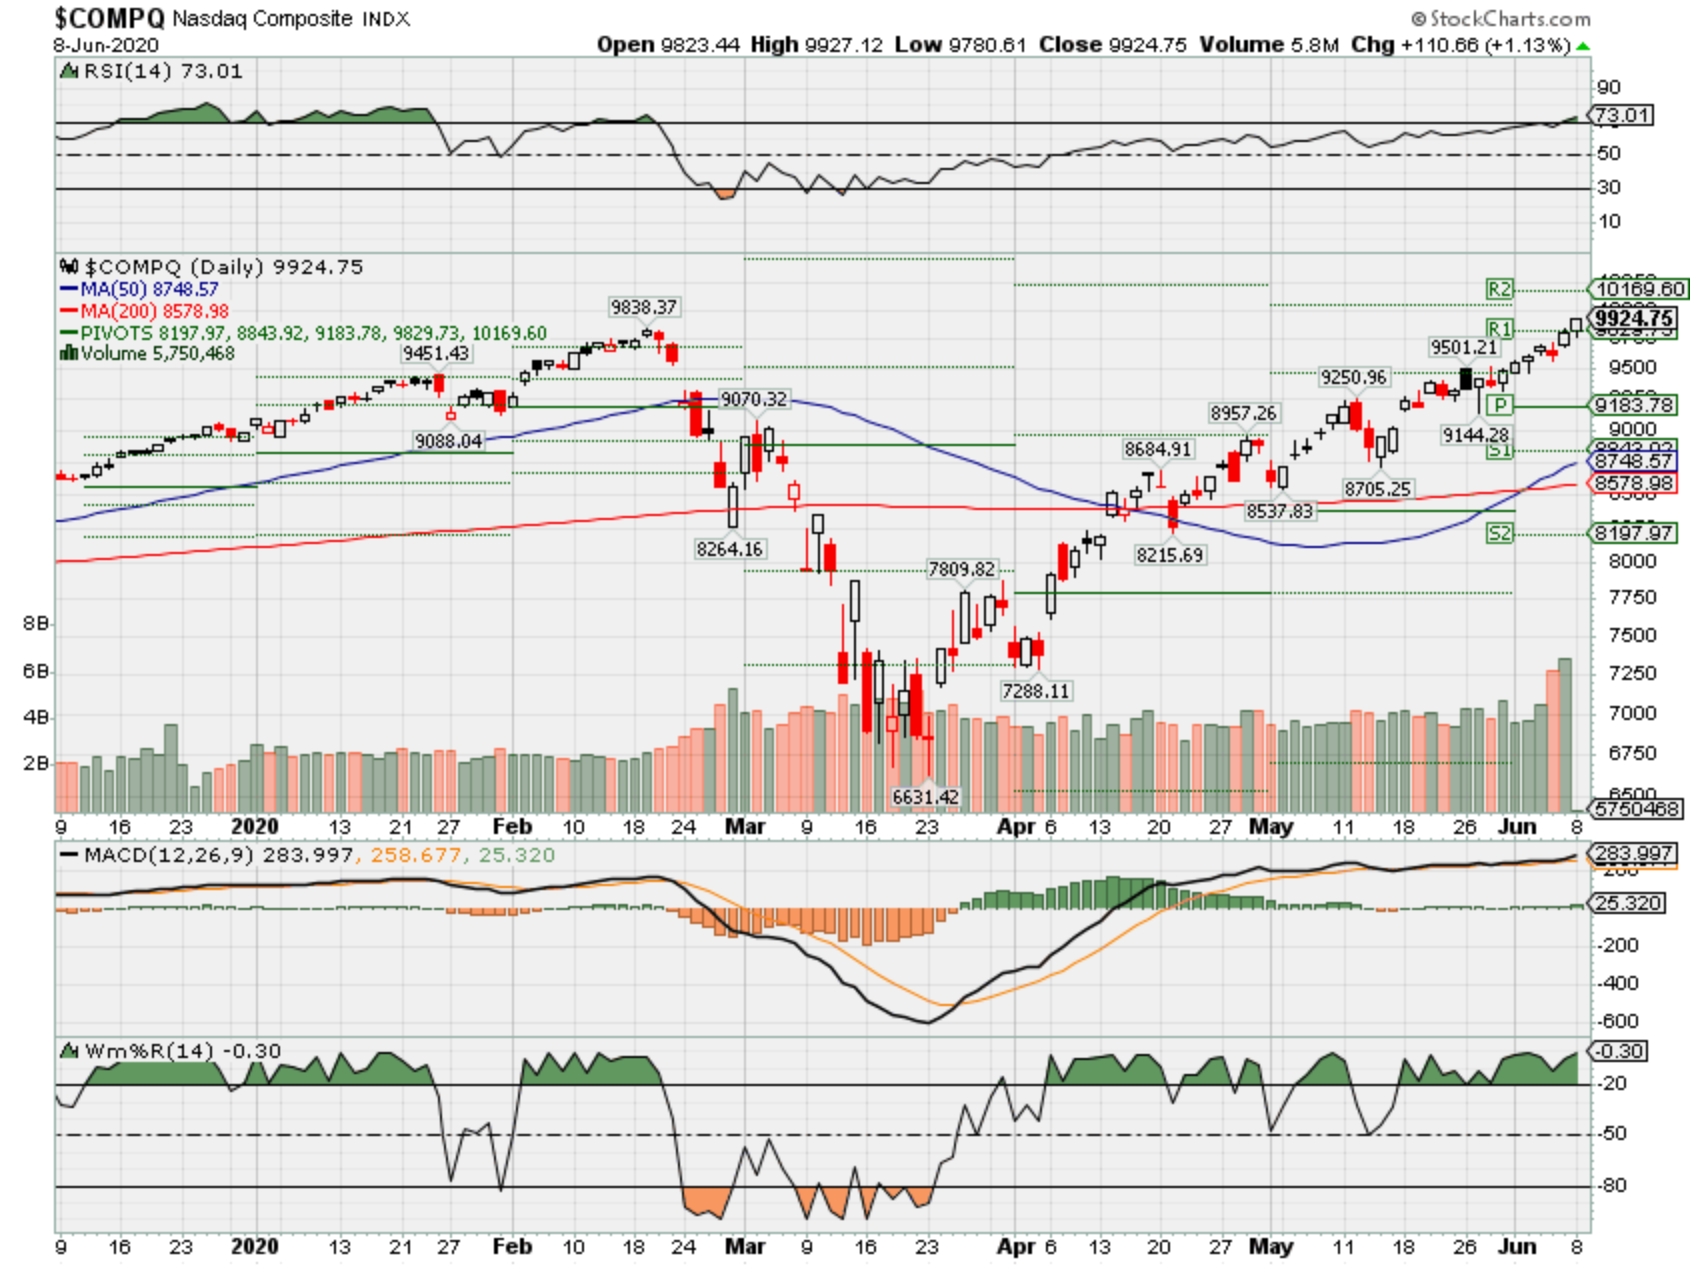
COMP – Bullish, overbought and at an all time high
Where Will the SPX end June 2020?
06-08-2020 +2.5%
06-01-2020 +2.5%
05-26-2020 +0.0%
Earnings:
Mon: SFIX,
Tues: GCO, TIF, AMC, FIVE
Wed: CHS, GES
Thur: ADBE, LULU
Fri:
Econ Reports:
Mon:
Tues: Wholesale Inventories, NFIB small Business Optimism index
Wed: MBA, CPI, Core CPI, FOMC Rate Decision
Thur: Initial Claims, Continuing claims, PPI, Core PPI
Fri: Import, Export, Michigan Sentiment
Int’l:
Mon – CN: Trade Balance, EUR: Industrial Production, Lagarde Speech
Tues – EUR: GDP
Wed – CN: CPI, PPI
Thursday –
Friday-
Sunday –
How am I looking to trade?
Letting some things run, Taking Profits on FB and we are paring down BA , short term covered calls on stock positions for June
We are trying to enjoy the run up until July Earnings
www.myhurleyinvestment.com = Blogsite
customerservice@hurleyinvestments.com = Email
Questions???
https://www.thebalance.com/what-are-the-sectors-and-industries-of-the-sandp-500-3957507
INVESTING FOR BEGINNERS ECONOMICS
What Are the Sectors and Industries of the S&P 500?
Understanding the Makeup of the Economy, Stock Market, and Stock Market Indices
Updated April 27, 2020
The general economy and stock market are organized into two tiers. The highest tier, a sector, is a broad grouping of companies with similar economic characteristics.1 There are 11 major sectors most investors use when breaking down the corporations and other issuers of securities such as stocks and bonds.2
Sectors are broken down into subcategories known as industries. This allows a closer grouping of similar businesses. For example, both Dollar Tree, a discount retail chain, and Tiffany & Company, a luxury jeweler, are included in the consumer discretionary sector. However, they are sorted into different industries.
Why Sectors and Industries Matter
Examining sectors and industries allows you to compare one business to its closest competitors. You may think a certain stock is a good purchase, but until you research its rivals, it’s difficult to know for sure.
Looking at sectors and industries helps you become familiar with how businesses interact with one another. For example, if you believe energy prices are going to decline, you might find transportation stocks appealing because you believe one of the biggest cost inputs—gasoline and jet fuel—is about to plummet. When combined with disciplined, long-term investing, such knowledge can be a ticket to building wealth.
With exchange-traded funds (ETFs), you can buy a diversified basket of an entire grouping. ETFs are similar to mutual funds but trade like stocks, and allow you to get exposure to a wide range of investments in a sector or industry without needing to research individual stocks.3
Many financial advisers recommend that investors try to maintain a portfolio that offers good exposure to all of these industries and sectors.4
Communication Services
From telephone access to high-speed internet, the communication services sector of the economy keeps us all connected and includes stocks such as AT&T and Verizon.
Through the first quarter of 2020, the communications services sector experienced a 10-year growth rate of 39.02%. The S&P 500 during that time grew at a rate of 121.01%.5
The communication services sector is made up of five industries:
- Diversified Telecommunication Services
- Wireless Telecommunication Services
- Entertainment
- Media
- Interactive Media & Services
Consumer Discretionary
The consumer discretionary sector consists of businesses that have demand that rises and falls based on general economic conditions. Products in this sector include everything from washers and dryers to sporting goods to new cars to diamond engagement rings and more. Examples of consumer discretionary stocks include Apple, Disney, and Starbucks.
Through the first quarter of 2020, the consumer discretionary sector experienced a 10-year growth rate of 206.59%. The S&P 500 during that time grew at a rate of 121.01%.5
The consumer discretionary sector contains 11 industries:
- Automobile Components Industry
- Automobiles Industry
- Distributors Industry
- Diversified Consumer Services Industry
- Hotels, Restaurants & Leisure Industry
- Household Durables Industry
- Leisure Products Industry
- Multiline Retail Industry
- Specialty Retail Industry
- Textile, Apparel & Luxury Goods Industry
- Internet & Direct Marketing
Consumer Staples
The consumer staples sector consists of businesses that sell the necessities of life, ranging from bleach and laundry detergent to toothpaste and packaged food.
Through the first quarter of 2020, the consumer staples sector experienced a 10-year growth rate of 94.47%. The S&P 500 during that time grew at a rate of 121.01%.5
The consumer staples sector contains six industries and includes companies such as Procter & Gamble and Kroger:
- Beverages Industry
- Food & Staples Retailing Industry
- Food Products Industry
- Household Products Industry
- Personal Products Industry
- Tobacco Industry
Energy
The energy sector consists of businesses that source, drill, extract, and refine the raw commodities we need to keep the country going, such as oil and gas. Major energy stocks include Exxon Mobil, Chevron, and Halliburton.
Through the first quarter of 2020, the energy sector declined 48.08% over the previous 10 years. The S&P 500 during that time grew at a rate of 121.01%.5
The energy sector contains two industries:
- Energy Equipment & Services Industry
- Oil, Gas & Consumable Fuels Industry
Financials
The financial sector consists of banks, insurance companies, mortgage real estate investment trusts (REITs), credit card issuers, and a host of other money-centric enterprises that keep the debits and credits of the economy flowing. JPMorgan Chase, Goldman Sachs, and Bank of America are all examples of financial stocks.
Through the first quarter of 2020, the financials sector experienced a 10-year growth rate of 61.12%. The S&P 500 during that time grew at a rate of 121.01%.5
The financial sector contains seven industries:
- Banking Industry
- Capital Markets Industry
- Consumer Finance Industry
- Diversified Financial Services Industry
- Insurance Industry
- Mortgage Real Estate Investment Trusts (REITs) Industry
- Thrifts & Mortgage Finance Industry
Health Care
The health care sector consists of drug companies, medical supply companies, and other scientific-based operations that are concerned with improving and healing human life. Examples of health care stocks include Johnson & Johnson, Gilead, and Pfizer.
Through the first quarter of 2020, the health care sector experienced a 10-year growth rate of 177.15%. The S&P 500 during that time grew at a rate of 121.01%.5
The health care sector contains six industries:
- Biotechnology Industry
- Health Care Equipment & Supplies Industry
- Health Care Providers & Services Industry
- Health Care Technology Industry
- Life Sciences Tools & Services Industry
- Pharmaceuticals Industry
Industrials
The industrial sector comprises railroads and airlines to military weapons and industrial conglomerates. Major industrial stocks include Lockheed Martin and CSX.
Through the first quarter of 2020, the industrials sector experienced a 10-year growth rate of 82.66%. The S&P 500 during that time grew at a rate of 121.01%.5
The industrial sector contains fourteen industries:
- Aerospace & Defense Industry
- Air Freight & Logistics Industry
- Airlines Industry
- Building Products Industry
- Commercial Services & Supplies Industry
- Construction & Engineering Industry
- Electrical Equipment Industry
- Industrial Conglomerates Industry
- Machinery Industry
- Marine Industry
- Professional Services Industry
- Road & Rail Industry
- Trading Companies & Distributors Industry
- Transportation Infrastructure Industry
Information Technology
The information technology (IT) sector is home to the hardware, software, computer equipment, and IT services operations that make it possible for you to be reading this right now. From microprocessors to printers, operating systems to cellphone handsets, recent advances in technology have turned IT into a giant part of the domestic and global economies. Top IT stocks include Microsoft and Alphabet.
Through the first quarter of 2020, the information technology sector experienced a 10-year growth rate of 275.27%. The S&P 500 during that time grew at a rate of 121.01%.5
The information technology sector contains six industries:
- Communications Equipment Industry
- Electronic Equipment, Instruments & Components Industry
- IT Services Industry
- Semiconductors & Semiconductor Equipment Industry
- Software Industry
- Technology Hardware, Storage & Peripherals Industry
Materials
The building blocks that supply other sectors with the raw materials they need to conduct business, the materials sector manufacturers, logs, and mines everything from precious metals, paper, and chemicals to shipping containers, wood pulp, and industrial ore. Major materials stocks include Dow, Dupont, Ecolab, and International Paper.
Through the first quarter of 2020, the materials sector experienced a 10-year growth rate of 38.41%. The S&P 500 during that time grew at a rate of 121.01%.5
The material sector contains five industries:
- Chemicals Industry
- Construction Materials Industry
- Containers & Packaging Industry
- Metals & Mining Industry
- Paper & Forest Products Industry
Real Estate
The real estate sector includes all real estate investment trusts (REITs) with the exception of mortgage REITs, which are housed under the financial sector. The sector also includes companies that manage and develop properties and includes stocks such as American Tower, Simon Property Group, and Prologis.
Through the first quarter of 2020, the real estate sector declined 2.77% over the previous 10 years. The S&P 500 during that time grew at a rate of 121.01%.5
The Real Estate sector is made up of two industries:
- Equity Real Estate Investment Trusts
- Real Estate Management & Development
Utilities
The utilities sector of the economy is home to the firms that make our lights work when we flip the switch, let our stoves erupt in flame when we want to cook food, make water come out of the tap when we are thirsty, and more. Utilities stocks include many local electricity and water companies including Exelon and Dominion Resources.
Through the first quarter of 2020, the utilities sector experienced a 10-year growth rate of 86.97%. The S&P 500 during that time grew at a rate of 121.01%.5
The utilities sector is made up of five industries:
- Electric Utilities Industry
- Gas Utilities Industry
- Independent Power and Renewable Electricity Producers Industry
- Multi-Utilities Industry
- Water Utilities Industry
Fed finds new challenge for the economy: Workers who don’t want to come back to their jobs
PUBLISHED WED, MAY 27 20202:25 PM EDTUPDATED WED, MAY 27 20204:40 PM EDT
Jeff Cox@JEFF.COX.7528@JEFFCOXCNBCCOM
KEY POINTS
- The Fed’s Beige Book said economic activity “declined” across much of the country, “falling sharply” in most regions.
- Amid mass unemployment, workers were reluctant to go back to their jobs.
- They cited safety concerns, child care issues and the generous unemployment benefits the government has been providing.
- Business leaders “were pessimistic about the potential pace of recovery,” the report said.
Mass unemployment that has accompanied the coronavirus pandemic has been compounded by people who don’t want to come back to work, the Federal Reserve said Wednesday in its periodic summary of the national economy.
With the unemployment rate through April at a post-World War II record 14.7% and 20.5 million layoffs during the month, workers are reluctant to head back to their jobs for a number of reasons, the central bank noted in its “Beige Book” report.
The report also cited a generally downbeat outlook from business contacts regarding hopes for a recovery.
Business leaders “cited challenges in bringing employees back to work, including workers’ health concerns, limited access to childcare, and generous unemployment insurance benefits,” the report said.
Nearly 40 million people have submitted unemployment claims since the coronanvirus was declared a pandemic in mid-March, and more than 25 million have been receiving benefits for at least two weeks, according to the Labor Department. The government has responded with aggressive benefits programs that pay many workers their regular benefits plus $600.
In addition, the Paycheck Protection Program provides business loans to retain workers for eight weeks.
The Fed report noted that the PPP “helped many businesses to limit or avoid layoffs, although employment continued to fall sharply in retail and in leisure and hospitality sectors.” Banks have seen “strong” demand for the loans.
Broadly speaking, the economy “declined” across all 12 Fed districts “falling sharply in most” amid plunges in activity for retail and the leisure and hospitality sectors. While auto sales were “substantially lower” than last year, some areas did report improvement since the last Beige Book report on April 15.
There also was a lack of optimism about the future.
“Although many contacts expressed hope that overall activity would pick-up as businesses reopened, the outlook remained highly uncertain and most contacts were pessimistic about the potential pace of recovery,” the report said.
The agriculture and energy industries also reported strong declines as energy prices have plummeted and production at meatpacking facilities was slowed by coronavirus infections that shut down some of the biggest processing plants.
Real estate also took a big hit, as sales “plunged” due in part to a lack of inventory and restrictions on showings across much of the country. Commercial real estate owners noted a large number of tenants who missed or deferred payments.
BUT Who gets the profit? D’Souza Absolutely Gets Core Marxist Argument
https://www.facebook.com/youngamericasfoundation/videos/915873885438331/
https://seekingalpha.com/article/4351622-bank-of-america-is-rising-from-ashes
Bank Of America Is Rising From Its Ashes
Jun. 2, 2020 9:15 PM ET
Summary
Bank of America stock is recovering from the COVID-19 lows of March 2020.
The current earnings are hurting from (temporary) credit provisions.
Current valuation levels are on the low side.
The low implied volatility creates opportunities with a strong risk-reward profile.
Investment thesis
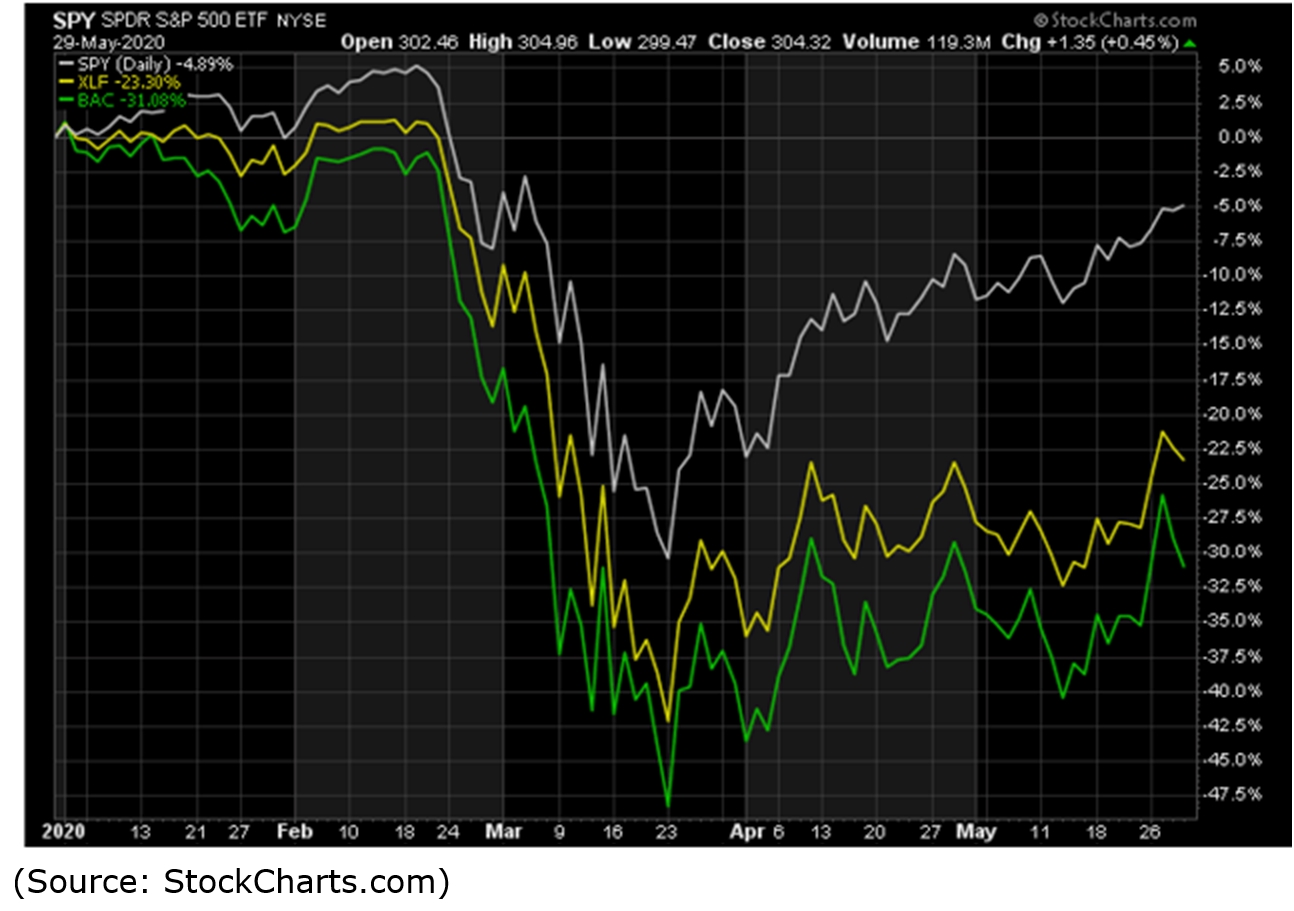
The stock market has been strongly impacted by the coronavirus, which triggered a selling wave in all equities. Large banking corporations, like Bank of America (BAC) or Wells Fargo (WFC), have seen their equity values decline by 50%, whereas the stock market in general stopped the decline at 30%. A number of equities have started a V-shape recovery, whereas the major banks are still recovering from their recent 52-week low levels.
Bank of America’s business model is negatively impacted by the lower interest rates and the increase of the credit provisions, as a consequence of the COVID-19 virus. This has pushed the current valuation of the bank to an all-time low level, which is not in line with the long-term intrinsic value.
We expect the stock price of BAC to retrieve to its previous high levels of $33 and will present an investment idea which investors and traders can use to benefit from this potential pullback.
Price Performance during the COVID-19 correction
Bank of America stock price corrected by 50% during March 2020 as the coronavirus caused a selling spree in the stock market. The stock price went as low as $17.95, a level we had not seen in the last 3 years (since November 2016).
After this new multi-year low-level was reached on March 23, 2020, investors gained their trust again in the stock market and equity prices started to rebound. BAC followed the rise in the broader stock market but lagged behind.
At the moment of writing this article, the S&P 500 (SPY) is still 10% away from its previous 52-week high level, whereas BAC is still 33% below its top level. The same can be said for the financial sector (XLF), but even here BAC is underperforming.
When we look at its performance during the second half of the previous month, we can see Bank of America is starting to catch up with the stock market in general.

The stock price rose strongly on May 26 and 27 with above-average volume. While there still is a long way to go, it seems investors and large funds are purchasing bank stocks again in their portfolio.
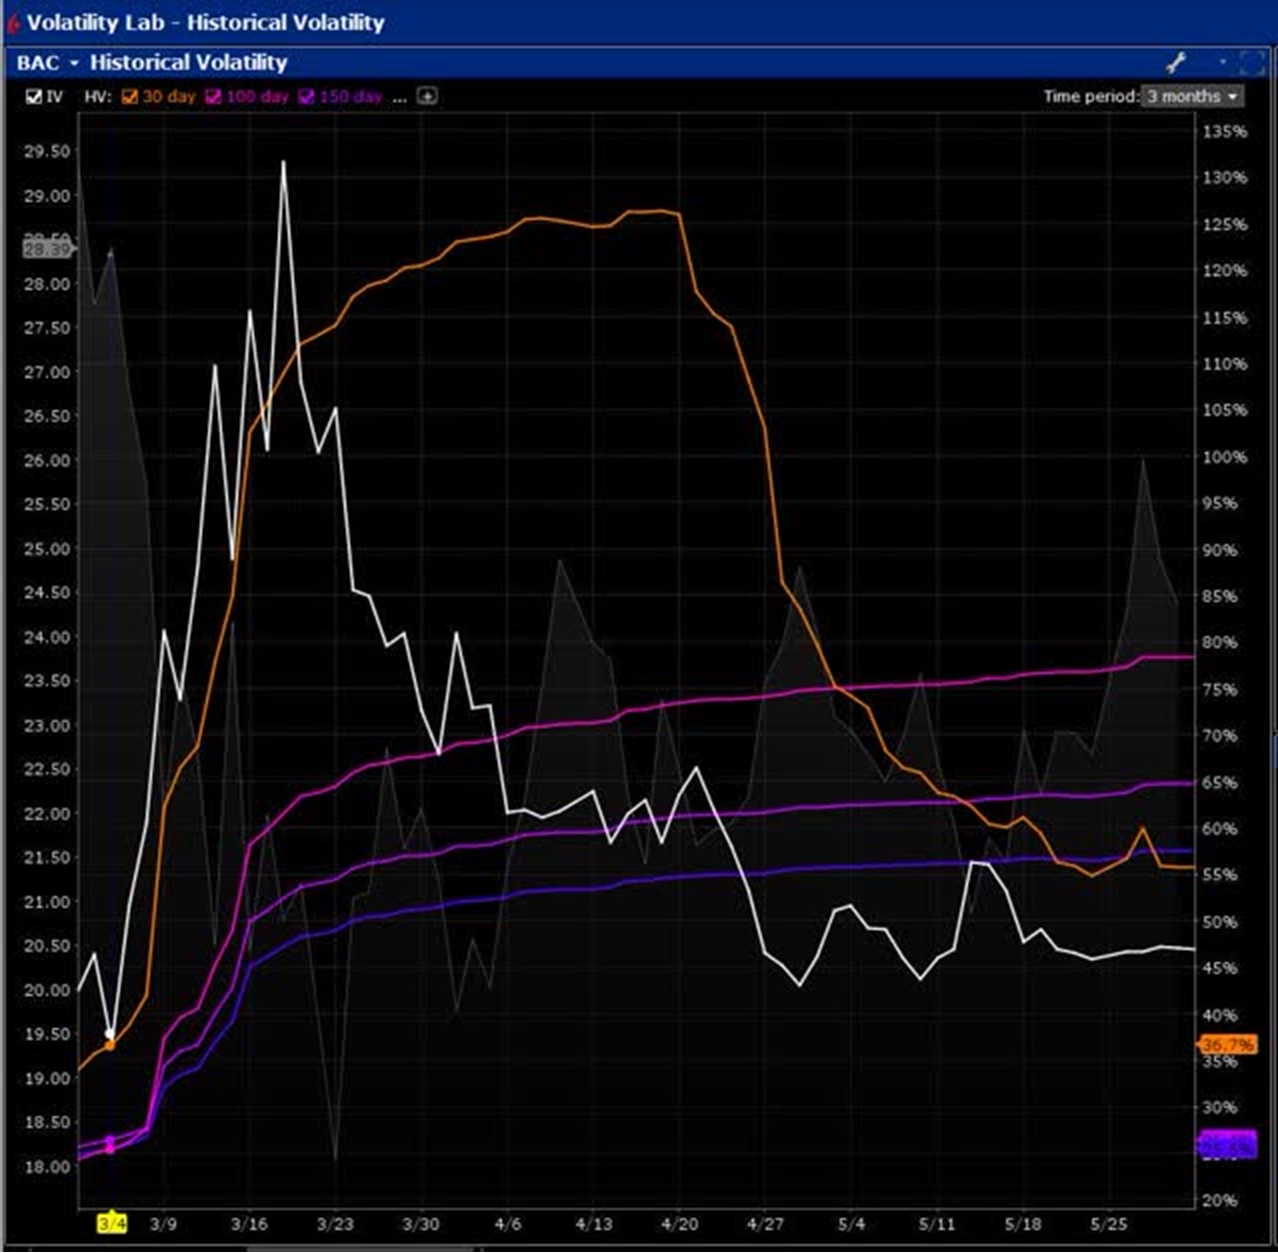
Another way to visualize the sentiment on BAC can be seen from the implied volatility levels over the past weeks.
(Source: Chart created by author with TWS from Interactive Brokers)
The white line in the chart represents the implied volatility for BAC, which is the volatility the stock is expected to face in the coming period. High IV levels are seen when investors are fearful. The implied volatility has full retraced back to its low levels pre-coronavirus.
Effect of COVID-19 on the fundamental value of BAC
Briefly summarized, the fundamental value of BAC is negatively impacted by the following two items:
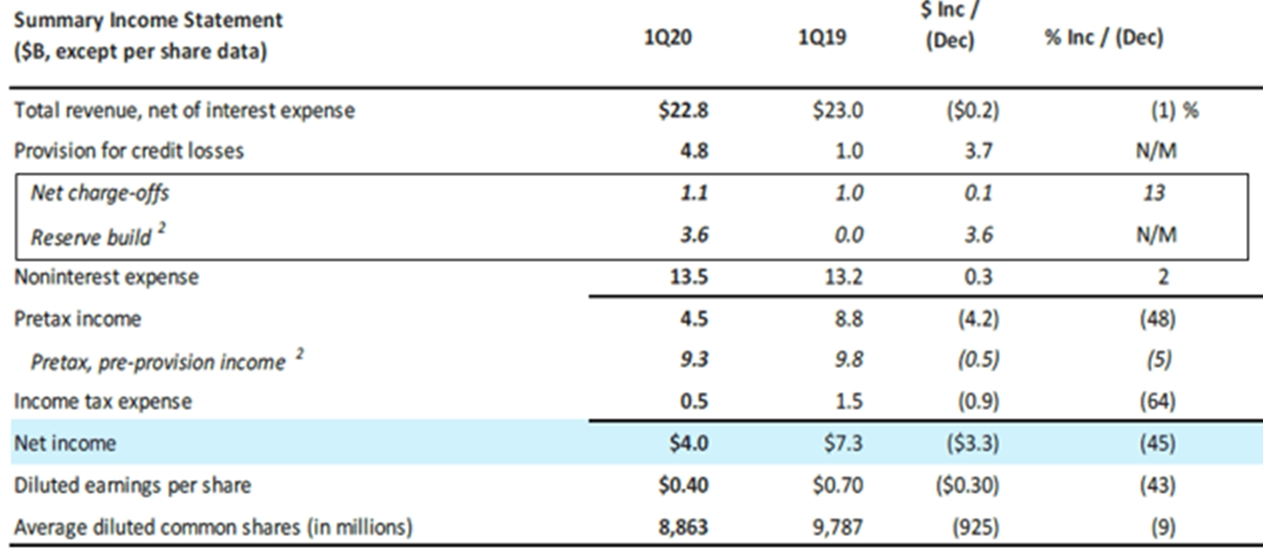
- Increase in Credit Provisions – The bank increased the provision for credit losses from $1 billion to $4.8 billion in Q1 2020 (compared with Q1 2019). This $4.8 billion provision consists of 2 parts:
- Net charge-offs of $1.1 billion (which is in line with the Q1 2019 figure)
- Reserve builds for $3.6 billion (no value was provisioned here back in Q1 2019.
Consequentially, the Net Income of BAC declined with 45% year over year, as the reserve builds consumed a major part of the total revenues, which were only 1% below the previous-year results.

(Source: Q1 2020 report from BAC Investor Relations website)
This decline in EPS had a strong impact on the profitability ratios for the quarter. Return on average assets and the return on equity were cut in half:
- Decline in Interest Rates – In reaction to the coronavirus, the Federal Reserve has lowered the target interest rate, which will have a negative impact on the interest income of BAC.
Taking these two negative impacts into consideration, we believe the impact on the bank’s fundamental value and earnings power will be limited in the future. The $3.6 reserve build-up during Q1 2020 is a one-time thing for which BAC is sufficiently capitalized to bear the impact. While the size of the reserve is considerable, we expect the impact to fade away in the years to come.
As for the impact of the lower interest rates, we need to consider only half of BAC’s income is originating from the interest income segment. Over the period from 2018-2019, the rate dropped as well by 75 basis points, which had only a limited impact on the net interest yield of BAC, which declined by 17 basis points.
The strong decline in stock price has an outspoken effect on the bank’s valuation multiples.
(Source: stockrow.com)
The P/E ratio, P/S ratio, and P/B ratio are all at the lowest level they have been in the last 6 quarters. We expect Bank of America to retrace to its previous valuation ratios as the earnings will pick up again.
Investment proposal with an improved risk-reward ratio
In order to benefit from a potential rise in BAC stock price, we would recommend purchasing call options on Bank of America. These call options require a low investment amount compared with common stocks and offer a similar profit profile.
More specifically, we would recommend purchasing the January 15, 2021 calls with a strike price of $25 for a premium of $264. This investment has the following characteristics:
- The purchaser of the call option will have a right to purchase 100 stocks of BAC at $25 at any time before January 15, 2021.
- The maximum loss is limited to the premium one has to pay to purchase the call options of $264. In extremis, if BAC would decline to $10, you would only lose $264.
The profit profile of these call options can be compared with the profit profile of a common stock purchase in BAC:
(Source: Created by the author using data from Yahoo Finance)
As you can see from the red line, the total loss of the call option investment is limited when we compare it with the total (potential) loss of common shares.
The price of the call options in any stock or commodity is mainly driven by the volatility of the underlying asset. Investors assume a certain volatility level will be applicable for the period to come – the implied volatility level – which will have a direct impact on the price of the call option. The higher the implied volatility, the higher the premium of the call options. As demonstrated by the graph in the first section of this article, we can see the implied volatility for BAC has decreased significantly in the previous weeks.
Risks of the trade
As always, we do want to ensure investors are fully aware of the risks which come with an investment in equities and derivatives.
Bank of America has recently gone through a volatile period, which has strongly lowered its market value. Once the volatility would return to the stock markets, for example, if a second COVID-19 wave would occur, we can expect BAC to decline lower.
We have looked at the impact of the credit provisions and the lower interest rates on the future earnings power of BAC. If the economy would go into a recession, we can expect these two factors to have a more severe impact on the earnings of BAC.
Another risk we would like to emphasize is the time period in which we anticipate the stock rise of BAC will occur. In order for the call option investment to be profitable, the stock price of BAC has to rise to the $27 level before mid-January 2021. Otherwise, the call options will expire worthlessly.
Disclosure: I am/we are long BAC. I wrote this article myself, and it expresses my own opinions. I am not receiving compensation for it (other than from Seeking Alpha). I have no business relationship with any company whose stock is mentioned in this article.
Why stocks could keep going higher even with massive unrest across America
PUBLISHED TUE, JUN 2 20204:37 PM EDTUPDATED TUE, JUN 2 20206:00 PM EDT
Patti Domm@IN/PATTI-DOMM-9224884/@PATTIDOMM
KEY POINTS
- Stocks continue to rally, even as many American cities remain under curfews and are bracing for continued protests.
- Analysts said the protests may be alarming, but they are not impacting the stock market, which remains fixated on the economy’s reopening.
- A big factor keeping the markets going is the trillions in stimulus from the Fed, other central banks and governments around the world.
The great rotation continues, with some of the most down-trodden names leading the market higher: industrials, airlines, financial institutions, and energy companies.
Powerful monetary and fiscal stimulus programs are keeping stocks aloft, as investors continue to shift funds to parts of the market they believe will be helped by economic reopenings.
So far, the market has not reacted to the violent protests that erupted all across the U.S. after the death of George Floyd in Minneapolis resulted in charges of third-degree murder against a police officer. Across the U.S., there has been looting on city streets and buildings have been destroyed, yet the stock market has ignored it.
“The market is a forward looking mechanism. They see six months from now, nine months from now there will be more semblance of order. The economy will be coming back, and earnings will be coming back. Estimates have stopped going down,” said Steven DeSanctis, Jefferies equity strategist. “You have the full support of the Fed … the flows into credit markets have been incredible. The capital markets are open. IPOs and secondary offerings are getting done.”
Since credit markets seized up in February, the Fed has created program after program to keep the credit markets moving, including more funding in short-term lending markets, Treasury purchases, a commercial paper facility, a municipal bond program, and a plan to buy corporate bonds. The Fed had already cut rates to zero, and has promised to do whatever else is needed, even as it ballooned its balance sheet to $7.1 trillion.
With the Fed in the market, companies have already issued more than $1 trillion in new debt at twice the pace of last year, and at relatively low rates. That has enabled corporate America to restructure existing debt and build cash hoards to weather the downturn. Amazon, for instance, priced $10 billion in new debt Monday, including a 3-year bond with a 0.4% yield.
“All of that outweighs what’s going on,” said Desanctis. “The big thing with social unrest is in two weeks from now, if we get an uptick int the virus and that delays openings, that is something that impacts markets.”
Lori Calvasina, chief U.S. equity strategist at RBC, said the protests could become an issue for stocks if they have a significant impact on consumer or business confidence, as the economy is reopening. The market has also been watching but mostly shaking off the growing tensions between the U.S. and China.
“We have a giant Fed cycle that looks like it’s never going to stop,” said Calvasina. “Is the Fed lift powerful enough to offset negative news? They acted with leadership and acted early and were aggressive. They did everything they could, and it’s helping. It may be just that simple.” The Fed is not alone, and analysts also point to global central banks including the European Central Bank, expected to expand its programs this week.
The unrest, which has resulted in damage in dozens of cities, has led some on Wall Street to draw parallels to 1968, a year of tumult. There were riots and protests in a divided America, and both civil rights leader Martin Luther King and Sen. Robert Kennedy, a presidential candidate, were assassinated. After a 9% drop for the S&P 500 from January to March, the market rallied 24% and ended 7.6% higher.
But Barry Knapp, managing partner at Ironsides Macroeconomics, said the better comparison could be 1958 or 1980. “In both those occasions, we had a very sharp, short recession. The reason for the recession was government policy in 1980. In that case it was [President Jimmy] Carter putting credit controls on the economy,” said Knapp. “ISM went from over 50 in February to 29 in May and then shot back up to 56 by the time the election came around. You had a sharp sell-off seven days longer than this one and the market just rallied right into the election.”
Both DeSanctis and Knapp said the market could be vulnerable to a shallow pullback, but the expect to continue to see a broadening of the rally and money flowing into the underperforming cyclicals.
The S&P 500 ended Tuesday up 1% at 3,080 and has rallied 40% from the March low. The XRT SPDR S&P Retail ETF was just barely higher at the close but it had been up 1.8% in early trading, even though retail establishments have been looted and many have protectively closed in protest areas. The iconic Herald Square Macy’s flagship store in New York City was looted Monday. DeSanctis said the sector will have insured losses on some stores.
Airline stocks were up 1.6% amid continued optimism that people will increase travel as the economy opens up more and more. They are up over 13% over the past month but down 52% for the year. Commercial banks were up 2.4%.
“It’s the beginning of a new business cycle. You shouldn’t get all beared up, and you’re not supposed to focus on valuations. This is the early stage of the business cycle,” said Knapp.
Small caps have also surged, along with the cyclicals. “The Russell is up 42% off the lows the cyclicals are up 40%…the big divergence this year was the fact this year was growth and the speculative stuff held up in the downturn,” said DeSanctis. “Usually, those are the stocks that go down in a downturn. … Health care is going to be the fix to the pandemic. These stocks have gotten a lot more interest.”
https://seekingalpha.com/article/4352024-baidu-inc-1q2020-results-beat-street-forecasts-wide-margin
Baidu Inc.: 1Q2020 Results Beat Street Forecasts By Wide Margin
Jun. 4, 2020 3:00 PM ET
Summary
Solid 1Q20 results way ahead of consensus forecasts.
Robust in-app traffic growth helped margin improvement.
Positive 2Q20 guidance implies a continued recovery underway.
Baidu delivered better-than-expected 1Q results, with revenue 3% above consensus and adjusted operating margin 12 percentage points higher than the Street forecasts, supported by the improving efficiency of Baidu’s own ecosystem and stringent cost control.
Despite revenue having been negatively impacted by COVID-19, other KPIs – such as average DAU, in-app search queries, feed time, etc., continued to show strong growth momentum, implying the effectiveness of Baidu’s ongoing efforts to enhance its mobile ecosystem and user experience through building Baijiahao, smart mini programs, and managed page.
Advertisers in various sectors are now in the different stages of business resumption, some of which are slightly slower than previously expected. Meanwhile, management guided that Baidu will focus on optimizing profit growth amid intensified industry competition and current difficult market conditions.
On the monetization side, as offline activities are rebounding, management observed a nice recovery trend in various sectors – such as healthcare, franchising, auto and logistics, etc. The midpoint of 2Q revenue guidance is flat yoy and 3% ahead of consensus. Within that, Baidu Core is on track to recover sequentially, on the gradual pick-up in the above-mentioned sectors, while iQiyi will be under pressure, due to limited visibility in brand ads.
On the margin side, 1Q margin was better than expected, especially for Baidu Core, due to: 1) disciplined sales & marketing spending, and 2) lower traffic acquisition costs. However, I still expect yoy adjusted operating margin deterioration for Baidu Core (from 25.5% in FY19 to 23.4% in FY20), given soft top-line growth and Baidu gradually increasing investment in content cost and promoting its Mobile Baidu app. As revenue recovers, I forecast a low-teen increase in total expenses (COGS and operating) sequentially for the rest of FY20. I view Baidu’s 2Q guidance as positive, and expect a further recovery in 2H, as the offline business gets fully back to normal. The successful transition to in-app search will also likely bring improvement on monetization.
With Baidu benefiting from its search-plus-feed dual-engine strategy, management is confident in Baidu’s near-term recovery, as well as its long-term growth, given that: 1) the enhanced Baidu mobile ecosystem leads to fast traffic growth, 2) user behavior is shifting from web search to in-app search, where the Baidu app has an advantage, and 3) SMEs are recovering at an encouraging pace, backed by supportive government policies.
Online marketing revenue was RMB14.2bn, down 19% yoy. Sectors including healthcare, travel, franchising and financial services were heavily hit during COVID-19, and Baidu expects healthcare, franchising, auto and logistics to recover quickly in the coming months. The growing momentum of CPM on the Baidu app since 2Q19 has been interrupted by the COVID-19 outbreak, but management has already seen the trend coming back.
I continue to see positive trends for the Baidu mobile ecosystem. As user behavior in China continues to shift from browser search to in-app search, Baidu apps became one of the fastest growing DAUs apps in February and March, even after the pandemic outbreak levelled off from the peak. Baidu app DAUs reached 222 million, up 28% yoy. In-app search users on Baidu app increased by 60% by the end of March, In-app queries grew 45% yoy and feed time spent was up 51% yoy.
Baidu took the pandemic outbreak as a chance to educate users on Baidu’s app features. Baijiahao accounts, Baidu smart mini-program, and managed pages make up the majority of Baidu’s mobile search results, leveraging Baidu’s information and knowledge centric capability and enabling Baidu to further expand into the mobile search space. With a search plus feed twin search engine, Baidu’s in-app search monetized better than the traditional browser searches and has successfully shifted user behavior from browser search to AI-powered In-app search by increasing user’s overall stickiness.
Specifically, the Baijiahao content network now hosts 3 million publisher accounts in 1Q20, up 44% yoy, the number of publishers providing original content increased 178% yoy in March. Baidu’s smart mini program also witnessed strong user growth with MAUs on Baidu’s apps reaching 354 million, increasing 96% yoy. The number of Baidu’s smart mini programs grew over 26x yoy and was up 35% sequentially in 1Q20. Also, Baidu managed page revenue takes up more than 20% of Baidu’s core marketing revenue. Rapid traffic growth, in turn, attracts content creators and developers to the Baidu mobile ecosystem, forming a virtuous circle.
Baidu Key Earnings Result Highlight:
Baidu reported 1Q20 total revenue of CNY22.5 billion, -7% Y⁄Y, 2.9% above Bloomberg consensus estimate of CNY21.9 billion.
– Marketing Revenues came in at CNY14.2 billion.
– Other Revenues were CNY8.3 billion.
Gross margin came in at 34.9% (versus 38.5% in 1Q19 and 46.3% in 4Q19), 2.8% higher than consensus estimate of 32%.
GAAP Operating margin was -1.9% (versus -3.9% in 1Q19 and 16.1% in 4Q19), versus consensus estimate of -4.9%.
Non-GAAP Net margin came in at 13.7% (versus 4.0% in 1Q19 and 31.8% in 4Q19), versus consensus estimate of 6.8%
Baidu Core total revenue came in at CNY15.3 billion (-13% yoy). Non-GAAP operating income was CNY3.3 billion (22% Non-GAAP operating margin).
Final Thought
Notwithstanding the company made positive progress on its mobile business, it is not clear yet as to who’s going to win mobile search business in China. Similar to the US, it is going to be a winner-takes-all market so the key point to monitor is if Baidu can grow its mobile business quickly and profitably enough to offset its declining web search business.
Disclosure: I/we have no positions in any stocks mentioned, and no plans to initiate any positions within the next 72 hours. I wrote this article myself, and it expresses my own opinions. I am not receiving compensation for it (other than from Seeking Alpha). I have no business relationship with any company whose stock is mentioned in this article.
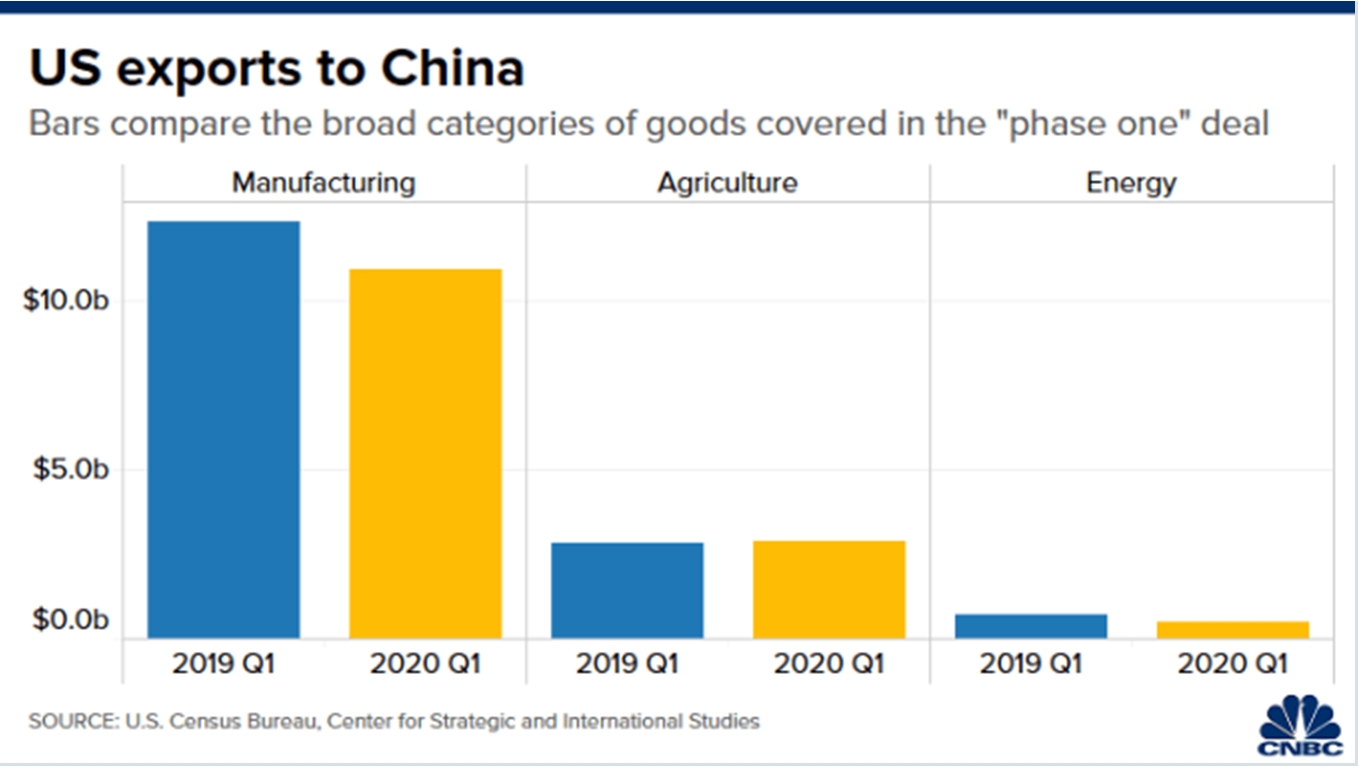
Morgan Stanley says the U.S. ‘will not want to break the phase one deal’ with China
PUBLISHED FRI, JUN 5 202012:41 AM EDT
KEY POINTS
- The U.S. “would be focused on economy right now and will not want to break the phase one deal,” said Chetan Ahya, Morgan Stanley’s chief economist and global head of economics.
- As such, the risk of a renewed U.S.-China tariff war hitting the global economy “is not likely to be happening in our forecast” for now, he added.
- S. President Donald Trump said last month he was “very torn” about whether to end the phase one deal — raising concerns that both countries would resume a damaging tariff fight.
- However, trade is not the only way that U.S.-China tensions could play out in the coming months, said Tommy Xie, head of Greater China research at Singaporean bank, OCBC.
The U.S. will not likely want to “break” its so-called phase one trade deal with China, even though tensions between the two countries have escalated in recent weeks, a Morgan Stanley economist said on Friday.
U.S. President Donald Trump said last month he was “very torn” about whether to end the phase one deal. His comments raised concerns among investors and analysts that the world’s two largest economies would resume a tariff war that’s damaging to the global economy.
“At this point, our view from an economics standpoint … is as long as we have the phase one deal going on and there is no renewed escalation in terms of tariffs, then the global growth projections that we have should be intact,” Chetan Ahya, Morgan Stanley’s chief economist and global head of economics, told CNBC’s “Squawk Box Asia.”
He explained that the Trump administration “would be focused on economy right now and will not want to break the phase one deal,” so the risk of a renewed U.S.-China trade war hitting the global economy “is not likely to be happening in our forecast.”
Trump has not updated his stance on the trade deal, which was signed in January and put a pause in the tariff fight with China that lasted over a year.
But U.S. Trade Representative Robert Lighthizer, one of the key negotiators in the trade deal with Beijing, reportedly said Thursday he felt “very good” about the deal and that “China has done a pretty good job” in some structural changes.
China last week also repeated that it will continue working toward implementing the phase one trade deal, even as experts have said that Beijing is not likely to meet the requirements to significantly increase its purchase of U.S. goods and services.
China has predictably fallen short of its commitments so far due to the coronavirus pandemic.
U.S.-China ‘hot spots’
Tommy Xie, head of Greater China research at Singaporean bank, OCBC, said the status of the phase one trade deal hinges on whether the Trump administration is willing to allow China more time to beef up its purchases of U.S. goods.
But trade is not the only way in which U.S.-China tensions could play out in the coming months, noted Xie. He added that frictions between the two countries have expanded into areas including technology, the financial markets and Beijing’s handling of the coronavirus pandemic.
“Last year, the key concern was on the trade front,” Xie told CNBC’s “Street Signs Asia” on Friday.
“But this year … we’re seeing more and more hot spots right now between the U.S. and China. That’s why I think in the near term, there’s more for the market to be concerned at the moment.”
Five charts that track the U.S. economy amid reopening progress
PUBLISHED SUN, JUN 7 20202:38 PM EDTUPDATED SUN, JUN 7 20204:00 PM EDT
KEY POINTS
- As states gradually reopen, the U.S. economy is showing signs of life after one of the most significant downturns in history.
As states move forward in their reopening progress, Americans have greater opportunity to eat out, shop and even travel. More people have also been able to work, with a record 2.5 million jobs added in May that helped unemployment drop to 13.3%.
This return to some semblance of normalcy has helped reignite an economy battered by the coronavirus. After one of the biggest economic and employment crises in history, the U.S. is beginning to bounce back.
These five charts track progress in the U.S. as its economy makes it way towards recovery.
Direction requests
With states opening businesses and lifting travel restrictions, consumers now have more places to go. Data from navigation app Apple Maps shows an upward trend in requests for driving and walking directions. However, with people continuing to work from home and wary of catching the virus on crowded train cars or buses, transit directions remain more than 50% below levels seen in January.

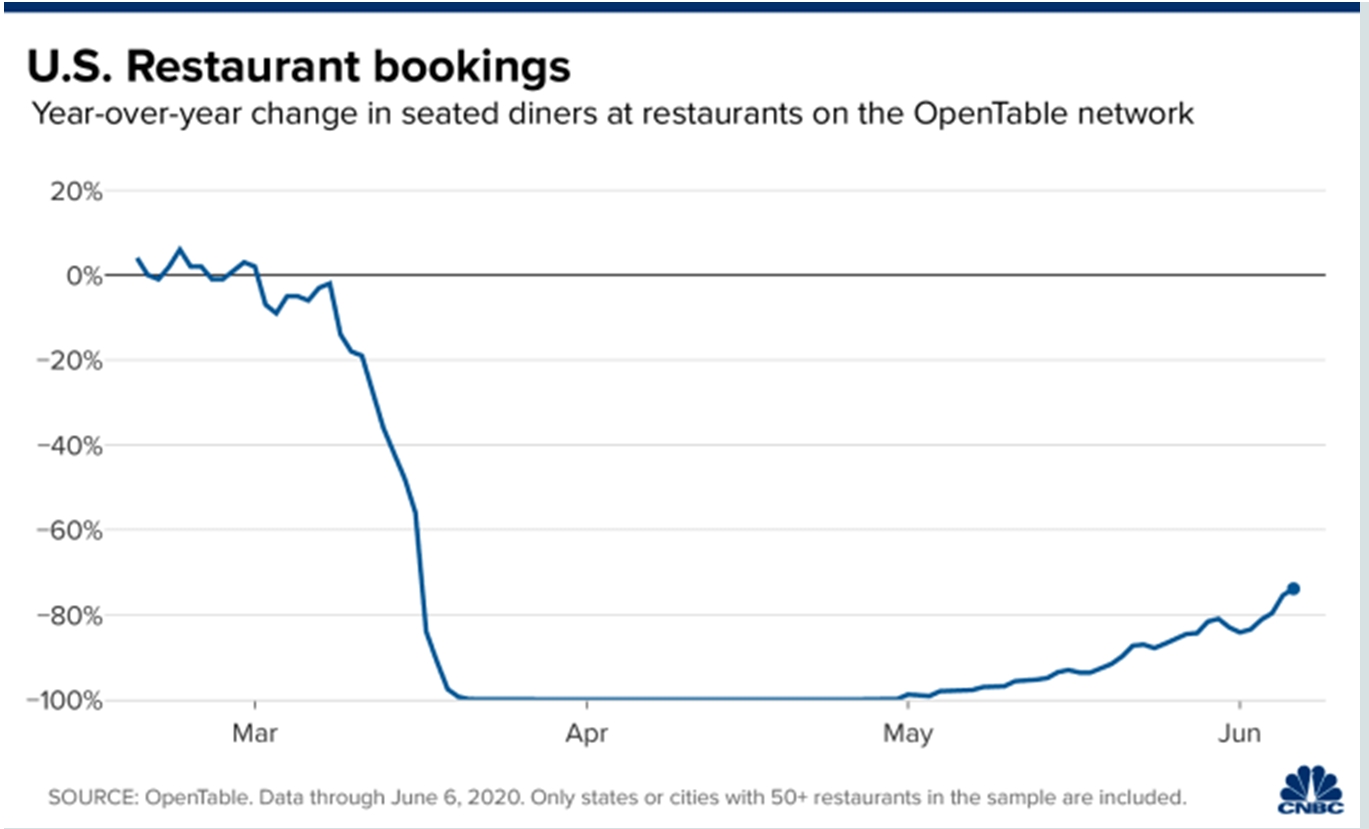
Restaurant bookings
Multiple states have allowed restaurants to resume indoor dining, so now customers are returning to booking sites and apps to make reservations. Restaurant bookings are now at 80% below their levels from last year, according to data from online reservation service OpenTable network. In the month of April, bookings were down 100% when compared to last year as most restaurants in the U.S. were restricted to takeout, curbside pickup and delivery orders.
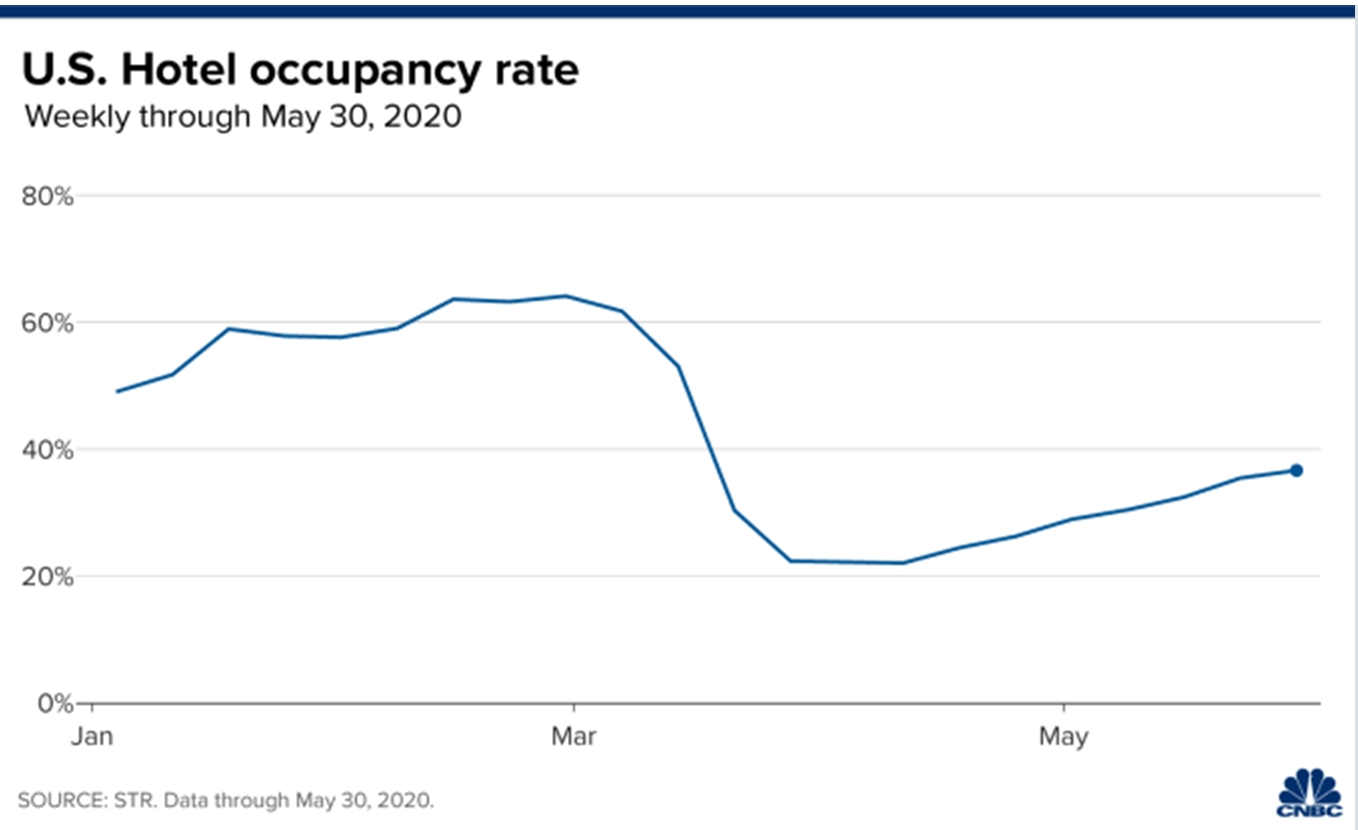
Hotel occupancy
Hotels have begun welcoming more guests as their occupancy rates near 40%, according to data from global hospitality research company STR. Top travel markets like New York City and Atlanta even had hotel occupancy rates above 40%. However, typically popular destinations like Oahu Island, Hawaii and Orlando, Florida reported low occupancy levels.
Air travel
Air travel is still struggling amid the pandemic based on the number of travelers passing through Transportation Security Administration checkpoints. Passenger numbers are have fallen more than 80% when compared to last year, but there are still slight increases in May and June ahead of the busy summer travel season.

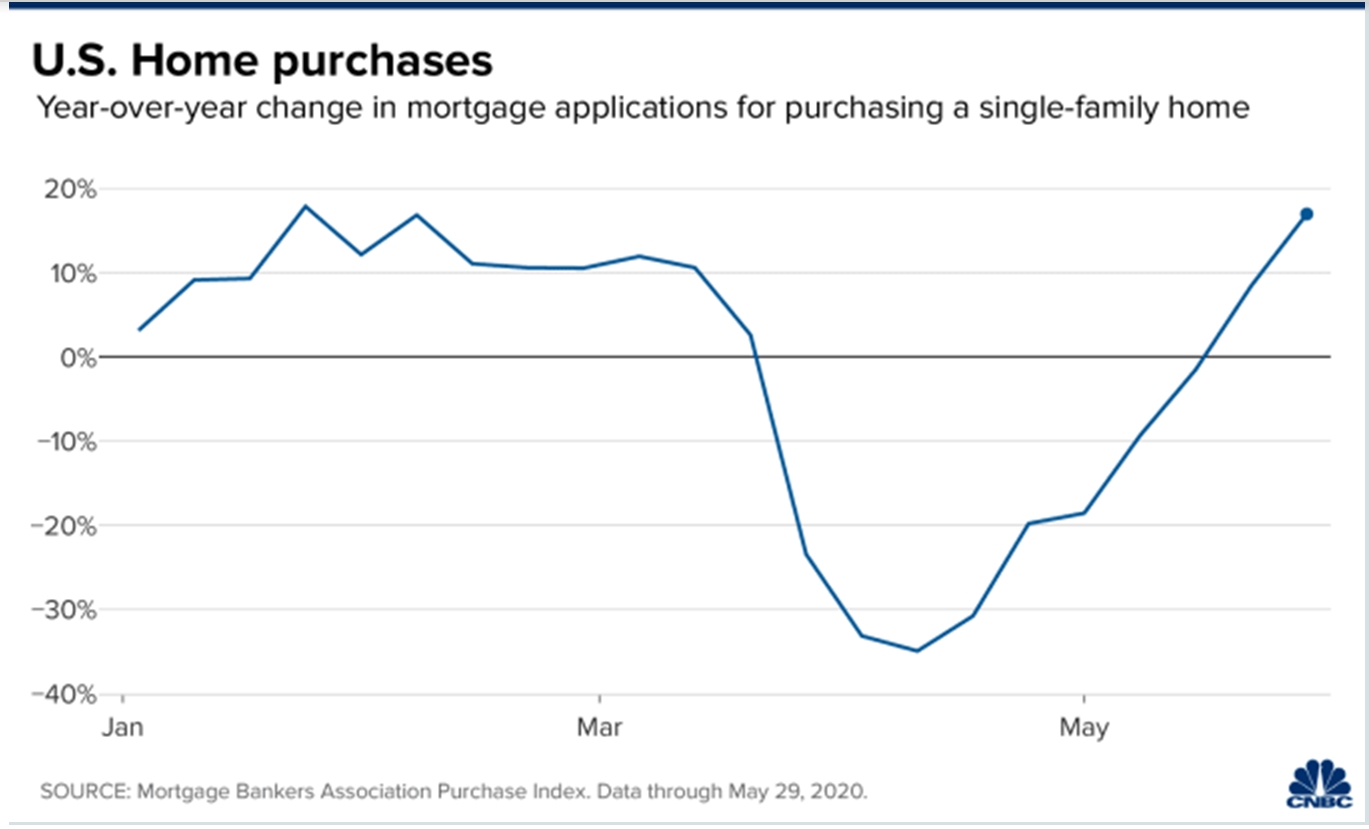
Home purchases
Recent boosts in mortgage applications for purchasing single-family homes could be attributed to pent-up demand, according to Joel Kan, associate vice president of Economics and Industry Forecasting at the Mortgage Bankers Association. The applications are up nearly 20% when compared to last year, according to data from the MBA. The recent increase might also signal a desire to move from crowded cities to spacious suburbs.
Senate proposal could provide as much as $10,000 per month to American families to weather coronavirus pandemic
PUBLISHED SAT, JUN 6 202010:45 AM EDTUPDATED SUN, JUN 7 20204:07 PM EDT
One generous proposal on Capitol Hill could put as much as $10,000 per month into American families’ hands to help them weather the coronavirus pandemic.
In some ways, it’s a nod to universal basic income, the concept of indefinitely providing people with a guaranteed amount of money per month. But the plan calls for providing the financial relief for only as long as the pandemic lasts.
The bill, named the Monthly Economic Crisis Support Act, was introduced in May by Sens. Kamala Harris, D-Calif.; Bernie Sanders, I-Vt.; and Ed Markey, D-Mass.
It calls for sending $2,000 per month to individuals and $4,000 to couples, as well as $2,000 per child for up to three children. Those earning under $120,000 would be eligible for support, though the payments would be reduced for income over $100,000.
More from Invest in You:
Private equity investments could be on tap for your 401(k)
This is what happens to your 401(k) when you’re laid off
Coronavirus pandemic is a ‘defining moment’ for Gen Z
This week, Harris accepted a Change.org petition signed by 1.2 million individuals in support of the idea. The senator said she plans to circulate the petition in a “Dear Colleague” letter with other Capitol Hill lawmakers.
The bill is just one proposal that has been floated to help cover Americans’ expenses and get them back on their feet amid a widespread economic shutdown. But some critics say it would be too expensive.
Harris addressed the high level of spending the proposal would require this week in a webcast hosted by The Appeal, a news website.
“One of the things, first of all, that I find tiring is those who want to suggest, ‘Oh, this is a lot of money,’ when they’re the same people who passed a tax bill benefiting the top 1% and the biggest corporations of America and are going to cause us to face a $1 trillion deficit as a result of it,” Harris said.
The idea of giving Americans a steady monthly income is not a new one.
The idea was included in Andrew Yang’s presidential campaign, and is a strategy he continues to push.
“Our problems have accelerated, where we’ve experienced 10 years’ worth of displacement in 10 weeks,” Yang said in an appearance during The Appeal’s webcast. “But we have a real chance here to alleviate poverty.”
Many people were already struggling to pay their bills before the coronavirus pandemic hit, noted Elaine Maag, senior research associate at the Urban Institute. Research from the Federal Reserve has shown that many Americans would be thrown off by an unexpected $400 expense.
Some features of the new Senate plan could help address those problems, Maag said.
The bill includes people who are both low- and middle-income, applies to everyone living in the U.S. and could give people more confidence that the government is there to support them.
“The notion that we could have our economy collapse or put on pause and not cause great harm is just not imaginable,” Maag said. “It makes sense to me that the government would step in with some program to try to provide for people’s basic needs.”
But the Democratic lawmakers might have a difficult time passing it, as there is not “a lot of enthusiasm from their colleagues on the right,” Maag said.
One reason for that could be that the plan is perceived as too generous.
“It’s just an order of magnitude that for many households is not called for in the current situation,” said Shai Akabas, director of economic policy at the Bipartisan Policy Center.
Those making $120,000 or less account for 90% of workers, said Melissa S. Kearney, professor of economics at the University of Maryland. “That’s not really targeted,” she said.
Meanwhile, recent Federal Reserve data have shown that 40% of people with less than $40,000 in income have lost jobs during the pandemic.
We need to be targeting the money.
Melissa S. Kearney
PROFESSOR OF ECONOMICS AT THE UNIVERSITY OF MARYLAND
“I think that bolsters the case that we should be targeting cash resources to lower-income households,” Kearney said.
One idea, she said, would be to send households making less than $50,000 a $4,000 payment, with phase-outs for incomes on the cusp of that threshold.
That would have a higher chance of helping families who can no longer afford rent or groceries, rather than those who can no longer pay for certain luxuries, Kearney said. “We need to be targeting the money,” she said.
Other proposals that lawmakers are also considering include sending Americans another round of $1,200 checks or extending the extra $600 per week in unemployment benefits into next January.
Disclosure: NBCUniversal and Comcast Ventures are investors in Acorns.
All of a sudden, people are talking about a V-shaped recovery again: ‘The stock market had it right’
PUBLISHED SAT, JUN 6 20208:48 AM EDTUPDATED SUN, JUN 7 202010:28 AM EDT
Jeff Cox@JEFF.COX.7528@JEFFCOXCNBCCOM
KEY POINTS
- May’s shocking increase in jobs has given way to some talk again about a V-shaped recovery.
- Wall Street economists had been looking for the highest unemployment rate since the Great Depression era. Instead, the U.S. saw its biggest one-month job gain ever.
- RBC economist Tom Porcelli said June’s payrolls report could see a gain approaching 10 million.
- “The stock market had it right the whole time,” said Mitchell Goldberg, head of ClientFirst Strategy.
An astonishing pickup in payrolls during May has rekindled hopes that the economic slump may not be nearly as bad as it looked and could soon give way to an exodus of workers back to their jobs and a sharp broader recovery.
Where Wall Street economists were looking for a nonfarm payrolls loss of around 8 million, the month actually saw a gain of 2.5 million. The estimated unemployment rate was 19.5%, which would have been the nation’s worst since the Great Depression era. Instead, the number came in at 13.3% which is still well clear of anything the U.S. has seen since World War II, but far better than the worst doom-and-gloom estimates.
Friday’s “report marks the beginning of the labor market recovery in our view, and we expect the unemployment rate to fall further in June,” Jan Hatzius, chief economist at Goldman Sachs, said in a note. Hatzius added that Goldman is reviewing its projections for unemployment, which it had anticipated topping out at 15% this year.
Hatzius had been looking for a decline of 7.25 million from May, but he was far from alone in whiffing on the jobs picture. Now, economists are looking at a completely different picture and starting to see an entirely different jobs market from the one eviscerated by the coronavirus.
The data now “suggests May job gains are only the beginning here,” said Tom Porcelli, chief U.S. economist at RBC Capital Markets. “The recovery path there suggests a June payroll print at north of 10 million is a reasonable starting point for the conversation.”
If that number is anywhere accurate, it would suggest a staggering turnaround and get economists talking again about a possible V-shaped recovery off what is potentially the shortest recession in U.S. history. Ryan Detrick, senior market strategist at LPL Financial, wondered in a tweet whether “the recession [lasted] only two months.”
Something to consider here.
The 2.5 million jobs created in May was the most ever.
Looking at the previous 400 largest monthly jobs gains ever, the economy was never in a recession for any of them.
So did the recession last only two months?
If that’s the case, and the jobs market and perhaps the broader economy see a V recovery, a three-headed bull is likely the cause and will help justify the stock market’s stubborn resolve.
First, government funding helped mitigate a wave of layoffs that otherwise would have come with stay-at-home orders related to the coronavirus. Then, states and cities reopened more quickly than anticipated. Finally, the U.S. economy, which seemed to wobble even before the shutdown, showed a sense of resilience that gave still another boost to an uncanny Wall Street rally that seemed to defy fundamentals.
“The stock market had it right the whole time,” said Mitchell Goldberg, head of ClientFirst Strategy. “The stock market had a record plunge from a peak into a bear market and it had a record exit, which just reinforced the V-shaped narrative.”
Good news, but lots of work ahead
Friday’s nonfarm payrolls report is quite likely the biggest surprise relative to expectations that the market has ever seen.
To be sure, though, May is just one month, and the data was noisy.
The Bureau of Labor Statistics noted continuing counting discrepancies where workers were considered employed but not at work for “other reasons.” Including them as unemployed would have pushed the jobless rate up to 16.4%, though doing so also would have driven April’s 14.7% up by even more as well and made May look like a bigger drop.
The job gains also represent just a fraction of those lost. With social distance guidelines remaining in place even at a modified level, the pace of rehires is uncertain.
But there are positive economic signals coming from beyond the jobs market.
Housing purchases and vehicle sales are two strong bellwether signals that showed significant improvement in data released earlier this week. The Citi Economic Surprise Index, which measures data compared to estimates, went positive Wednesday and is now at its highest level in two months, shortly after the economic shutdown.
That’s part of a growing positive feel among employers and job seekers, according to Amy Glaser, senior vice president at Adecco USA, a leading recruitment and workforce solutions firm.
“We saw the rock bottom about five weeks ago then we saw a steady increase week over week up until this week,” Glaser said. “We’ve seen an explosion in activity, which is very encouraging and very exciting.”
Government loan program looms large
Getting organic job growth will be particularly important as the Payroll Protection Program, which provided money to companies in exchange for keeping workers on payroll, runs its course. Pending a signature from President Donald Trump, the terms of the PPP loans will be extended, though not beyond the end of 2020.
The program, which also provides extended unemployment benefits, has pushed $800 billion “out the door,” according to estimates from Krishna Guha, head of global policy and central bank strategy for Evercore ISI. The Treasury Department said earlier this week that some $267 billion alone has been disbursed through payments to individuals and households.
And none of that counts the help from the Federal Reserve, which slashed interest rates and has provided liquidity and loans in programs that could stretch into trillions of dollars.
Guha estimates that PPP borrowers account for 50 million jobs, so if even a fraction of those are preserved, the program would provide a substantial boost to employment.
“If the jobs surprise is being driven by one-time payments like one-time stimulus checks, then the impulse will be gone over the next couple of months and employment gains may slow again (or even decline if fiscal cliffs result in a sudden stop to income support),” Guha said. “If instead we are in the early phases of a more sustained recovery of consumption potentially supported by more extended fiscal support under a future stimulus four, the rehiring effects of PPP might prove more durable.”
For the markets, a rally that saw the Dow Jones Industrial Average gain as much as 1,000 points Friday remains in the balance.
Amid a global downturn that is likely to see second-quarter gross domestic product fall 40% or more, with nearly 21 million people still on the unemployment line, the market has been beyond resilient. The S&P 500 is edging towards positive territory for the year.
“Equity markets are always anticipatory mechanisms. Investors are always looking down the road 12 months, 18 months later. The rally we’ve seen was the market anticipating a rebound maybe not all way to previous levels, but at least a recovery in activity,” said Scott Clemons, chief investment strategist at Brown Brothers Harriman. “That seems to be coming more quickly than what anybody anticipated.”
HI Financial Services Mid-Week 06-24-2014