
HI Market View Commentary 04-27-2020
| Market Recap |
| WEEK OF APR. 20 THROUGH APR. 24, 2020 |
| After two weeks of gaining ground, the S&P 500 index closed lower last week as hopes for a quick route to a vaccine for COVID-19 were extinguished and the first big wave of earnings results were muted by another unemployment report that saw claims top 26 million over the last five weeks.
The index was down 1.3% from the prior week’s close. The benchmark average closed the week at 2,836.74, down from last week’s close of 2,874.56. Amid the ongoing coronavirus crisis, Wall Street continued to digest a deluge of quarterly results with heavyweights IBM (IBM), Netflix (NFLX) and Intel (INTC) all reporting, as well as economic data on the housing market and manufacturing sector, all of which underscored the debilitating impact COVID-19 is having on the US economy. Volatility plagued the oil market this week as Brent crude was overwhelmed by lingering oversupply worries. The commodity regained its footing and recouped nearly half its earlier losses after US President Donald Trump directed the US Navy to engage Iranian gunboats in the Persian Gulf, along with Treasury Secretary Steven Mnuchin’s recommendation to support the oil industry. The reversal helped prop up the energy sector by nearly 2% this week, making it the only sector of the S&P to close with a gain. Leading the way was Apache (APA) with a 25.9% gain, followed by Halliburton (HAL) which closed the week up 16.9% thanks to a five-day winning streak. Real estate and utility stocks were weighed down by persistently low interest rates and signs of stress on the housing market. These sectors both lost roughly 4% from last Friday’s close with Welltower Inc (WELL) and Consolidated Edison (ED) the laggards in their respective sectors, down 10.3% and 7.7%, respectively. Pressured by losses in the insurance business, the financial sector was lower by 3% this week. Of the 10 stocks that suffered the heaviest losses this week in the financial sector, all but two were in the insurance industry with WR Berkley (WRB) the laggard among the group, down 12% for the week. Technology was unable to stay insulated from the economic-fallout from COVID-19, edging down with a loss of just under 1% with gainers nearly matched by the number of shares in the sector closing in the red. Paycom Software (PAYC) took the top spot among leaders, while on the opposite end, Fortinet (FTNT) lost 8.6% this week. Industrials were down 2.4% for the week. Travel restrictions continued to undermine airline stocks as United Airlines (UAL) and American Airlines (AAL) were at the bottom of the pack. |
My Vanguard Experience today !!1 = Vanguard Mid-Cap ETF
That 2.5% for doing something for you during down markets is a freaking STEAL !!!!!!
Man is it scary to buy into a falling market but that’s where collar trading forces you to buy low (and yes it can go lower)
Are you paralyzed by 24 million people losing jobs, return of the virus in the fall, states going bankrupt, Nasdaq in an uptrend and other indexes are not, social distancing, seeing a portfolio lose 35-40%?
Are you using patience and prudence in your personal investing? IF not why not?
Should you always stick to collar trading ? NO
Let’s Look at Earnings and V
Where will our markets end this week?
Lower
DJIA – Bullish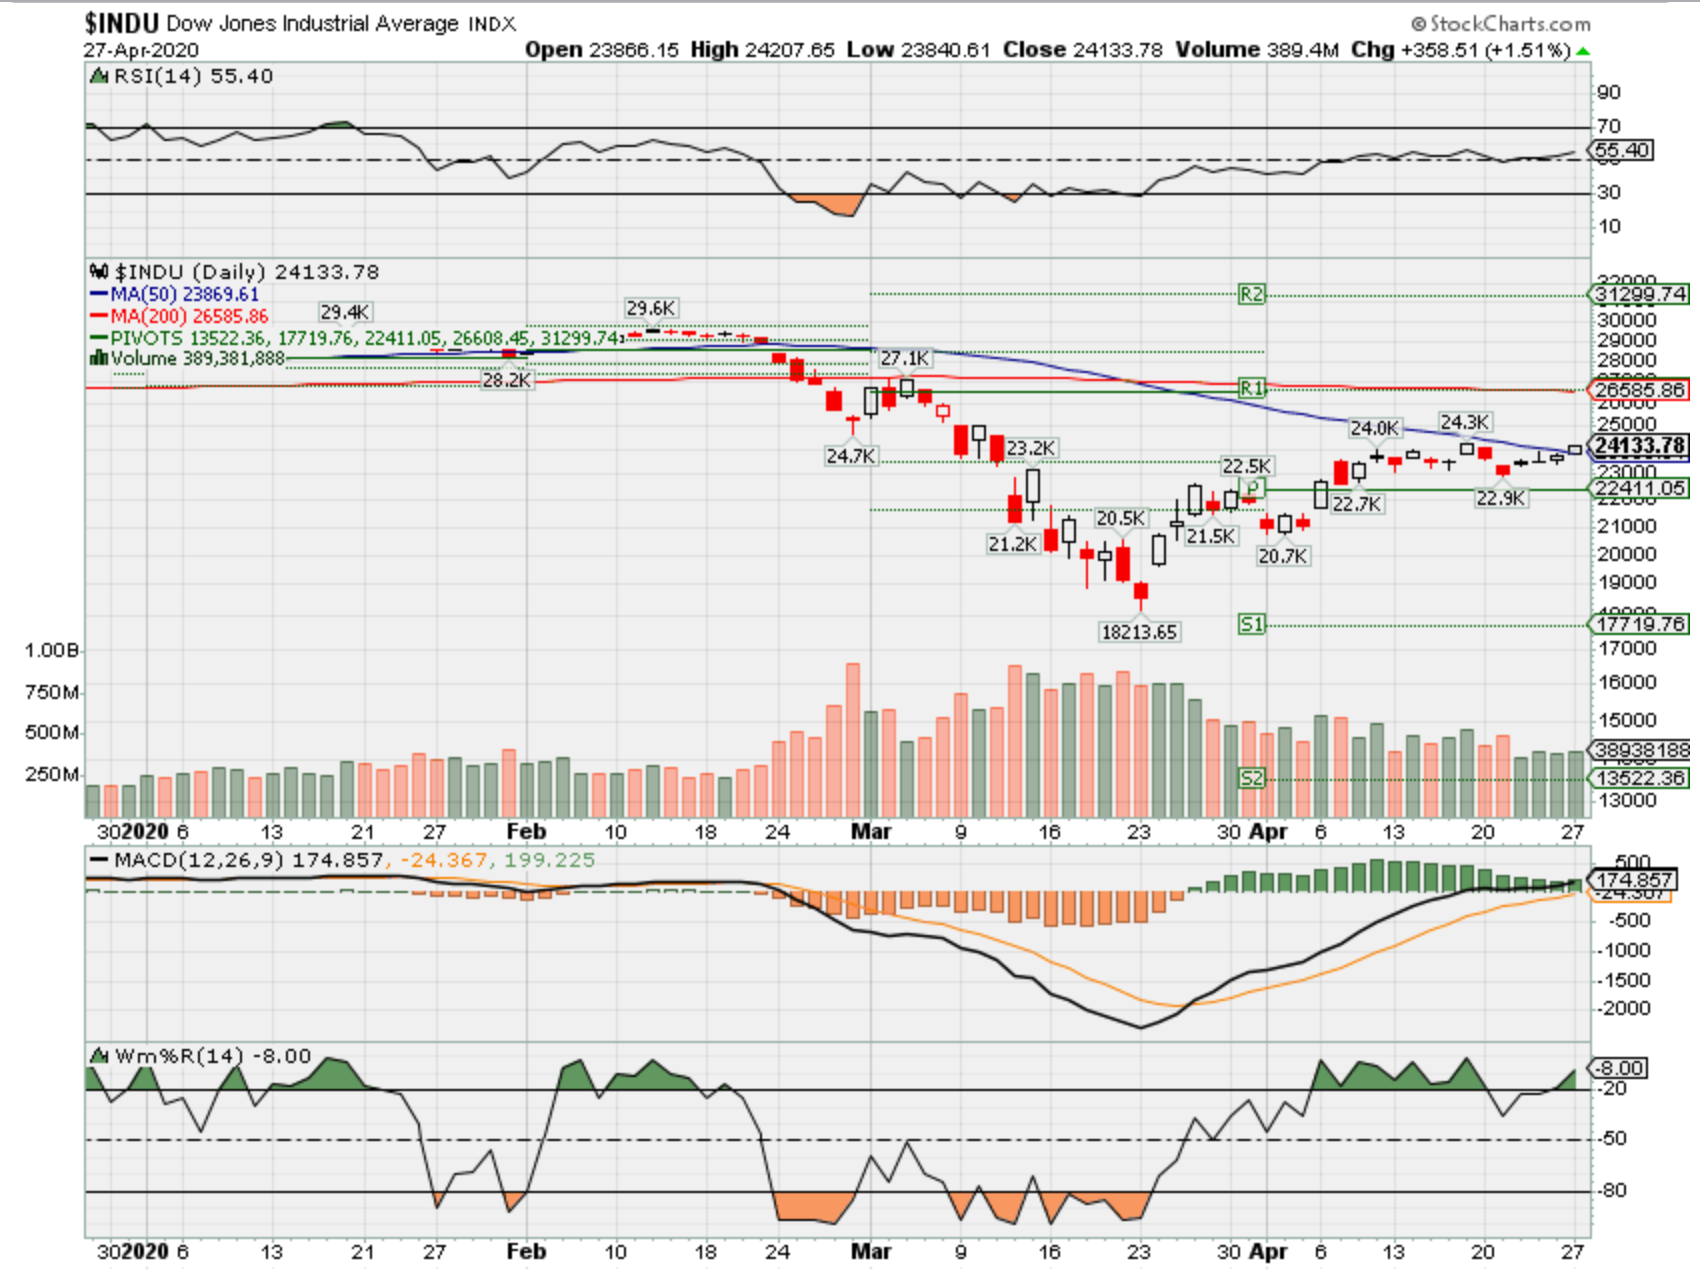
SPX – Bullish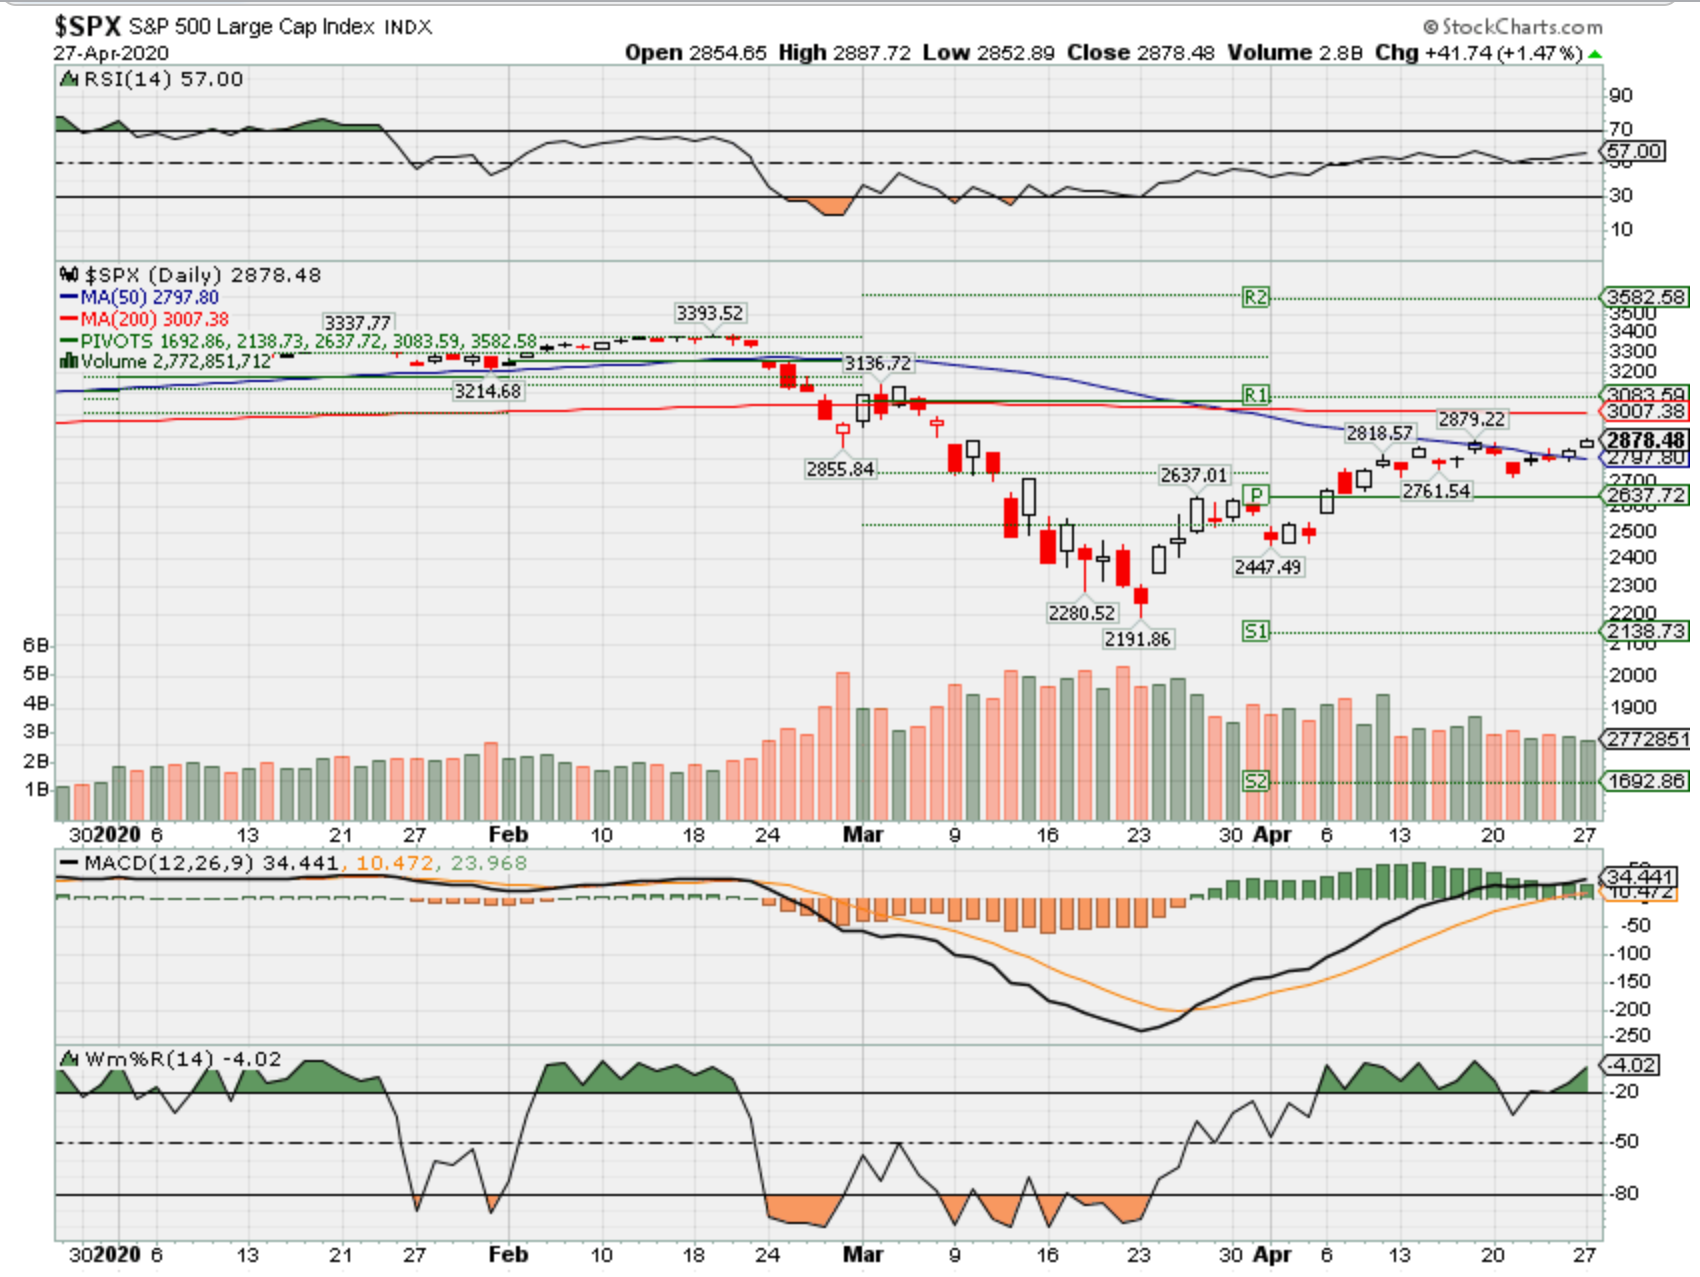
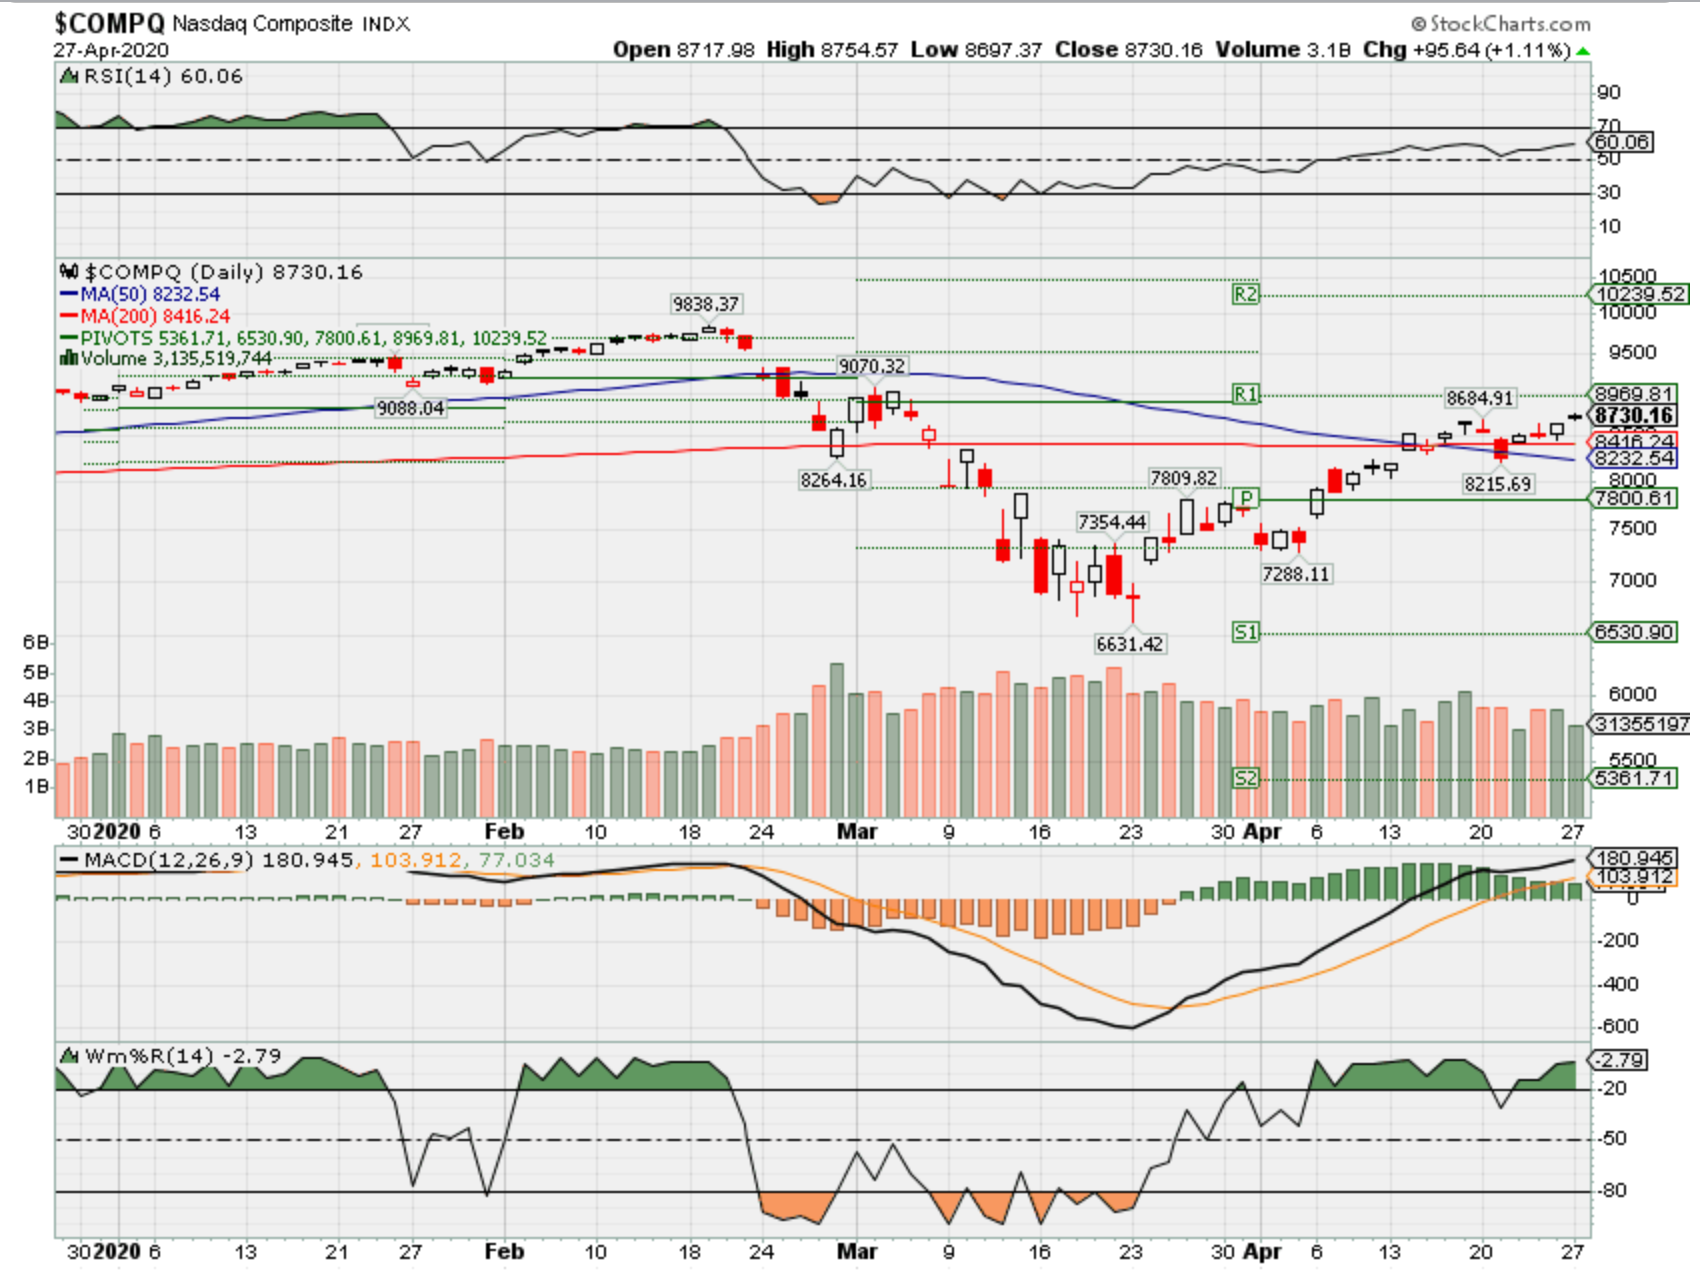
COMP – Bullish
Where Will the SPX end May 2020?
04-27-2020 +2.0%
Earnings:
Mon: FFIV, KDP
Tues: MMM, BP, CAT, GLW, CMI, DHI, HOG, MRK, PEP, PFE, LUV, UPS, AKAM, GOOG, JNPR, YUMC, F, SBUX
Wed: CCL, GRMN, GD, GE, HAS, HUM, MA, VLO, YUM, CREE, EBAY, MSFT, QCOM, TSLA, RIG, BA, FB,
Thur: MO, AAL, CI, COP, DOW, K, KHC, MCD, TPR, AMZN, AMGN, LOCO, FSLR, GILD, MNST, PSA, X, UAL, WDC, TAP, V, AAPL
Fri: CLX, LL, EL, XOM, HON, JCI, PSX, CVX
Econ Reports:
Mon:
Tues: S&P Case Shiller, Consumer Confidence
Wed: MBA, GDP, GDP Deflator, Pending Homes Sales, FOMC Rate Decision
Thur: Initial Claims, Continuing Claims, Employment Cost Index, PCE Prices, Chicago PMI, Personal Income, Personal Spending
Fri: Auto, Truck, Construction Spending, ISM Manufacturing
Int’l:
Mon –
Tues –
Wed –
Thursday –
Friday-
Sunday –
How am I looking to trade?
I’m protecting through earnings, rolling long puts up and out and I wouldn’t think of not having protection on during an earnings season that so far has no forgiveness.
I can and might be adding short calls after earnings for a little extra credit
www.myhurleyinvestment.com = Blogsite
customerservice@hurleyinvestments.com = Email
Questions???
PREDICTING THE FUTURE
Posted April 23, 2020 by TOMMY MAYES
Approximate reading time: less than 3 minutes

When something happens that has never happened before, do we assert it was unpredictable? On Monday the front month contract for WTI crude oil went negative in price and traded there, as holders were attempting to get rid of the obligation to take delivery.
How much can I pay you to take my oil? Amazing. Times like this challenge everything we think we know about the financial world and beg the question, ‘can anyone really predict the future value of any asset?’ What is the truth? I think the answer is up to the reader, but we believe that no one really can.
Read on.
‘BUT IT’S NEVER HAPPENED BEFORE!’
It’s a common refrain in the same genre as ‘this time is different’ and ‘history repeats itself’. A CEO will defend strategy while being challenged by an analyst, both of whom believe with integrity that they are reading the future correctly.
The market does not care that something has never happened before.
Neither do we. And we therefore believe the only information of clear value is the price of an asset as determined daily by each respective market.
HISTORY DOES HAVE A STORY TO TELL
As has been said many times before, a picture says a trillion words (the modern version anyway). The 120 years of Dow History picture below presents a story that during many periods of challenging financial conditions, the value of the market has not only recovered but moved on to higher prices. And history tells us our broad stock market reveals a picture a of entrepreneurship, productivity and ingenuity. It illustrates a powerful free-market economy and the blessings enjoyed as a citizen of this great country of ours. But it does not predict the future!
In fact, consider what this chart tracks. Not earnings, interest rates or cash flows, but literally the simplest data point you can find – PRICE. It is the closing price of the DOW over the last 120 years.
WHY PRICE MATTERS
As my partner Jon says, “the price of an asset at the close of a day turns what was into what is”. And the trend of the price of any asset gives us clues about what direction it is headed. Note that I did not say price predicts direction, but it offers clues.
So back to what has never happened – it has now happened. Oil has cratered. What do we know? We know that tracking the price trend over any number of time frames would have suggested a downtrend early in February and indicated an investor might do well to sell or short the commodity.
AVOIDING CATASTROPHIC LOSSES
Simply tracking the price would have allowed a glimpse into the future. Not in the future direction of prices, but in your reaction to them at various levels. Hindsight is always 20/20, and in this case the trend could have easily reversed itself. But the fact is no one knows the future, and a catastrophic loss requires an asymmetric result to regain the prior value. Stepping aside based on the price trend allows investors at least the opportunity to maintain buying power and increase the potential for future compounding.
WHAT IS THE REAL TRUTH?
Attempting to predict the future is just short of a fool’s errand. I say that with great respect to all the brilliant people that attempt to predict market outcomes. But after 30+ years in this business I am convinced now more than ever that only once in a while can a market prognosticator get it exactly right.
Tracking an asset’s price will not get it exactly right either, but it will consistently tell you the truth.
From the team – As we continue to address this terrible virus as a nation of neighbors, we hope that you and your families are all safe and healthy. We are grateful for the relationships we have with you all. Blessings, The Blueprint Team
https://tickertape.tdameritrade.com/market-news/boeing-earnings-preview-737-max-coronavirus-18068
More Clouds Likely Ahead for Boeing as Customer Demand Seen Diving Amid Crisis
2:51pm ET 4/24/2020 5 min read
Things were already shaky for Boeing (BA) when it couldn’t supply the aircraft its customers needed. Now the situation is arguably even worse because customers might not need more planes for the time being.
There’s still no real insight into when BA can get its beleaguered 737 Max jet back into the sky as the company prepares to report Q1 earnings on April 29. Even once the plane gets off the ground, no one knows if airlines will have recovered enough to make new orders.
Only 10,000 commercial aircraft remain in service—less than 40% of the global fleet. Also, only 102,000 people passed through TSA checkpoints at U.S. airlines on one day in mid-April, down almost 96% year over year, Barron’s reported. Passenger revenue losses for the airlines could reach as high as $115 billion internationally in the first half of 2020, the International Civil Aviation Organization said earlier this month.
Airlines’ troubles were underscored on April 20 when United Airlines (UAL) said it had posted a preliminary loss of $2.1 billion in Q1 and would need more federal help.
“The challenge that lies ahead for United is bigger than any we have faced in our proud 94-year history,” CEO Oscar Munoz and President J. Scott Kirby said in a recent letter to employees.
UAL plans a revamped schedule that will reduce its capacity to about 10% of what had been planned for May at the beginning of this year, and a similar reduction in June, Munoz and Kirby wrote, adding they don’t expect demand to bounce back quickly even when the crisis fades.
Relief Not Guaranteed if Crisis Ebbs
You could say BA has suffered from the crisis like almost everyone else, but at least many large companies outside the travel industry can plan to quickly ramp up and meet customer demand once it returns. BA can’t necessarily do that even once airlines start to recover. It all depends on getting the OK from regulators around the world.
It’s hard to disagree with Barron’s when it says that BA’s earnings on April 29 will be, “Frankly, dreadful.” You could pick other negative adjectives for Q1, but BA is probably going to be more focused on the future.
In one sense, however, the pressure comes off a little for BA. Now that no one is really flying, airline customers likely don’t miss the absence of the grounded 737 Max fleet as much, giving BA time to continue its remediation plans without the pressure of customers barking quite as loudly.
One sign of problems for aircraft makers beyond BA’s grounded fleet was an announcement recently by Airbus—BA’s chief competitor—that it’s cutting production of the Max’s chief rival, the A320, to 40 a month, down from about 60 pre-crisis. Airbus said the company was working on “operational and financial mitigation measures to face reality” amid the coronavirus pandemic, including slashing spending and cutting costs at its plants, The Wall Street Journal reported.
Unlike Airbus, BA hasn’t talked about its plans for possible long-term production rate cuts due to the crisis.
“The airline industry is confronting the COVID-19 pandemic and the unprecedented impacts on air travel,” BA said in a recent press release. “We are working closely with our customers, many of whom are facing significant financial pressures, to review their fleet plans and make adjustments where appropriate. At the same time, Boeing continues to adjust its order book to adapt to lower-than-planned 737 Max production in the near term.”
737 Max Cancellations Pick Up Steam
BA is trying to win Federal Aviation Administration (FAA) approval to return about 800 Max jets to service, after two deadly crashes blamed in part on the plane’s flight-control systems. However, some airlines have begun canceling previous orders as the situation goes into its second year. It was March 2019 when the planes last flew commercially.
The cancellations began even before the pandemic really sank in. For instance, several customers, including Air Canada, canceled orders for the Max back in February, according to FlightGlobal, an aerospace newsletter.
BA limps into Q1 earnings season with shares recently suffering a massive hit, falling from around $300 earlier this year to below $100 at one point before rebounding slightly (see chart below). Analysts expect the company’s Q1 revenue to be down roughly $10 billion from the approximately $28 billion it recorded in the same quarter last year.
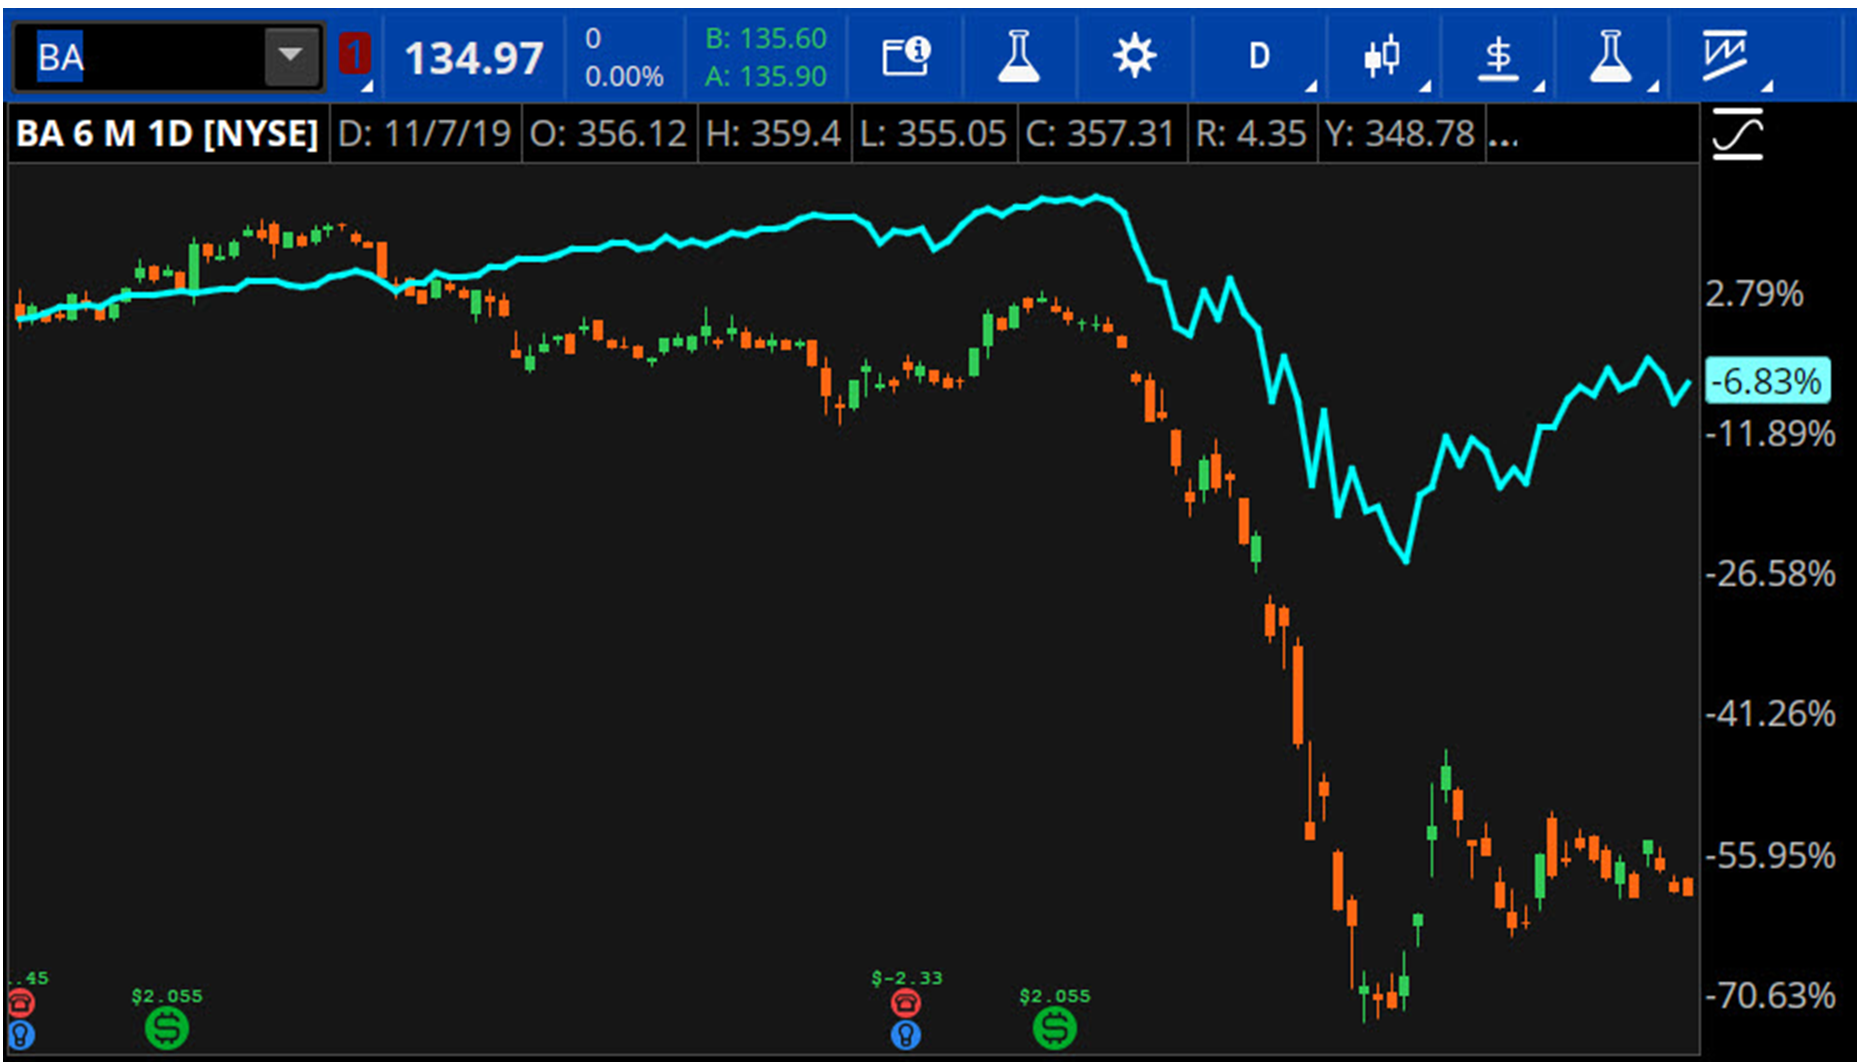
FIGURE 1: HARD LANDING. Though aerospace giant Boeing (BA–candlestick) had its share of problems—much of it related to the beleaguered 737 Max—shares more or less held their own relative to the S&P 500 Index (SPX–blue line), until the coronavirus pandemic severely curtailed air travel in the U.S. and across the globe. Data sources: NYSE, S&P Dow Jones Indices. Chart source: The thinkorswim® platform from TD Ameritrade. For illustrative purposes only. Past performance does not guarantee future results.
BA’s commercial aircraft deliveries in 2019 fell to 2005 levels and caused the company to lose major ground against Airbus. Production of the 737 Max halted earlier this year about 10 months after the plane got grounded.
BA said in January it doesn’t expect the U.S. government to approve the Max for a return to service until midyear. It’s unclear, though, how much the pandemic might affect that timing. Earlier this month, BA stock got a brief lift on April 17 when the company said it planned to restart production of many of its commercial airplanes later in the month.
Last year’s CEO change brought Dave Calhoun to BA’s cockpit. Sometimes fresh leadership in a crisis can give investors hope that a company is ready to change directions. Calhoun dealt with regulatory issues as chairman of the board of Caterpillar (CAT), and has longstanding ties with the aviation industry.
That might sound promising, but it doesn’t matter much if BA can’t get things right with the Max. We’ll have to wait and see, and also perhaps get more timing details on the earnings call.
Return Date Still Cloudy
What analysts and investors probably want to know more about is how and when BA can get the Max flying again. Unfortunately, if you’re hoping for predictions, you might be disappointed.
BA stopped producing the Max in January and remains in talks with regulators seeking approval to return the plane to service, Reuters reported. BA is addressing two new software issues with the MAX flight control computer.
The issues at BA have been very tough on its suppliers and their employees. Spirit Aerosystems (SPR) has reduced its workforce by more than 3,000 since January. It also implemented a four-day work-week at its Wichita, Kansas, plant, and cut executive salaries. BA has a vast ecosystem that reverberates around the economy. Even before the virus hit, the Trump administration was saying BA’s pain might have taken a noticeable hit on U.S. gross domestic product (GDP) growth.
A Check of the Order and Delivery Numbers
BA delivered a total of 50 commercial airplanes from January through March, compared with 149 in the year-ago quarter and the lowest level for the Q1 since 1984. The company saw 737 deliveries fall from 89 to five. The 737 deliveries consisted of two commercial 737NGs and three for military application, BA said.
Though commercial deliveries in Q1 only reached about one-third of Q1 2019 levels, they did exceed some analysts’ expectations, so there’s that.
On the other hand, BA said there were 150 cancellations of orders for its 737 Max in March. During the quarter the company logged orders for 49 commercial airplanes, including 29 Boeing 787s. The month of March saw orders for 31 airplanes, consisting of 12 Dreamliners, 18 Boeing 737NGs for the Poseidon P-8 program, and a single 767 Freighter.
The 737 Max cancellations could actually help by removing some backlog pressure during the model’s grounding, reported AIN Publications, an independent media company focused on the aviation sector. As BA said, “These adjustments remove near-term pressure on Boeing’s skyline, providing more flexibility to deliver on the more than 4,000 Max airplanes in backlog and protect the value of the Max family,” it said in a written statement.
Total cost of the 737 Max crisis reached about $18 billion for the company as of December, the company reported at its last earnings.
Glancing back at Q4, BA reported a loss of $2.33 per share, compared with adjusted per-share profit of $5.48 a year earlier. Revenue in the last three months of the year dropped 37% to $17.91 billion from $28.34 billion in the year-earlier period.
Boeing Earnings and Options Activity
When BA releases results, it’s expected to report adjusted loss of $1.58 per share, vs. positive earnings of $5.48 per share in the prior-year quarter, on revenue of $17.3 billion, according to third-party consensus analyst estimates. That revenue would represent a 24.5% drop from a year ago.
The options market is implying about an 8% stock move in either direction around the upcoming earnings release. Implied volatility was at the 49th percentile as of Friday morning
Looking at the May 1 weekly expiration, put volume has light overall, but highest at the 130 strike. Calls have seen a bit more activity, with decent volume at the 145 strike and heavy volume at the 150 strike.
Note: Call options represent the right, but not the obligation, to buy the underlying security at a predetermined price over a set period of time. Put options represent the right, but not the obligation to sell the underlying security at a predetermined price over a set period of time.
Good Trading,
JJ
@TDAJJKinahan
TD Ameritrade Network is brought to you by TD Ameritrade Media Productions Company. TD Ameritrade Media Productions Company and TD Ameritrade, Inc. are separate but affiliated subsidiaries of TD Ameritrade Holding Corporation. TD Ameritrade Media Productions Company is not a financial adviser, registered investment advisor, or broker-dealer.
Why oil prices went negative and why they can go negative again
PUBLISHED SUN, APR 26 20205:44 PM EDTUPDATED AN HOUR AGO
KEY POINTS
- Oil storage around the world is filling up, fast. Onshore tanks in most parts of the U.S. are at capacity, and the rest of the world isn’t far behind.
- If refineries ultimately don’t want oil, it has little to no value. If you have oil and nowhere to put it, it can have negative value.
- Absent a sharp demand return, production will need to be reduced more rapidly than what’s happening now.
Geology is the study of pressure and time. That’s all it takes really… pressure… and time.
Red Redding
“THE SHAWSHANK REDEMPTION”
Pressure. Time. And a big gosh darn supertanker.
Apologies for altering one of Morgan Freeman’s most famous lines in movies, but it had to be done to fit the oil drama that’s playing out with a Hollywood script.
The investing world was gobsmacked and eyes glued to CNBC when oil futures went negative last week. If you missed it the first time, don’t worry it could happen again.
Oil storage around the world is filling up, fast. Onshore tanks in most parts of the U.S. are at capacity, and the rest of the world isn’t far behind. Desperate traders and producers are using any resource to store their crude.
Oil supertankers are looking like petroleum paparazzi, crowding the Los Angeles shoreline, either as floating storage or waiting on some kind of turn in sentiment. With prices higher in coming months, for now it pays to sit on oil and hope to sell it for more money down the pipeline.
Hope is a good thing. Maybe the best of things.
The OPEC+ and G20 production cuts begin Friday, May 1st. But there’s already an armada of oil tankers heading our way right now, ready to give us 40+ million more barrels of oil no one needs. Much of that will go to the Saudi Aramco-owned Motiva refinery in Texas, but overall refinery output is already down to 67% and may get cut further because no one is driving.
If refineries ultimately don’t want oil, it has little to no value. If you have oil and nowhere to put it, it can have negative value.
The key question right now is how much time is left until everything is full: every tank, every ship, every hole in the ground?
Depending on whom you ask, it’s anywhere from two weeks to maybe two months, best case. Oil industry infrastructure is large and labyrinthine, and full of smart, creative people who may be able to extend current capacity through human ingenuity, thus postponing what no one previously could even dream of: nowhere to go, and negative prices. The industry is under pressure like never before.
Pressure. And time.
Absent a sharp demand return, production will need to be reduced more rapidly than what’s happening now. Though only a few weeks into the first round of capital spending cuts, U.S. producers may have to cut again, and soon.
Even long time oil folks, cynical yet optimistic as they are, understand what to do: Don’t take oil out of the ground if you have no place to put it and no one to sell it to.
The industry is facing unprecedented demand, job and wealth destruction. Yet some continue to pay for the same barrel of oil three times. They spend to take it out of the ground, spend to move it somewhere else, and spend to store it somewhere, perhaps even back in the ground.
It has to stop or the industry will.
And to anyone who can’t see that, Andy Dufresne would have a simple question: how could you be so obtuse?
‘QE4ever’ will help drive stocks to new highs post-coronavirus crisis, long-time bull Ed Yardeni predicts
PUBLISHED SUN, APR 26 20205:01 PM EDT
Stephanie Landsman@STEPHLANDSMAN
New market highs may only be a year away.
Long-time bull Edward Yardeni believes the Federal Reserve’s coronavirus policies are already providing a boost to stocks and putting them on track for a record 2021.
“On March 23, we made a low exactly on the same day that the Federal Reserve introduced what I call ‘QE4ever.’ The Fed announced that they were going to purchase bonds for the foreseeable future,” the Yardeni Research president told CNBC’s “Trading Nation” on Friday. “They didn’t put any end date on it. They didn’t put any limit on it.”
It’s a key move that suddenly gave investors the opportunity to get out of bonds and buy stocks cheaply, according to Yardeni.
“If we have another opportunity for any downside, I think you’ll see more re-balancing which very much reduces the likelihood that we’ll be able to get back to the March 23 lows,” he said.
Yardeni, who spent decades on Wall Street running investment strategy for firms including Prudential and Deutsche Bank, saw trouble brewing in the market before much of Wall Street.
On the show in early February, he warned the coronavirus was the biggest threat to the record market rally, and he advised investors to put some cash on the sidelines. Yet, stocks continued hitting new milestones up to about two weeks later.
Early last month, Yardeni lowered his year-end S&P 500 price target from 3,500 to 2,900.
“We’re basically almost there already,” he noted. “I’m not going to get too cute about it. I think we’re still going to be around this level by year-end.”
But now with the notion coronavirus cases are peaking and the U.S. economy is closer to re-opening, Yardeni’s optimism is growing.
“It seems a little out of place to talk about a new high when obviously the economic indicators are horrible. But the market does look forward,” he said. “Sometime next year, maybe by the end of next year, we’ll be moving toward 3,500. We got as high as 3,300 back in February.”
However, his forecast comes with a caveat: The U.S. economy must open before summer due to the severe damage caused by the shutdowns.
“I would get very concerned if we keep this thing locked down past May,” Yardeni said. “In that scenario, we’re not talking about a ‘V’-[shaped economic] recovery. I mean we wouldn’t even be talking about a ‘U’-recovery. Something more like an ‘L’, and I certainly wouldn’t want to see that.”
Making sense of a stock market just 16% off its high while a pandemic costs 26 million jobs
PUBLISHED SAT, APR 25 202010:14 AM EDTUPDATED AN HOUR AGO
Michael Santoli@MICHAELSANTOLI
KEY POINTS
- The S&P 500 is just 16% off its all-time high and up 29% off its low a month ago despite a pandemic that’s cost 26 million jobs.
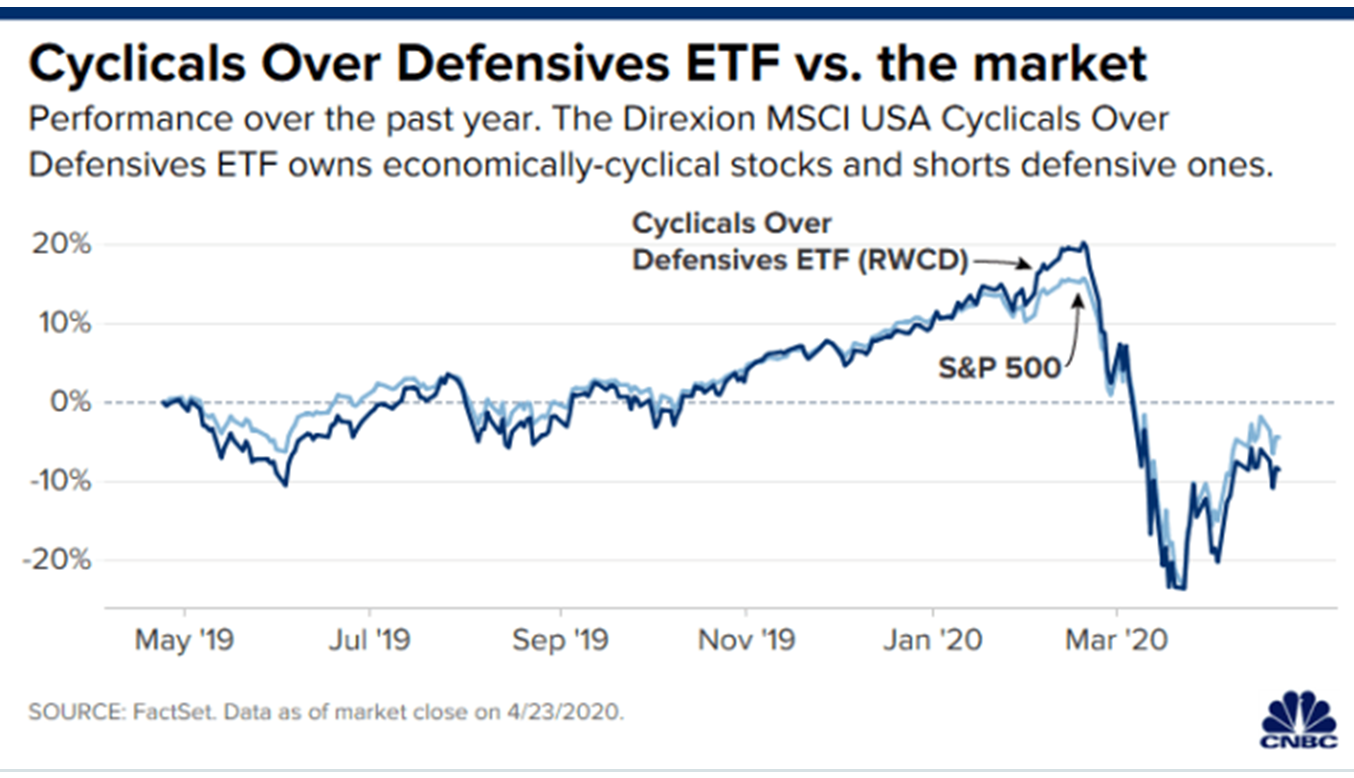
- But stocks don’t appear to be handicapping a quick resurgence in the economy when looking at the weak performance of “early cycle” groups such as autos, banks, consumer durable goods and retail.
- Big, steady secular-growth stocks in technology, healthcare and consumer staples are holding things together.
- Amazon’s $1.2 trillion market value now accounts for more than 40% of the entire value of the S&P 500 consumer-discretionary sector.
Why isn’t the stock market much lower?
This question is occurring to plenty of observers right now, given the apparent contrast between economic realities and equity performance.
A pandemic-driven economic catastrophe of unprecedented speed has cost more than 26 million jobs, which to many seems unreflected in an S&P 500 index that’s up 29% from its low a month ago, down a mere 16% from a record high and resting near levels from late summer 2019 – a time when we were at full employment and record corporate profitability.
Even some on Wall Street are remarking on this perceived Wall Street-Main Street disconnect.
Cantor Fitzgerald strategist Peter Cecchini last week argued, “The equity market just isn’t getting the joke. Three factors make this rally appear somewhat ridiculous because the likely extent of the slowdown will be severe relative to historical experience for three reasons: 1) a pandemic whose duration is unknowable, 2) an oil shock whose impacts on earnings will be deflationary, and 3) an already fragile economy as indicated by an inverted yield curve and already contracting loan volumes.”
Credit Suisse’s Jonathan Golub notes the S&P 500 has been at the current 2800 level a couple of times in recent years, comparing the fundamental context for each visit. When the S&P traded here in both January 2018 and March 2019, forecast earnings over the next year were appreciably higher (meaning stocks now look more expensive) and credit spreads are much wider now (suggesting a riskier environment).
Only when comparing valuations on the profit projections two years out does today’s market look roughly in line with the prior stops at 2800. And it’s probably fair to assume that today’s consensus forecast calling for 2021 earnings growth well above 2019 levels is unadjusted for the full realities of the economic shock underway.
Certainly, the trillions in Federal reserve asset buying has helped enable the rally in risk assets that has lifted equities off their lows and bolstered valuations.
Market internals tell the true story
Yet the way the S&P has returned to 2800 doesn’t truly suggest that the market has rushed to anticipate a roaring economic revival.
If stocks were handicapping such a quick resurgence in the economy, one would expect “early cycle” groups such as autos, banks, consumer durable goods and retail to lead the market. This is the opposite of what’s going on.
Binky Chadha of Deutsche Bank notes that the firm’s early-cycle long-short basket of stocks “after falling massively during the sell-off has continued to fall during the rally.”
Similarly, the Direxion MSCI Cyclicals Over Defensives ETF, a small fund that goes long economically sensitive stocks and short non-cyclical names, has had a fairly feeble bounce after a 38-percent collapse, badly trailing the S&P on the rebound.
Big, steady secular-growth stocks in technology, healthcare and consumer staples are holding things together at the big-cap index level against a steady undertow from shares of cyclical businesses with flagging demand and shakier balance sheets.
This is visible in the gulf between the performance of classic “recession-recovery” plays such as General Motors, flooring-products maker Mohawk Industries and consumer lender Capital One Financial and secular-growth or counter-cyclical names like Amazon, Abbot Laboratories and Campbell Soup.
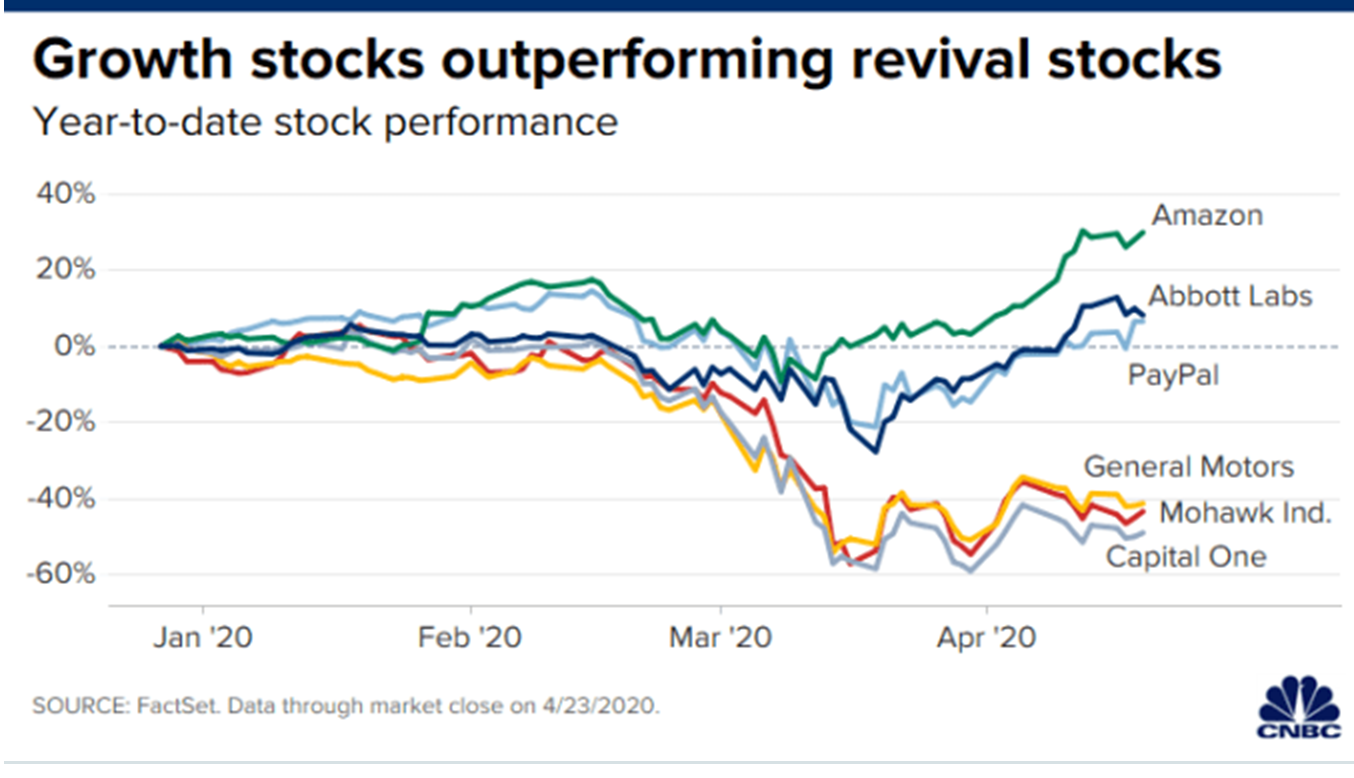
Amazon exemplifies another dominant trend, the premium being placed by investors on the acclaimed winners of an even more winner-take-all economy that might follow this downturn. Amazon’s $1.2 trillion market value, in fact, now accounts for more than 40% of the entire value of the S&P 500 consumer-discretionary sector.
Of course, just because the market is leaning on sturdy growth businesses rather than outright positioning for a better economy doesn’t mean this theme can carry the market indefinitely higher from here.
Market stalling
The S&P, in fact, has stalled over the past two weeks, chopping sideways just below the rebound-rally highs, as some growth stocks take a breather and short-term overbought conditions are worked off.
It would not be surprising for the indexes to continue digesting the move, assimilating the rush of corporate earnings in coming weeks, with some observers looking for a potential pullback of a few percent from here simply as a matter of technical market positioning.
And at some point, the extreme reliance on the mega-cap growth leaders can go too far. The five largest stocks already make up more than 20% of the S&P, pushing record concentration at the top.
Flows into the ETFS that track the Nasdaq 100, technology, healthcare and utilities have reached extremes, a sign they are getting a bit overheated and are prone to backing off.
At the same time, the market will almost certainly start to anticipate the trough in economic activity well before it seems obvious on Main Street that things are getting better. That would be visible in a rotation out of the crowded stable-growth names and into those distressed, struggling cyclical consumer, financial and industrial groups.
Historically, the stock market has some of its best returns when conditions are shifting from awful to less bad. The recent rally in energy stocks in the face of record-low washout prices in crude oil is an illustration of that.
As Strategas Group technical strategist Chris Verrone notes, “It’s difficult to get worse than worst ever,” and many gauges are, like oil prices, indeed at or near their worst readings on record: unemployment claims, Europe manufacturing indexes, Citigroup Economic Surprise Index.
Things might soon line up for investors to start making a more aggressive bet the worst will pass before long and the real economy can start the healing process. And perhaps that bet will prove premature for a while once its laid.
But that doesn’t mean that right now Wall Street has already given the economy credit for recovering from an ordeal whose pain and duration are not yet known.
HI Financial Services Mid-Week 06-24-2014