
HI Market View Commentary 03-09-2020
Long-Term Perspective in Important in a Freak Show Market !!!!
| Market Recap |
| WEEK OF MAR. 2 THROUGH MAR. 6, 2020 |
| The Standard & Poor’s 500 index edged up 0.6% last week, halting the measure’s losing streak on worries about the novel coronavirus even as the number of confirmed cases and deaths continued to climb globally.
The market benchmark ended the week at 2,972.37, up from last week’s closing level of 2,954.22. However, the S&P 500 is still down 8.0% for the year to date. This marks the S&P 500’s first week in the black since the week ended Feb. 14. It came as investors began to differentiate among stocks and sectors rather than selling them across the board on coronavirus fears, as was done in the past two weeks. The gains were led by utilities and consumer staples, which are perceived as offering safety; utilities jumped 7.9% and consumer staples added 6.1% on the week. Health care climbed 4.9% amid hopes the sector would benefit from a coordinated effort to combat the novel coronavirus. The health-care sector’s gainers included UnitedHealth (UNH), which jumped 11% on the week, and Humana (HUM), which climbed 15%. The activity came in a week in which the number of confirmed coronavirus cases globally topped 100,000, with more than a fifth of the cases in countries other than China, according to data compiled by Johns Hopkins University. There are now some 90 countries affected and more than 3,408 people have died globally. The energy sector had the largest percentage drop of the week, down 6.1%, as crude oil futures tumbled to lows not seen since 2016. The financial sector followed with a 3.9% slide amid the concerns about the negative impact of the coronavirus on global economic growth. The energy sector’s drop came as the Organization of Petroleum Exporting Countries and Russia failed to agree on deeper production cuts to alleviate the impact of the coronavirus on oil prices. Among the decliners, shares of Exxon Mobil (XOM) fell 7.3% on the week. |
TODAY we dealt with the ramifications of our friend Putin who wants put US shale oil producers out of business.
WE HAVE an amazing opportunity to buy into the market ar 2016 prices or lower in some equities
How low some go back to 2009
Our big swoosh came today as retail/everyone got washed out of the market including the baby in the bathwater
Where will our markets end this week?
Higher
DJIA – Bearish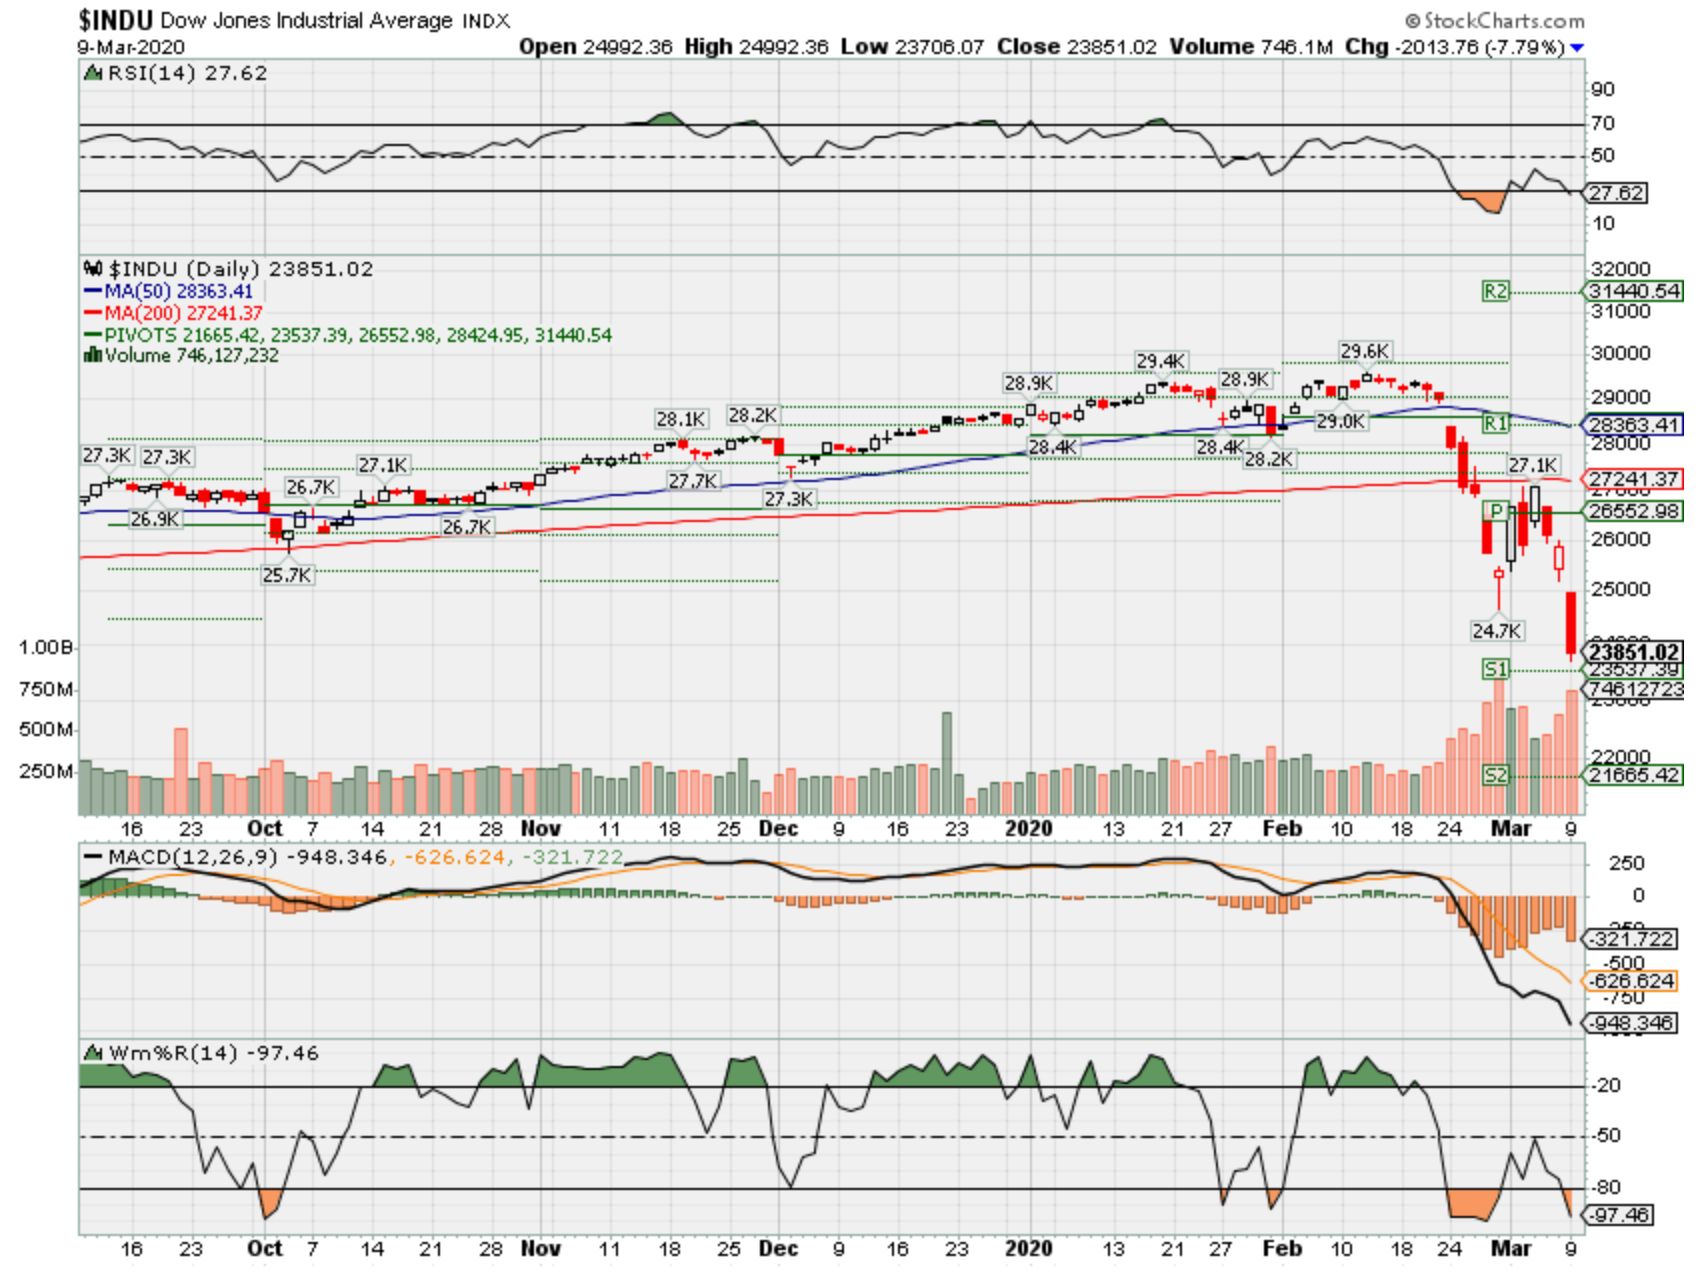
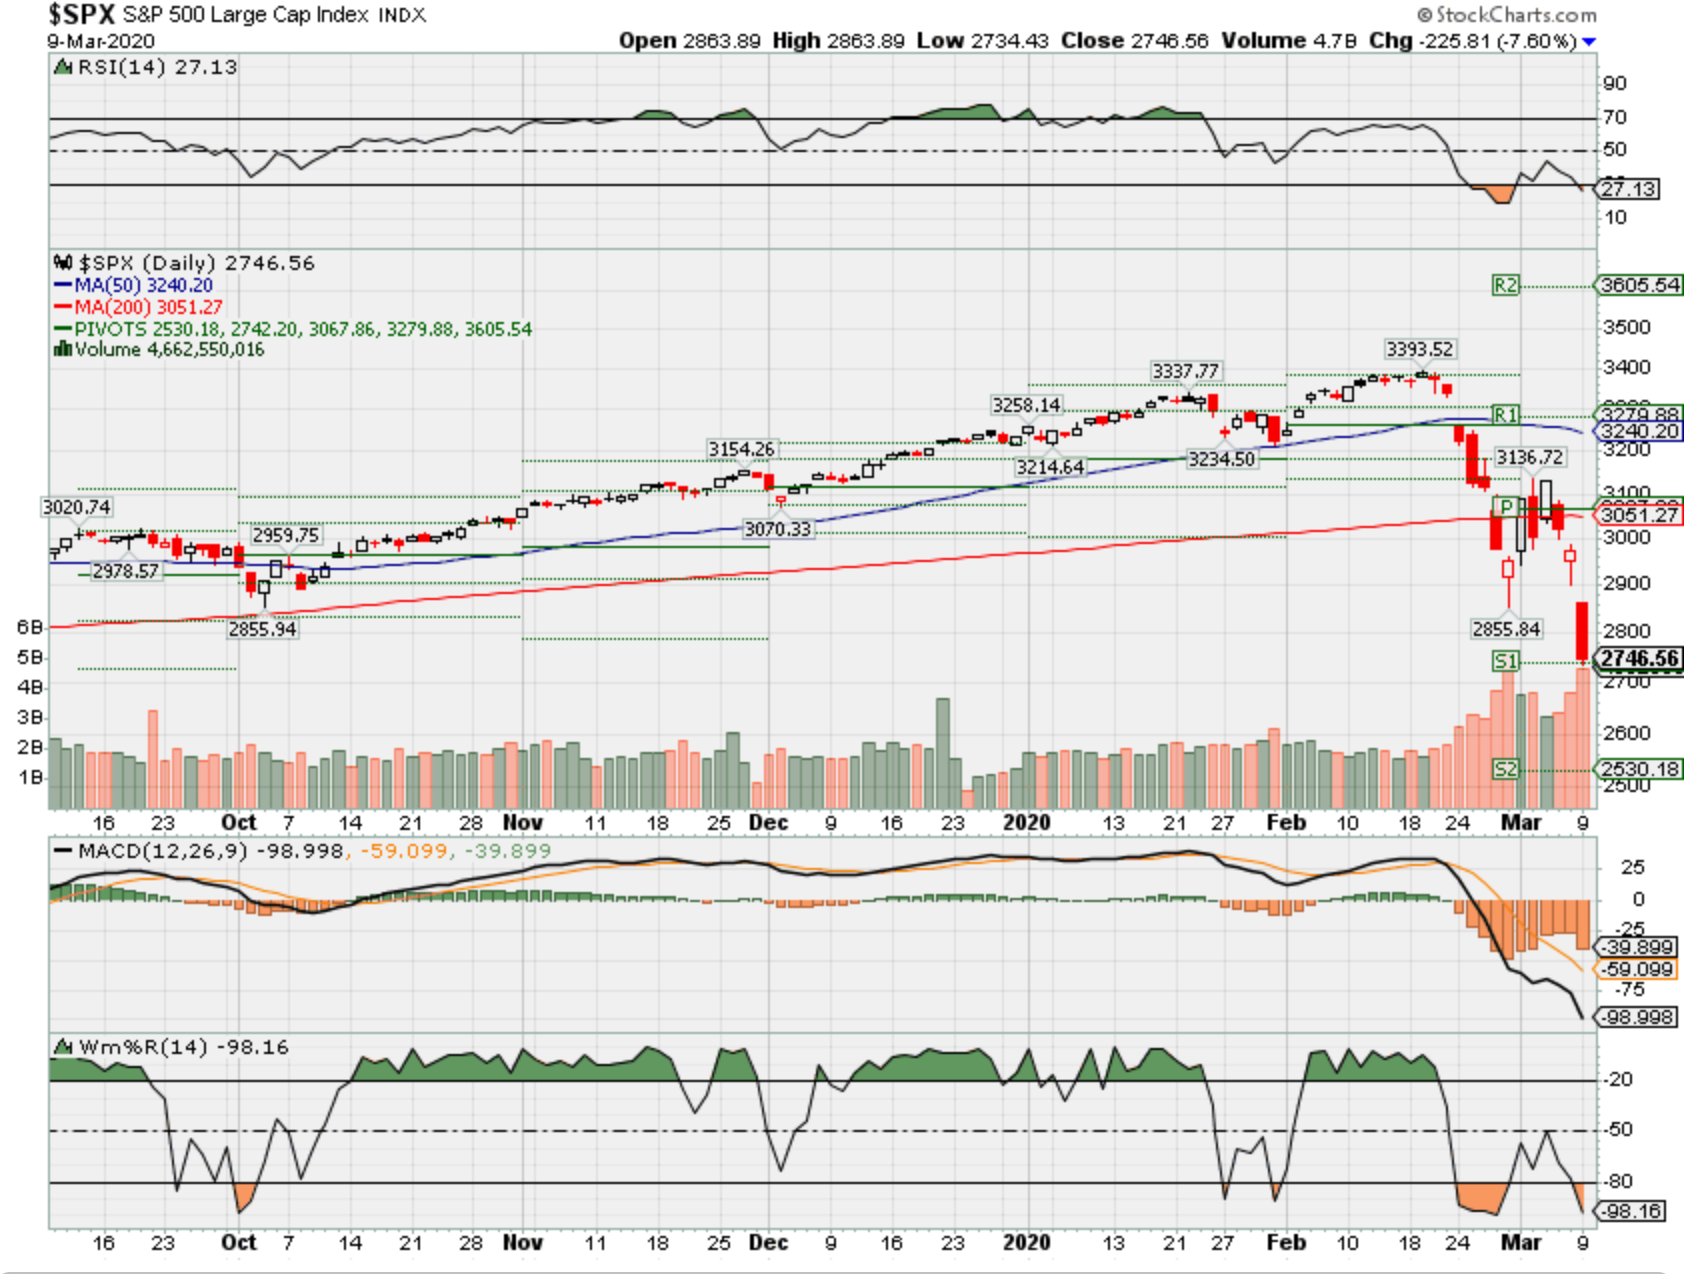
SPX – Bearish
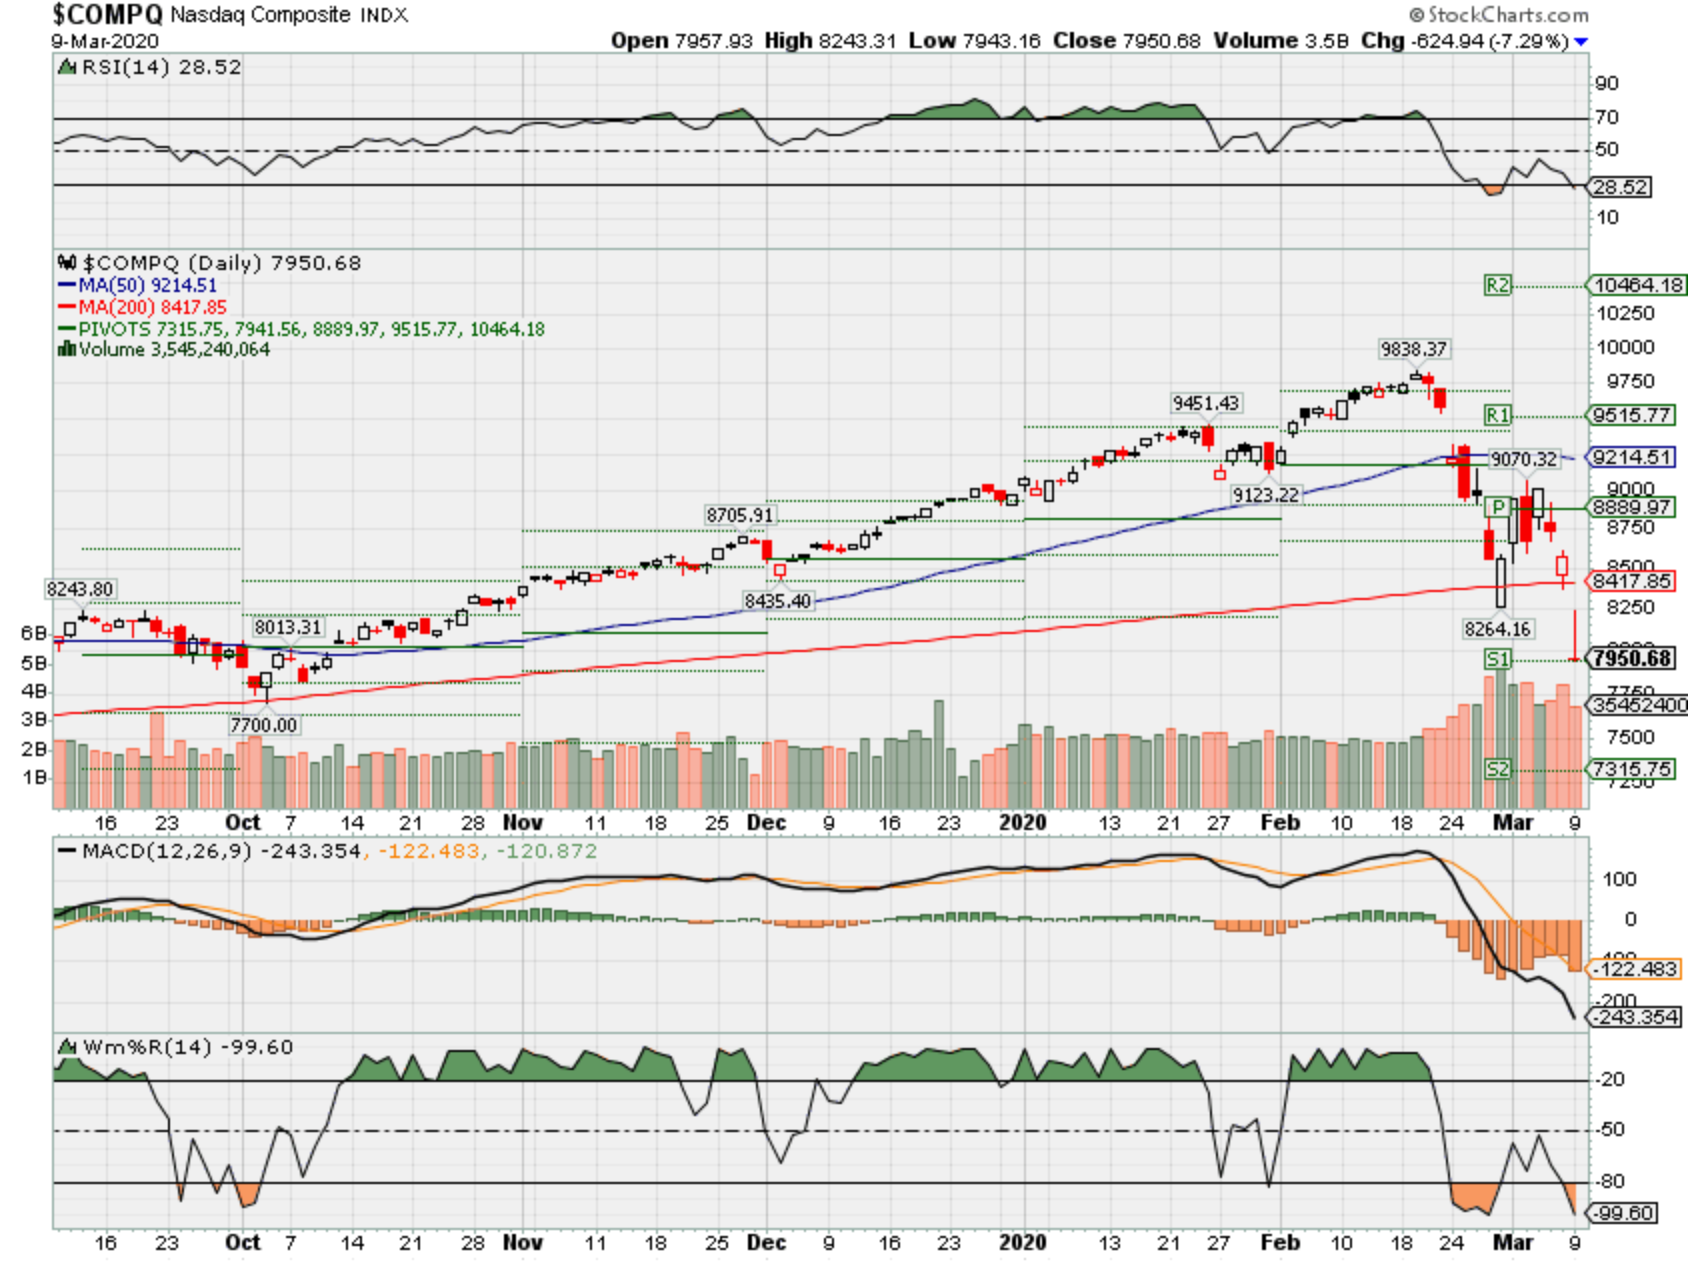
COMP – Bearish
Where Will the SPX end March 2020?
03-07-2020 0.0%
03-02-2020 +5.2 %
Earnings:
Mon: SOHU, MTN
Tues: DKS, VSLR
Wed: XPRS, TACO
Thur: DG, GCO, JBL, ADBE, ORCL, ULTA
Fri: BKE
Econ Reports:
Mon:
Tues: NFIB Small Business
Wed: MBA, CPI, Core CPI, Treasury Budget
Thur: Initial, Continuing, PPI, Core PPI
Fri: Export, Import, Michigan Sentiment
Int’l:
Mon –
Tues – CN: CPI, PPI; EUR: GDP
Wed –
Thursday – EUR: ECB Interest Rate Decision
Friday-
Sunday –
How am I looking to trade?
What kind of corona virus forgiveness will be see in earnings analysts numbers and with future guidance
Fundamentals trump technical over time but short term sentiment trumps all
www.myhurleyinvestment.com = Blogsite
customerservice@hurleyinvestments.com = Email
Questions???
I’m excited because we’ve made up more than half the downside movement AND we have pricing for some positions that go back a decade or more
The market triggered a ‘circuit breaker’ that kept stocks from falling through the floor. Here’s what you need to know
PUBLISHED MON, MAR 9 20206:19 AM EDTUPDATED MOMENTS AGO
Jeff Cox@JEFF.COX.7528@JEFFCOXCNBCCOM
The S&P 500 fell more than 7% Monday, triggering circuit breakers that temporarily helped halt a further plunge.
The index hit the mandatory trading halt shortly after the open, stopping trading below that level for 15 minutes. The market resumed trading at 9:49 am ET and continued a decline that saw the Dow Jones Industrial Average briefly shed more than 2,000 points.
In addition to the S&P, the most all-encompassing large-cap stock index, the Dow tumbled 7.3% while the Nasdaq, which is concentrated in technology names, slid 6.9% before trading stopped.
However, about 10 minutes after trading resumed, the major indexes shaved their losses though they remained down steeply for the session and were approaching bear market conditions.
“The market circuit breakers are designed to slow trading down for a few minutes, give investors the ability to understand what’s happening in the market, consume the information and make decisions based on market conditions,” New York Stock Exchange President Stacey Cunningham told CNBC’s Bob Pisani. “This is operating as it’s supposed to.”
What is a circuit breaker?
According to the New York Stock Exchange, a market trading halt may occur at “three circuit breaker thresholds” on the S&P 500 due to large declines and volatility. The exchange classifies this at three levels based on the preceding session’s close in the S&P 500.
The rules, which apply to regular trading hours only, are as follows:
- Level 1: If the S&P 500 drops 7%, trading will pause for 15 minutes.
- Level 2: If the S&P 500 declines 13%, trading will again pause for 15 minutes if the drop occurs on or before 3:25 p.m. ET. There will be no halt if the drop happens after that. (This would occur Monday if the S&P falls 386 points).
- Level 3: If the S&P 500 falls 20%, trading would halt for the remainder of the day. (This would occur if the S&P falls 594 points).
These circuit breakers have never been triggered in their current form during regular trading hours. The prior circuit breaker system was revamped after it failed to prevent the May 2010 flash crash. The current set of breakers were put into effect in February 2013.
Investors knew going into the open that this halt was a possibility based on trading in overnight futures. S&P 500 futures traded “limit down” of 5% in early morning trading, halting activity for those futures overnight Monday.
—CNBC’s Peter Schacknow and Bob Pisani contributed to this report.
Wall Street’s Pros Fess Up: ‘We Don’t Know What’s Going On’
By Vildana Hajric and Elena Popina
March 5, 2020, 2:09 PM MST Updated on March 5, 2020, 10:37 PM MST
Vix above 30 for six sessions marks longest stretch since 2011
Deutsche Bank sees stocks falling 30% in worst-case scenario
Along with the virus, here’s what people said has been driving the stock market this week. Optimism over Fed policy. Pessimism over Fed policy. Optimism over the government’s response. Pessimism over the government’s response. The Beige Book. Joe Biden.
The ink’s barely dry on one view, and the market goes careening the other way. It’s a futile, and infuriating, situation for investors and analysts. Forget about trying to predict where stocks will be in six months or a year. These guys can’t even figure out where they’ll be tomorrow. Everything depends on how the virus outbreak will play out. And nobody has a clue.
“When you have a 4.5% up day in the market and a 2% down day — what does that mean?” says Kathryn Kaminski of AlphaSimplex Group. “It just means we don’t know what’s going on.”
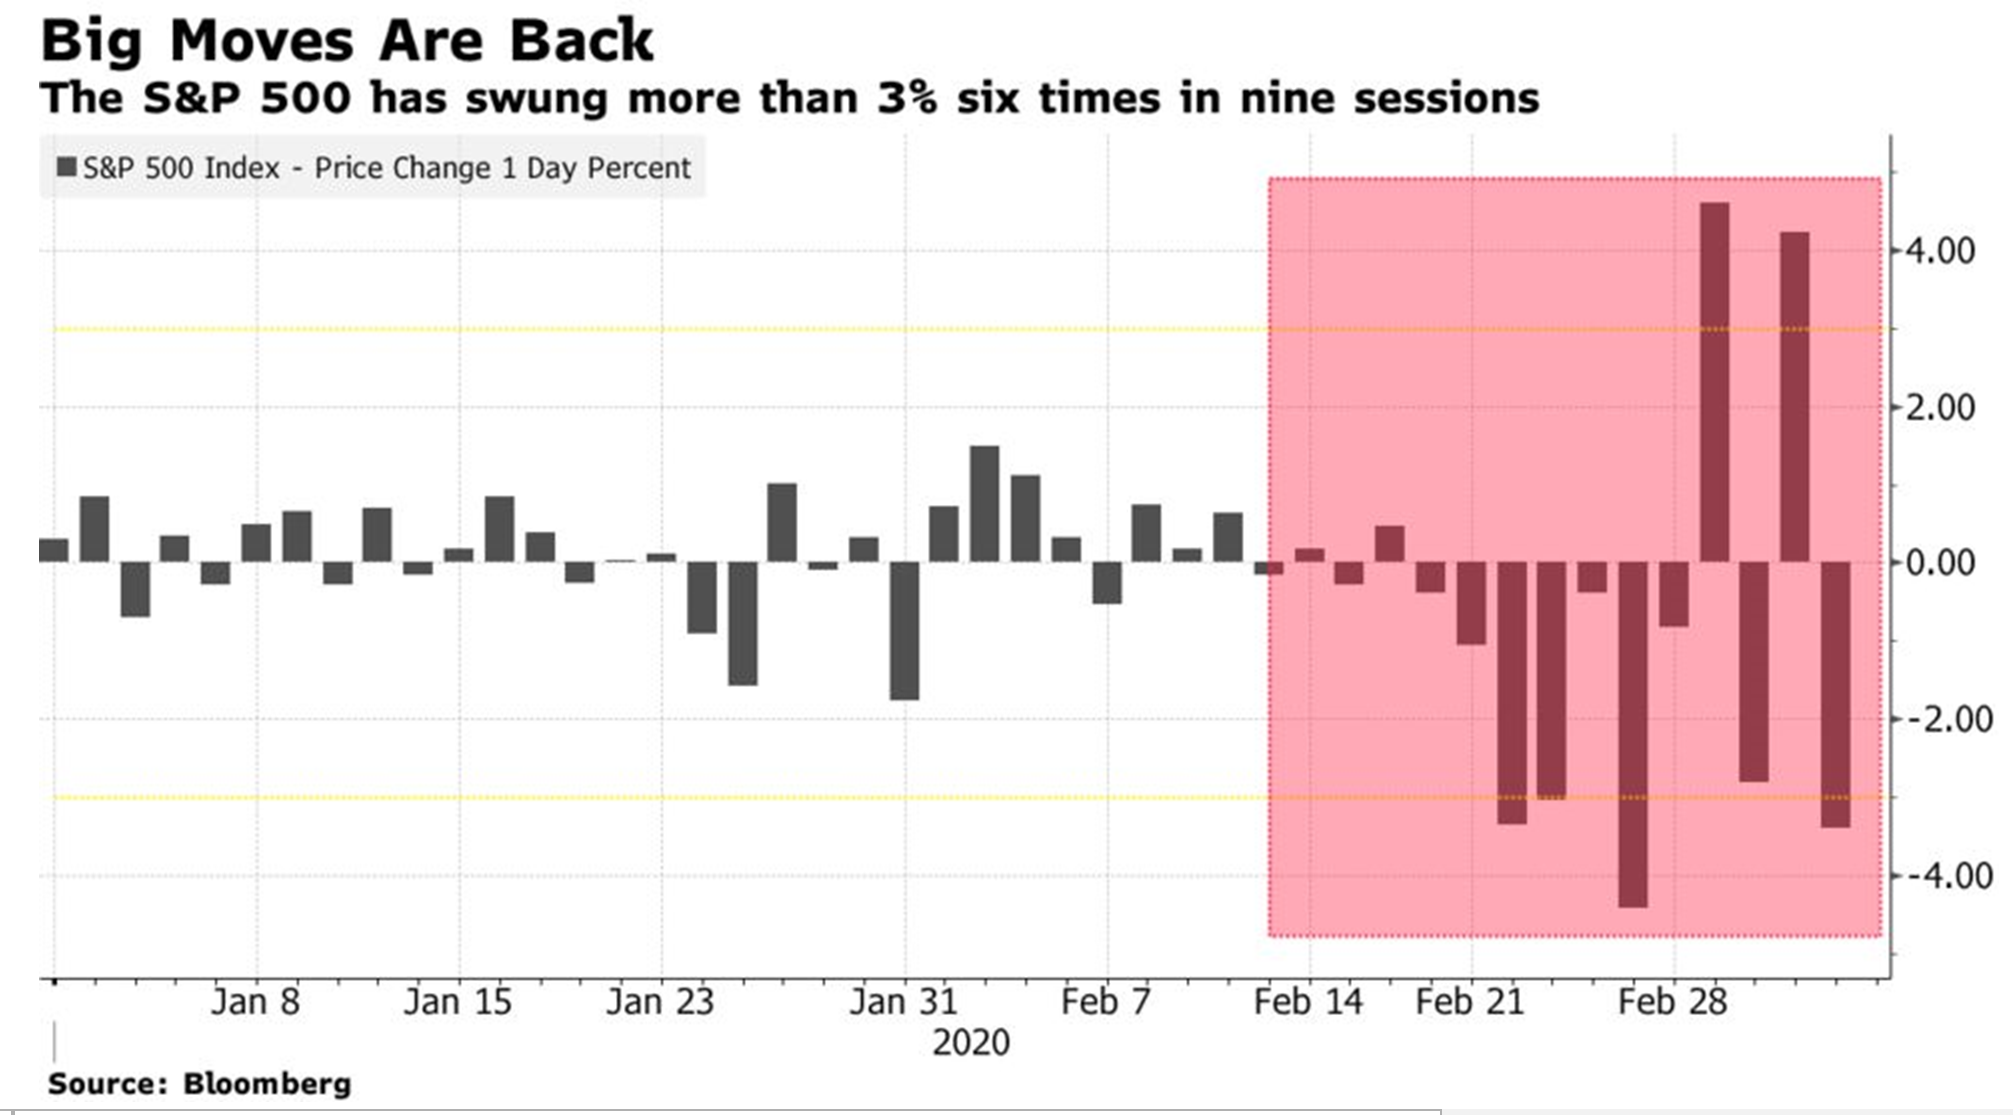
The result has been historical turbulence, swings that rank with any before. The Cboe Volatility Index, or the VIX, has remained above 30 for six consecutive sessions, the longest streak since 2011. And the fear gauge closed above its emerging-markets counterpart by the most on record, based on data going back to 2011.

Gains on Monday turned to losses Tuesday turned to gains Wednesday turned to losses Thursday. In nine trading sessions, three have seen the S&P 500 close up or down 4%, and four others brought 3% dives. An eight-day average of the S&P’s daily high-low range is the widest since 2011, according to Bloomberg data.
Buy the dip? “This time, it’s a little harder to say whether that’s the right thing to do,” said Chris Zaccarelli, chief investment officer at Independent Advisor Alliance. “Until you have better clarity on whether or not it could cause a recession or a dramatic slowdown, the likes of which the bond market is indicating, it may be a little premature.”
Cantor Fitzgerald says use any rally based on central bank actions to sell equities. JPMorgan Chase & Co. says the responses will succeed: time to wade in. Bloomberg Intelligence’s Gina Martin Adams points to a spike in high-yield spreads — bad for shares. Deutsche Bank Securities Inc. sees the sell-off continuing.
In episodes when volatility increased relative to historical levels, it’s taken an average of six to seven weeks for it to subside, the Deutsche group, led by economists Peter Hooper and Matthew Luzzetti, wrote in a report, with the S&P taking another four to five months to recoup losses after that. A 30% drop from recent peaks, their most severe scenario, corresponds to an average recession sell-off.
Citigroup Inc. says it’s unwise to do anything before data catches up with the virus, including earnings revisions. “We admit that we cannot fully capture what are fluid developments,” the group led by Tobias Levkovich wrote in a note.
A string of companies have warned of hits to profits but few have said how big. Goldman Sachs Group Inc. and JPMorgan, among others, have cut their earnings forecasts in recent days. Cumberland Advisors, a money management firm with over $3 billion in assets, has taken down its projections three times, according to David Kotok, the firm’s chief investment officer.
“We aren’t getting guidance from companies because companies don’t know what to give,” Kotok told Bloomberg TV this week. “But we do know pain is coming on the earnings front.” The firm projects earnings of $160 for 2020, but may lower them again, he said. “We don’t know what the final numbers will be.”
Read more: U.S. Jobs Engine Braces for Virus Hit After Steady February
Messaging from the Fed confounds, too. After instituting an emergency interest rate cut on Tuesday, Chairman Jerome Powell left the door open to further action at its next scheduled meeting. A day later, Federal Reserve Bank of St. Louis President James Bullard said he doesn’t think markets should over-emphasize the possibility of another reduction as there might be little justification for a change in rates by then.
“It’s definitely volatile. Once things get to this point, it normally takes a few weeks for things to settle down,” Michael Shaoul, chief executive officer at Marketfield Asset Management LLC, told Bloomberg TV. “All we know now is that we don’t really understand what’s going to happen next. It’s probably 4, 6, 8 weeks before we’re going to have any useful information as to what the trajectory of the virus is or what the actual economic fallout looks like.”
— With assistance by Katherine Greifeld, Lu Wang, Luke Kawa, and Joanna Ossinger
Stressed stock market may need to retest its lows before finding its footing in the coronavirus crisis
PUBLISHED SAT, MAR 7 20208:07 AM EST
Michael Santoli@MICHAELSANTOLI
KEY POINTS
- The S&P 500 may retest its Feb. 28 low of around 2855 before rebounding.
- An alarming collapse in Treasury yields is also testing investors’ long-held ideas about how to value stocks.
- Extreme swings in the market may moderate as market seeks a new trading range.
The stock market doesn’t “wait and see.”
As much as investors themselves need time to assess the economic effects of the coronavirus outbreak, the market registers the immediate shock of a derailed economic-growth outlook and then whips around madly as it shuttles among all the widely divergent outcomes.
And so, the S&P 500 — after dropping 12% to end February in the fastest such correction on record — last week went screaming in both directions, alternating quicksilver rallies with urgent selloffs in the most volatile action since the 2011 panic over a feared U.S. debt default and European credit crisis.
A week ago here, my call was that “the tape is becoming stressed and stretched in a way that tends to precede the kind of reflex rally that is sudden, powerful and probably untrustworthy.” That roughly played out, with Monday’s huge 4.6% S&P 500 rally giving way to severe chop that wore away just about all that daily gain.
Here is the S&P 500 over the past decade along with the average ten-day daily price change, plotted by SunTrust. Such violently fibrillating periods tend to occur after the initial flush lower in a correction, though often with more weakness lurking out ahead.
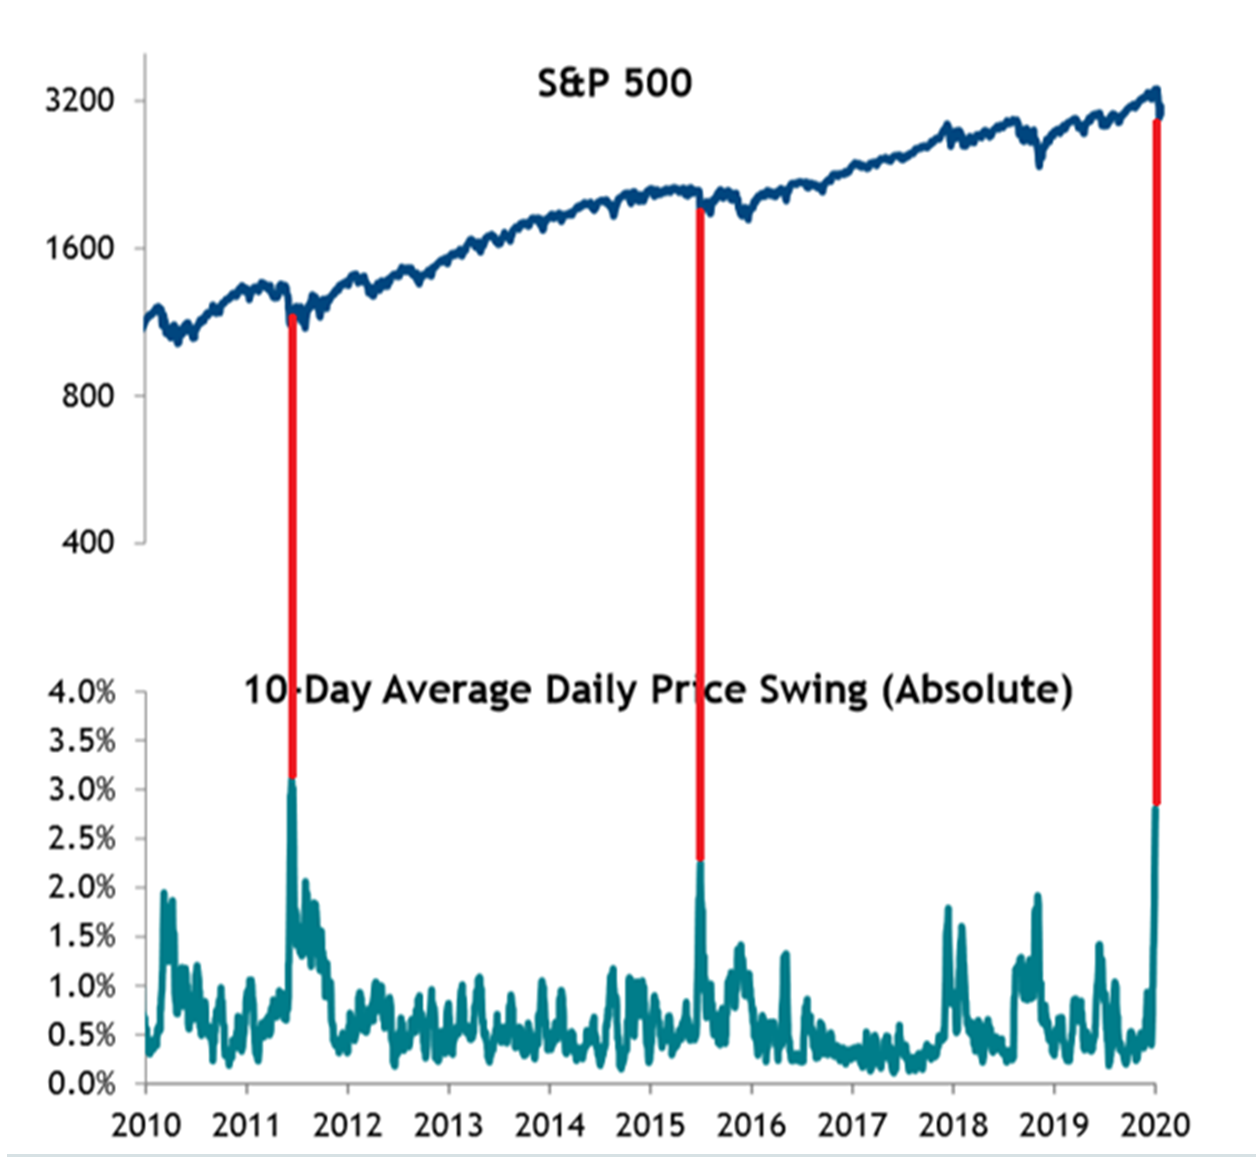
While such mercurial action might seem confused or irrational, it can be seen as the market relentlessly hunting for buyers and sellers with conviction about the outlook. In a time when the market’s trend buckles and the range of outcomes runs from brief pause in economic growth as the virus is contained to open-ended pandemic and recession, prices need to move farther, faster, to locate those high-conviction investors.
As Kevin Dempter, a strategist at Renaissance Macro Research, puts it, “The market has seen extreme whipsaws as it’s been desperately trying to form a new trading range.” This has been the course followed the prior times the past decade when a sudden downturn pushed the CBOE S&P 500 Volatility Index up toward 50, as it did recently.
“Extreme daily whipsaws should eventually ease as the range tightens,” he says. “In these times of extreme uncertainty, the potential for range-bound consolidation is welcomed as it at least gives investors some clarity on important market levels to help manage risk.”
In other words, in such times, sideways movement represents progress.
A flattish week in stocks with Treasury yield rushing to stunning new lows below 0.7% appears a tentative, fragile equilibrium at best. The VIX finishing the week in the 40s and gauges of credit-risk showing escalating stress by week’s end make it hard to declare the fever is passed.
The way ahead can be viewed as a series of tests:
- In the typical market-correction playbook, a significant low in the indexes, formed with a dramatic reversal, usually is tested within weeks or months. For the S&P 500, this level is around 2855, the low from the afternoon of Feb. 28, where a furious rebound rally began on heavy volume.
Ideally, a retest should return to or near that low and show less selling intensity (fewer stocks making new lows, lesser trading volume), in which case traders can start to view it as a presumed bottom. On Friday, the S&P sagged to about 2900, with a good deal less selling pressure than the week before – perhaps a sign the bears had done enough for now, if not a robust retest. In the 2011 tailspin and the early 2018 drop, a retest two months later found footing at slightly lower levels that the initial tumble.
Of course, not all retests are passed. The initial double-digit drop in 2018 from a September all-time high, stocks bounced hard and it looked like a retest setup, only to give way to a more disorderly selloff and ultimate 20% loss that December, before a furious recovery took hold.
- Wall Street also needs to be tested for resilience to the inevitable barrage of incremental coronavirus headlines – daily infection counts, cities curtailing activities, businesses restricting travel.
The market storm won’t abate when the outbreak seems contained to everyone’s satisfaction. It will be over once securities get priced to a level that reflects a serious set of outcomes and then stop responding to what everyone expects to be a widening radius of infection and business disruption.
It’s unclear this point has been reached.
- The alarming collapse in Treasury yields is also testing investors’ long-held ideas about how to value stocks. This correction began from a moment of rich valuations that were dependent on a series of positive things happening: global economic reacceleration, rebound in corporate profits and a Fed benignly holding policy steady.
Is a 12% drop from such levels enough to account for the rising possibility of flat-or-worse earnings and severe consumer retrenchment?
Investors typically argue that equity valuations can be higher when bond yields are lower. Yet with yields scraping toward zero, this math grows tenuous. Could stock valuations in Europe and Japan be infinite with yields below zero?
Or do the conditions that cause yields to approach zero mean the backdrop is inherently less friendly for corporate fortunes and stock values?
Goldman Sachs plots the so-called equity risk premium, or the gap between the earnings yield on S&P 500 (earnings divided by price) and the 10-year Treasury yield.
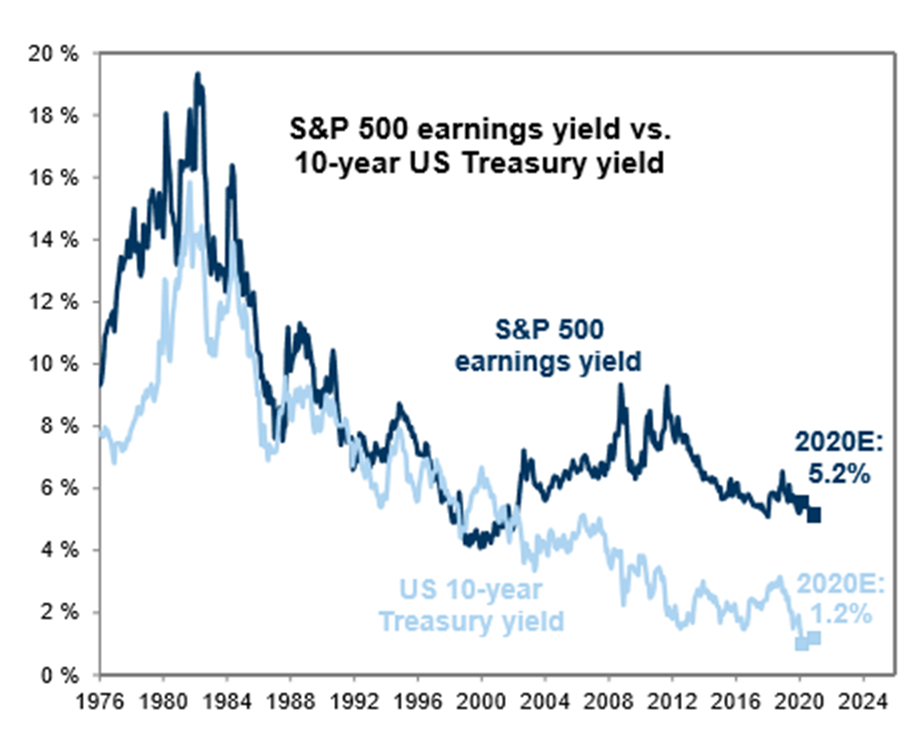
It now shows equities to be as attractively valued on this basis as they’ve been since 2014 or so — even more so than on the chart, now that Treasuries are below 1%. Not bad — unless this approach loses validity at the extremes of the interest-rate spectrum, and the factors driving down rates also make those earnings forecasts suspect.
Fed slashing rates to zero is more likely than a recession, Barclays’ top economist says
PUBLISHED SUN, MAR 8 20205:01 PM EDT
Stephanie Landsman@STEPHLANDSMAN
Top Wall Street economist Michael Gapen expects the Federal Reserve will do what’s necessary to contain the coronavirus’ impact on the U.S. economy — even if it means slashing interest rates to 0%.
“The likelihood of getting to zero is higher than the risk of a recession,” the head of U.S. economics research at Barclays told CNBC’s “Trading Nation” on Friday. “There is probably a low risk of a recession, a 1 in 4 maybe at the most.”
It’s a move that would be deeper than during the financial crisis. That downturn prompted the Fed to cut rates to a range-bound 0%-0.25%.
“They certainly haven’t laid out a lot of plans. But certainly they would not stop at zero.” Gapen noted. “I think they would be prepared to do more.”
Last Tuesday, the Federal Reserve delivered an emergency half percentage point cut due to growing coronavirus fears. It brought the Fed’s current target to 1%-1.25%.
“Where I think the concern lies is does a dip, a V-shaped outcome from a virus create a credit event? Then, you could get a recession kind of outcome,” he said.
Gapen is operating on the notion that the Fed has the tools to prevent a recession. He lists a small quantitative easing program and introducing forward guidance as options to complement rates at zero.
“We certainly think the Fed would be prepared to do more,” said Gapen. “There’s a lot of volatility in markets, and the Fed is very concerned about market functioning and keeping liquidity free flowing and credit available.”
Yet he acknowledges the number of unknowns regarding coronavirus, highlighting the infectious rate as a major one.
The longer social distancing and quarantines are in effect, Gapen warns the more damage they’ll inflict on corporate balance sheets, hiring and consumer spending.
“We don’t know the extent of the outbreak. We do think testing will be coming into place soon, and we’ll know to what degree or at least have a better idea to what degree this has spread throughout the United States,” he said “Is it regional hot pockets or is it kind of hot pockets throughout the United States?”
Right now, Gapen’s base case is the Fed will cut rates by a quarter point at its March 17-18 meeting and in April.
“We think 50 more basis points of cuts are coming,” Gapen said. “We don’t know if we’re going to be at zero yet. But it’s reasonable to think about what if.”
https://www.newsmax.com/finance/markets/putin-shale-oil-crude/2020/03/08/id/957424/
Putin Dumps MBS to Start a War on America’s Shale Oil Industry
At 10:16 a.m. on a wet and dreary Friday morning, Russia’s energy minister walked into OPEC’s headquarters in central Vienna knowing his boss was ready to turn the global oil market upside down.Alexander Novak told his Saudi Arabian counterpart Prince Abdulaziz bin Salman that Russia was unwilling to cut oil production further.
The Kremlin had decided that propping up prices as the coronavirus ravaged energy demand would be a gift to the U.S. shale industry. The frackers had added millions of barrels of oil to the global market while Russian companies kept wells idle. Now it was time to squeeze the Americans.
After five hours of polite but fruitless negotiation, in which Russia clearly laid out its strategy, the talks broke down. Oil prices fell more than 10%. It wasn’t just traders who were caught out: Ministers were so shocked, they didn’t know what to say, according to a person in the room. The gathering suddenly had the atmosphere of a wake, said another.
For over three years, President Vladimir Putin had kept Russia inside the OPEC+ coalition, allying with Saudi Arabia and the other members of the Organization of Petroleum Exporting Countries to curb oil production and support prices. On top of helping Russia’s treasury – energy exports are the largest source of state revenue – the alliance brought foreign policy gains, creating a bond with Saudi Arabia’s new leader, Crown Prince Mohammed bin Salman.
But the OPEC+ deal also aided America’s shale industry and Russia was increasingly angry with the Trump administration’s willingness to employ energy as a political and economic tool. It was especially irked by the U.S.’s use of sanctions to prevent the completion of a pipeline linking Siberia’s gas fields with Germany, known as Nord Stream 2. The White House has also targeted the Venezuelan business of Russia’s state-oil producer Rosneft.“The Kremlin has decided to sacrifice OPEC+ to stop U.S. shale producers and punish the U.S. for messing with Nord Stream 2,” said Alexander Dynkin, president of the Institute of World Economy and International Relations in Moscow, a state-run think tank. “Of course, to upset Saudi Arabia could be a risky thing, but this is Russia’s strategy at the moment – flexible geometry of interests.”
The First No
The OPEC+ deal had never been popular with many in the Russian oil industry, who resented having to hold back investments in new and potentially profitable projects. In particular, Igor Sechin, the powerful boss of Rosneft and a long-time Putin ally, lobbied against the curbs, according to people familiar with the matter, who asked not to be identified discussing private conversations.The Kremlin was also disappointed the alliance with Riyadh hadn’t yielded major Saudi investments in Russia.For several months, Novak and his team had been telling Saudi officials they liked being in the OPEC+ alliance but were reluctant to deepen production cuts, according to people familiar with the relationship.
At the last OPEC meeting in December, Russia negotiated a position that allowed it to keep production fairly steady while Saudi Arabia shouldered big reductions.When the coronavirus started devastating Chinese economic activity in early February – cutting oil demand in Saudi Arabia’s biggest customer by 20% — Prince Abdulaziz tried to convince Novak that they should call an early OPEC+ meeting in response to cutback supply. Novak said no. The Saudi king and Putin spoke by phone – it didn’t help.As the virus spread and analysts forecast the worst year for oil demand since the global financial crisis, the Saudi camp was hopeful Moscow could be won round at the next scheduled OPEC meeting in early March.
The Russians didn’t rule out deepening cuts, but kept making the point that shale producers should be made to share the pain.Putin, who has been the final arbiter of Russia’s OPEC+ policy since the alliance started in 2016, met oil Russian producers and key ministers last Sunday. Russia’s approach was that shale producers should share the pain caused by the drop in demand, cutting U.S. oil production, according to someone who attended.
Bad Chemistry
As ministers gathered in Vienna this week, Saudi Arabia made a final effort to force Russia’s hand. They persuaded the core OPEC group to support a deep production cut of 1.5 million barrels a day, but made it contingent on Russia and the other OPEC+ countries joining in. Novak turned up last at the Vienna headquarters where his nervous counterparts were waiting for him, and refused to budge.
The crown prince even considered calling Putin on Friday, according to a person familiar with the situation. But Putin’s spokesman made clear he had no plans to get involved. As for the two countries’ oil ministers, there was no personal chemistry between them, according to a person in the room. They didn’t exchange a single smile, said another.
With every leak from the meeting the price of oil twitched, as traders slowly came to realize a deal was going to be impossible.
Priming the Pump
Rosneft is delighted with the breakup. It can now move to boost its market share, said spokesman Mikhail Leontiev.
“If you always give in to partners, you are no longer partners. It’s called something else,” he told Bloomberg. “Let’s see how American shale exploration feels under these conditions.”
But the decision to take on shale could backfire. While many drillers in Texas and other shale regions look vulnerable, as they’re overly indebted and already battered by rock-bottom natural gas prices, significant declines in U.S. production may take time. The largest American oil companies, Exxon Mobil Corp. and Chevron Corp., now control many shale wells and have the balance sheets to withstand lower prices. Some smaller drillers may go out of business, but many will have bought financial hedges against the drop in crude.In the short run, Russia is in a good position to withstand an oil price slump. The budget breaks even at a price of $42 a barrel and the finance ministry has squirreled away billions in a rainy-day fund. Nonetheless, the coronavirus’s impact on the global economy is still unclear and with millions more barrels poised to flood the market, Wall Street analysts are warning oil could test recent lows of $26 a barrel.
In Saudi Arabia, where the government is almost entirely dependent on oil to fund government spending, the economic impact will be immediate. Prince Abdulaziz and his half-brother Crown Prince Mohammed will have every incentive to boost production to maximize revenue as prices fall.
“Prices will fall until either Moscow or Riyadh call off the endurance contest” or North American production is massively curtailed, said Bob McNally, president of Rapidan Energy Advisors and a former National Security Council staffer.Relations between the two energy ministries remain cordial and the diplomatic mechanisms of the OPEC+ group are still in place, keeping the door open in case the two sides do decide to reunite. Novak told his peers on Friday that OPEC+ isn’t over.
But a photo of the conference room after the delegates had left hinted at a different story: The small Russian flag by Novak’s seat had been knocked over. And Prince Abdulaziz left his counterparts with a grave warning: Trust me, he told them, according to a person in the room. This will be a regrettable day for us all.
© Copyright 2020 Bloomberg News. All rights reserved.
https://finance.yahoo.com/news/bad-rout-most-investors-see-120000454.html
As Bad as Rout Is, Most Investors See Recession as a Long Shot
Lu Wang and Vildana Hajric
BloombergMarch 7, 2020
(Bloomberg) — When $7 trillion is erased from stocks in 2 1/2 weeks, it’s safe to say investors are pricing in a lot of economic pain. One thing most of them are not yet bracing for, however, is a recession.
The view, drawn from a survey published by a Wall Street research firm on Friday, may sound fanciful, given the spread of the coronavirus and its rising threat to the global economy. But it’s not grossly out of line with price action so far in the S&P 500, which has fallen roughly as much as it did in its last six corrections. None of those episodes portended an economic contraction.
Read More: The U.S. May Already Be in a Recession
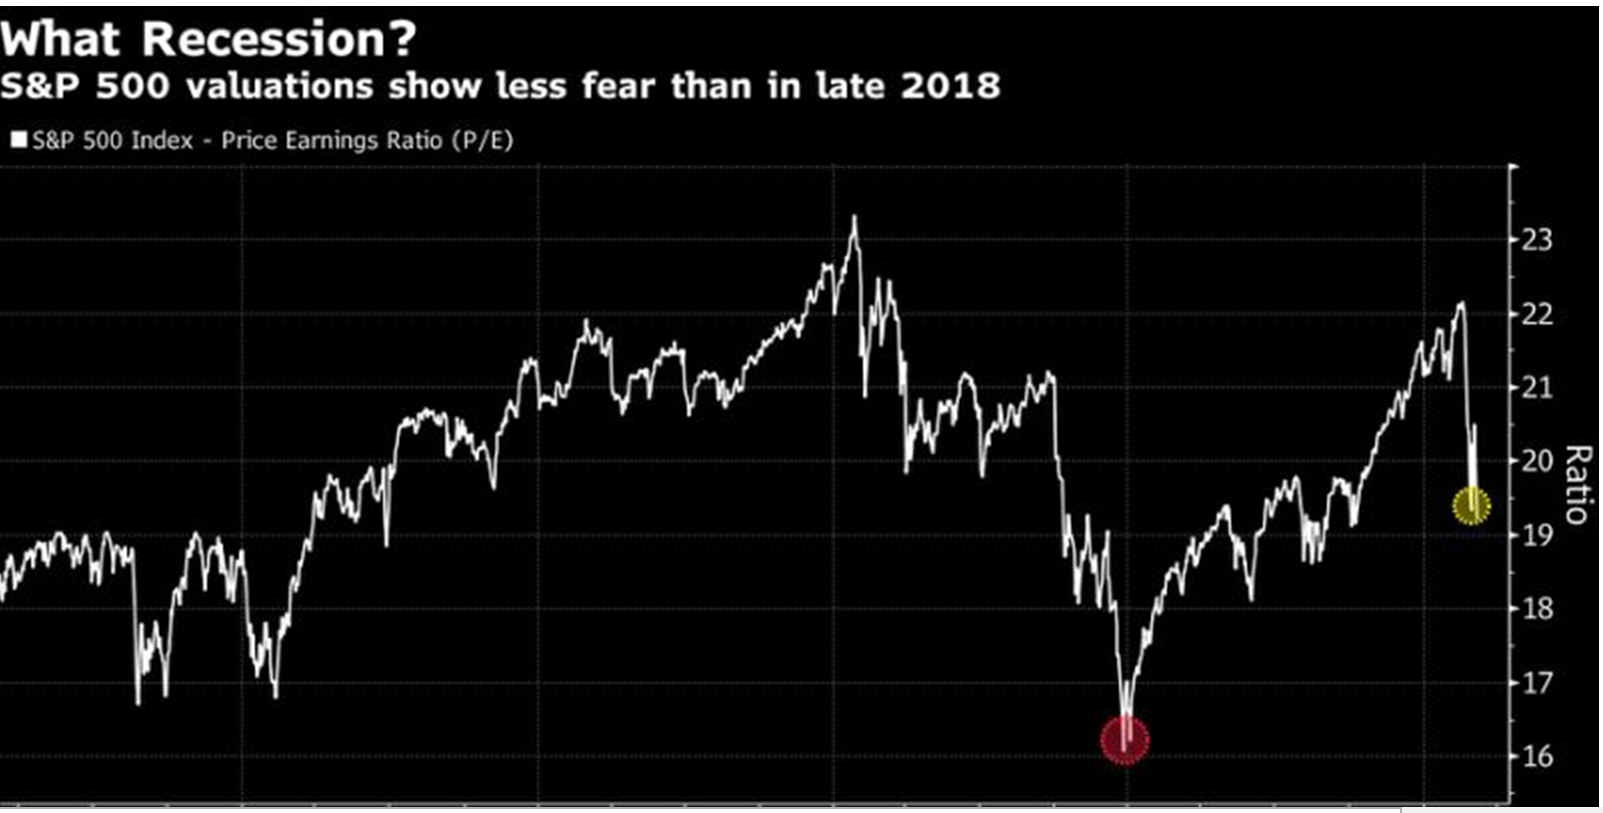
As harrowing as this sell-off has been, by almost any measure except velocity it remains a pipsqueak compared with the battering investors took at the end of 2018. In that episode, the S&P 500 plunged almost 19% while price-earnings ratios, the market’s main measure of sentiment, compressed to 16 times annual earnings. They’re a lot higher than that now at 19.3.
“The market’s saying ‘Ok, obviously equity valuations need to be significantly lower than they were before this started,”’ said Arthur Hogan, chief market strategist at National Securities Corp. “But pricing in a recession in the equity markets is probably not what’s happening right now.”
Anyone could be forgiven for assuming the worst after the week that just was. After twice righting itself after plunges, the S&P 500 fell 3.4% on Thursday and 1.7% on Friday, while measures of volatility hit the highest since 2011. The signal from bonds was ominous: 10-year Treasury rates touched record lows. Coronavirus infections topped 100,000 and outbreaks worsened around the U.S.
Still, in an investor survey conducted by Evercore ISI, less than half of the respondents said they expect the U.S. economy to experience two consecutive quarters of negative growth in 2020. While acknowledging the economic threat from the coronavirus has grown, about two-thirds anticipate the number of infected cases to peak in May.
Of course, one person’s confidence is another’s complacency, and there are analysts who see anything but panic among investors as evidence shares have further to fall. Conditions needed for a market turnaround include a reversal in investor positioning and “recession-like pricing across financial markets,” JPMorgan strategits led by John Normand wrote in a note Friday.
Obviously, not knowing how the outbreak will play out makes predicting its effect on growth impossible. But it’s also worth noting that the U.S. stock market was priced at a historically high multiple when the sell-off began. That complicates the calculus when trying to use reactions in equities as a litmus for how bad the virus’s impact will be.
“It’s entirely been driven by sentiment. What has been pushing the markets lower is P/E compression and that is a reflection of investors’ concerns about what is going on,” said Michael Geraghty, equity strategist at Cornerstone Capital Group. “The U.S. economy is undoubtedly strong. It would take a lot to swing it into a recession and I don’t think the virus is likely to do that anytime soon.”
To safeguard the economy, the Federal Reserve just delivered its biggest cut to interest rates since 2008 while President Donald Trump signed a $7.8 billion emergency-spending bill to fund a response to the outbreak. Larry Kudlow, Trump’s top economic adviser, on Friday opened the door for limited economic stimulus, though the administration’s preferred path appears to be more Fed action.
Traders remain leery on the market, with equity volatility spiking. The S&P 500 rallied more than 4% on two days of the week while tumbling on the other three. Good news is, the market managed to hold support at the intraday low at the end of February.
“With a lot of unknowns out there, the market will be more volatile and will pull back a bit but it doesn’t necessarily mean a recession,” Frank Ingarra, head trader at Greenwich, Connecticut-based NorthCoast Asset Management LLC, said in a phone interview. “Things could wrap up really quick and we could resume a bull market.”
–With assistance from Claire Ballentine.
To contact the reporters on this story: Lu Wang in New York at lwang8@bloomberg.net;Vildana Hajric in New York at vhajric1@bloomberg.net
To contact the editors responsible for this story: Courtney Dentch at cdentch1@bloomberg.net, Chris Nagi
For more articles like this, please visit us at bloomberg.com
Subscribe now to stay ahead with the most trusted business news source.
©2020 Bloomberg L.P.
Plummeting oil prices and mortgage rates could boost consumers rattled by coronavirus fears
PUBLISHED SUN, MAR 8 20202:30 PM EDTUPDATED SUN, MAR 8 20204:51 PM EDT
KEY POINTS
- Oil has plummeted into bear market territory as the virus has led to weaker demand, and OPEC so far has failed to step in and reach a deal to cut production, which could lead to an even more dramatic drop in prices this year.
- The average rate on the popular 30-year fixed mortgage has fallen to an 8-year low.
- “The question is whether the fear factor attributable to the virus will overwhelm any positive impact from lower gasoline prices and lower mortgage rates,” Yardeni Research’s Edward Yardeni said.
As the deadly coronavirus spreads across the globe, oil prices are down 30% for the year and the average rate on the popular 30-year fixed mortgage has fallen to an eight-year low.
It’s positive news for consumers in the short term, even as some economists warn that the virus could tip the U.S economy into recession as the outbreak escalates.
The drop in mortgage rates and oil prices could boost consumer confidence, which rose less than expected in February just one day after the stock market had one of its worst days amid virus concerns. A boost in consumer confidence, in turn, could ease those recession fears.
“The U.S. economy is 70% consumer driven,” said John Kilduff, founding partner of Again Capital. “A drop in gasoline prices acts like a tax cut, freeing up money to spend in other sectors of the economy, especially discretionary sectors, such as travel and leisure and dining.”
The relentless pace of headlines related to the coronavirus, however, could ultimately act as a psychological break on any boost in confidence that low oil prices and mortgage rates might deliver to the consumer.
“The question is whether the fear factor attributable to the virus will overwhelm any positive impact from lower gasoline prices and lower mortgage rates,” said Edward Yardeni, president of Yardeni Research.
“That’s hard to answer, but it seems to me that fear is winning the tug of war currently as evidenced by the drop in stock prices and the panicky responses of governments, the media … and the public,” he added.
‘Ray of hope’ for consumers
Oil has plummeted into bear market territory as the virus has led to weaker demand, and OPEC so far has failed to step in and reach a deal to cut production, which could lead to an even more dramatic drop in prices this year.
Kilduff sees cratering oil prices as a “ray of hope for consumers.” People could see gasoline prices drop below $2 per gallon in upcoming days, and the recent decline in crude oil prices could add as much as 0.50% to U.S. GDP if the drop is sustained, according to Kilduff.
Sectors such as entertainment and travel will likely need the most consumer support as the virus spreads and isolation measures are implemented across the U.S. Investors fear that the virus will disrupt supply chains as U.S. consumer and small-business confidence dips and jobless claims increase.
Jeff Kilburg, founder and CEO of KKM Financial, said that the short-term reaction to lower oil prices will translate into lower prices at the pump for Americans, and that in combination with historically low mortgage rates will provide substantial strength for consumers in the second quarter.
“This resiliency of the consumer will once again support equities and most likely show that this current market reaction is a ‘blip,’ not the end of this bull market … and certainly not the beginning of a recession,” Kilburg said.
Scott Nations, president of Nations Indexes, a financial engineering firm, said the plummet in energy prices is an “apocalypse for producers.” But he maintained that lower prices help consumers save and spend in other sectors like entertainment and retail.
“Add lower prices at the pump, better industrial production, and Friday’s great jobs number and consumer confidence will surge once consumers are focused on buying something other than bottled water, face masks, and hand sanitizer,” he said.
38-year-old retiree: ‘America, stop wasting your money on these 7 things—if you want to retire early’
Published Wed, Mar 4 202010:52 AM ESTUpdated Fri, Mar 6 202011:25 AM EST
Steve Adcock, Contributor@STEVEONSPEED
In 2016, I quit my six-figure job in software development and retired early at 35. My wife Courtney, who was 31 at the time, joined me in early retirement a year later.
Getting there wasn’t easy. We always contributed the annual limit for our retirement savings plans and invested tons of money in the stock market. In fact, Courtney’s entire salary went straight into our investment portfolio.
But much of our success had to do with cutting back on spending. It was hard at first because, like the masses, I was never the thrifty type. Once I dropped my bad spending habits, however, our retirement savings began to skyrocket.
Why Americans struggle to save for retirement
A 2019 report from Ladder, a life insurance company, found that the average adult spends $1,497 per month on non-essentials. That’s roughly $18,000 a year on things we can do without — which is baffling considering how 78% of full-time American workers are living paycheck to paycheck.
While cutting back on spending is just one part of the solution to saving for early retirement, it’s a very effective start. Here are seven pointless things this 38-year-old retiree thinks Americans should stop wasting their hard-earned cash on:
1. Eating out
According to a 2019 survey of more than 2,000 Americans, 69% said they wasted money dining out. And I get it: It’s nice to get out of the house and have someone else cook for you.
But the experience isn’t cheap. On average, Courtney and I used to spend a combined $750 per month on eating out (yes, delivery and drinks count):
- Restaurant meals: $210
- Drinks: $189
- Takeout or delivery: $178
- Buying lunch: $173
That adds up to $9,000 per year, so you can imagine how much money we’re saving now by preparing our own food. Of course, we still treat ourselves to a night out from time to time, but to help control costs, we don’t order beverages or drinks. Water with lemon is just as satisfying — and it’s free. This reduces the bill anywhere from $6 to $15.
We also don’t buy appetizers or desserts, which can easily save us another $15 or more. (I always keep a pint of ice cream in the freezer in case one of us has a sweet tooth.)
Lastly, leftovers never go wasted. Even if it’s just a few pieces of vegetables, we always find a way to reuse them the next day.
2. Phone upgrades
It’s hard to ignore the hype every time there’s a new smartphone from Apple, Google or Samsung. But today’s devices are so advanced that they can function for years without a problem. And while the updated features are nice, they aren’t life-changing.
In most cases, it only makes sense to get an upgrade if your current phone has major technical issues or stops working completely. But even then, taking it to a repair shop first can save you hundreds of dollars. Depending on your carrier, buying the newest model can cost you an extra $25 per month (for financing or leasing) or $600 or more to buy it outright.
Courtney and I kept our previous phones for over four years before finally getting new ones last year. For each year that we decide not to upgrade, we save up to $1,500. Rather than owning a piece of technology that depreciates each year, we figured we’re better off putting that money into appreciating assets in the stock market.
3. Clothing and apparel
The average American spends about $1,866 per year on clothing and apparel, according to a 2019 GOBankingRates report, which rounded up 25 common expenses and used data from the US Census Bureau and the National Retail Federation.
Fast fashion doesn’t make shopping any less tempting, but keep in mind that it only takes a few months for whatever clothes, shoes or accessories that are in style today to be replaced by some other contemporary trend. So before you make a purchase, ask yourself if you really need or have the room for it.
My clothes-buying rule is simple (and slightly Marie Kondo-inspired): Vow to buy less. I just buy the essentials, and once I do, I’ll wear them until they’re stained, ripped or no longer fit. On average, I only step foot into a shopping mall two or three times each year and spend between $50 to $100 per trip.
4. Lottery tickets
They say you can’t win if you don’t play. But we all know that the chances of winning are microscopic — and when compared to basic investment strategies, such as consistently contributing to retirement accounts, spending a few bucks on lottery tickets just doesn’t make sense.
Those few bucks add up, too. From scratch-off cards to Powerball and Mega Millions entries, nearly half of Americans play state lotteries. According to a 2019 report from Bankrate, consumers each spend an average of $86 a month on lottery tickets.
What’s crazier is that a staggering 59% of millennials believe winning the lottery is a reasonable way to retire, according to a 2019 poll from investing app Stash. Ditching this highly addictive habit could save you about $1,032 a year. If that’s not reasonable, I’m not sure what is. a 27-year-old millionaire in the Seattle area spends his money
5. Extended warranties
Extended warranties have become a big business: Roughly $40 billion, according to the newsletter Warranty Week. A 2018 study from Stanford University found that consumers often overpay for extended warranties because they overestimate the likelihood that a product will need a repair.
But these service plans function like insurance, and for every dollar you spend, you’ll likely only get pennies back. Courtney and I never fork over extra money on major appliances, and it has saved us thousands.
Before making a big-ticket purchase, we always do research to make sure we get a high-quality item, because we know it’s less likely to break. Additionally, to stay on the safe side, we put a portion of the money that we otherwise would have spent on warranty fees into a designated repair or replacement fund.
If you really think you need an extended warranty, always read the fine print. In some cases, coverage isn’t eligible for accidental damages, or a claim can be denied if you didn’t follow routine maintenance instructions. Also, you might already have extended coverage benefits through your credit card, so check with your card issuer first.
6. Cable TV
Cable TV prices have skyrocketed over the years. But times have changed, and with the number of streaming services available, ditching cable television was an easy change for us.
Instead of paying more than $100 per month for cable TV, we now pay $49.99 per month for YouTube TV, which includes local television networks, as well as a variety of others that you might find on a cable or satellite service.
There are plenty of other TV streaming options for cord-cutters. At $30 per month, Sling TV is much cheaper than premium services like Hulu with Live TV, which costs $55 per month, but has very few local stations.
A word of caution: Too many Americans end up wasting hundreds of dollars per year on subscriptions they don’t use. So be mindful when deciding what to sign up for (and try to stick with just one service, if possible).
After testing out a few services, Courtney and I chose YouTube TV because it includes more top channels for the base price than any competitor. It also comes with unlimited cloud DVR storage and a generous nine months to watch recordings (most are 30 days).
7. Impulse purchases
This is a broad category, but it basically includes anything you don’t need, but are tempted to purchase “in the moment” — like that pack of gum in front of you at the grocery checkout line.
Trust me, the immediately satisfaction will wear off before you know it. There were so many times when I had to stop myself picking up a 24-pack of toilet paper because it “seemed like a good deal” at the time, even though we were fully stocked at home.
Big purchases are the most dangerous. That Peloton bike, for example, might sound like a smart investment right now, especially when you’re trying to convince yourself that you’ll use it every day.
But if you’re going to pay $1,995 for an exercise bike (and that’s not including the $250 delivery fee or the $39-per-month subscription to stream the live classes), you’d better give it some serious thought and be willing to put in the physical work. Otherwise, it’ll probably just end up collecting dust in your basement.
Steve Adcock is a financial expert who blogs about how to achieve financial independence. A former software developer, Steve retired early at the age of 35. He occasionally writes about money for MarketWatch, Forbes and Business Insider. Follow him on Twitter @SteveOnSpeed.
Ray Dalio: Coronavirus is a “once in 100 years catastrophic event” that will lead to interesting opportunities for investors
Mar. 4, 2020 10:51 PM ET|By: SA Eli Hoffmann, SA News Editor
“As I see it there are three different things going on that are related yet are very different and shouldn’t be confused: 1) the virus, 2) the economic impact of reactions to the virus, and 3) the market action,” Bridgewater founder Ray Dalio writes in a post expressing his thoughts on the coronavirus. “Individually and together they lend themselves to a giant whipsaw with big mispricings, with the off chance that it will trigger the downturn that I have been worried would happen with both the big wealth/political gap and the end of the big debt cycle.”
“Social distancing” will trigger further short-term economic decline, but won’t likely have sustained impact. Previous world pandemics bear this out, he writes.
Markets should focus on companies with insufficient capital to weather the downturn rather than short-term revenue hits. But they are likely to do the opposite. This will lead to a potential V-shaped recovery for fundamentally healthy companies, he says.
Also, “it seems to me that this is one of those once in 100 years catastrophic events that annihilates those who provide insurance against it and those who don’t take insurance to protect themselves against it, because they treat it as the exposed bet that they can take because it virtually never happens. These folks come in all sorts of forms, such as insurance companies who insured against the consequences that we are about to experience, those who sold deep-out-of-the-money options planning to earn the premiums and cover their exposures through dynamic hedging,” he writes. They are and will continue to get squeezed because of cash-flow issues, which will trigger “very unusual and fundamentally unwarranted market action.”
“Also, what’s interesting is how attractive some companies with good cash yields have become, especially as many market players have been shaken out.”
His caveat: “I’m a ‘dumb shit’ when it comes to viruses, though I do get to triangulate with some of the world’s best experts.”
Baidu Stock: Not For The Faint Hearted
Mar. 5, 2020 2:55 PM ET
Summary
Baidu, Inc. faces uncertainty in the wake of the recent coronavirus.
Some analysts say that Baidu, Inc.’s shares have fallen too far recently amid concerns over advertising outlook and the virus outbreak.
The company is focusing on its AI capabilities and providing its “LinerFold” algorithm for free to help the Chinese government advance efforts in fighting the coronavirus.
Baidu, Inc. has traditionally relied on advertising for its revenue, a sector that is vulnerable to economic downturns.
Baidu, Inc. (BIDU) is facing uncertainty as the economic impact of the coronavirus remains unclear. Share values of BIDU have fallen in recent months since the outbreak began. The company relies on advertising for much of its revenue, but the ad sector is particularly vulnerable to economic slowdowns, and Baidu has had to battle with popular start-ups such as Bytedance (BDNCE). However, it is possible that the outbreak could actually help the company as more people are staying home which could lead to greater adoption of the company’s services.
To aid in the fight against COVID-19, the company is increasing efforts in the artificial intelligence and healthcare technology sectors. It currently runs an online doctor consultation platform which the company has made free to use for any online medical queries. It is also providing its “LinerFold” algorithm that gene testing agencies, epidemic control centers, and research institutions globally can utilize for free to further vaccine development research. Further observation is needed to determine if these efforts provide favorable publicity for the company and will help share prices recover in the future.
While current news stories, good or bad can sway our opinion about investing in a company, we need to determine which news topics will have a long-term and ongoing effect on the company and its share price. It’s also a good idea to analyze the fundamentals of the company to see where it’s been in the past and in which direction it’s heading.
This article will focus on the long-term fundamentals of the company, which tend to give us a better picture of the company as a viable investment. I also analyze the value of the company versus the price and help you to determine if BIDU is currently trading at a bargain price. I provide various situations which help estimate the company’s future returns. In closing I will tell you my personal opinion about whether I’m interested in taking a position in this company and why.
Snapshot of the Company
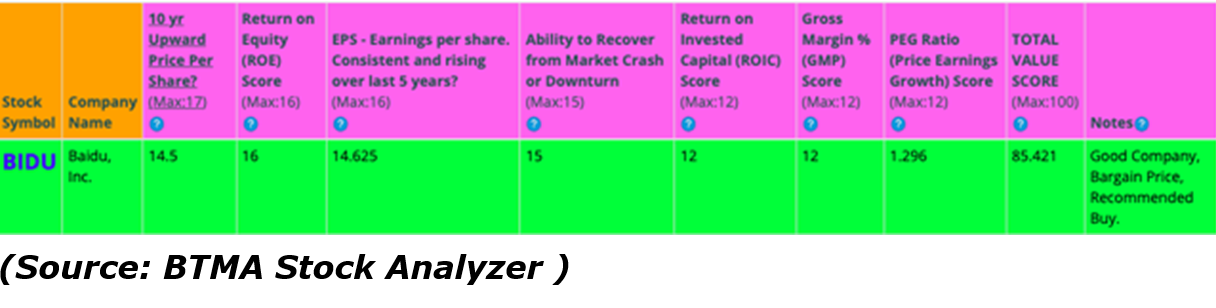
A fast way for me to get an overall understanding of the condition of the business is to use the BTMA Stock Analyzer’s company rating score. It shows a score of around 85/100. Therefore, Baidu, Inc. is considered to be a good company to invest in, since 70 is the lowest good company score. BIDU has high scores for 10 Year Price Per Share, ROE, Earnings per share, Ability to Recover from a Market Crash or Downturn, ROIC, and Gross Margin Percent. It has a low score for PEG Ratio. A low PEG Ratio score indicates that the company may not be experiencing high growth consistently over the past 5 years. In summary, these findings show us that BIDU seems to have above average fundamentals since the majority of categories produce good scores.
Before jumping to conclusions, we’ll have to look closer into individual categories to see what’s going on.
Fundamentals
Let’s examine the price per share history first. In the chart below, we can see that price per share has fluctuated quite a bit over the last 10 years, with a sharp decline from 2018 to 2019. Overall, share price average has grown by about 2.44% over the past 10 years or a Compound Annual Growth Rate of 0.27%. This is an extremely low return and could be a red flag when considering this company.
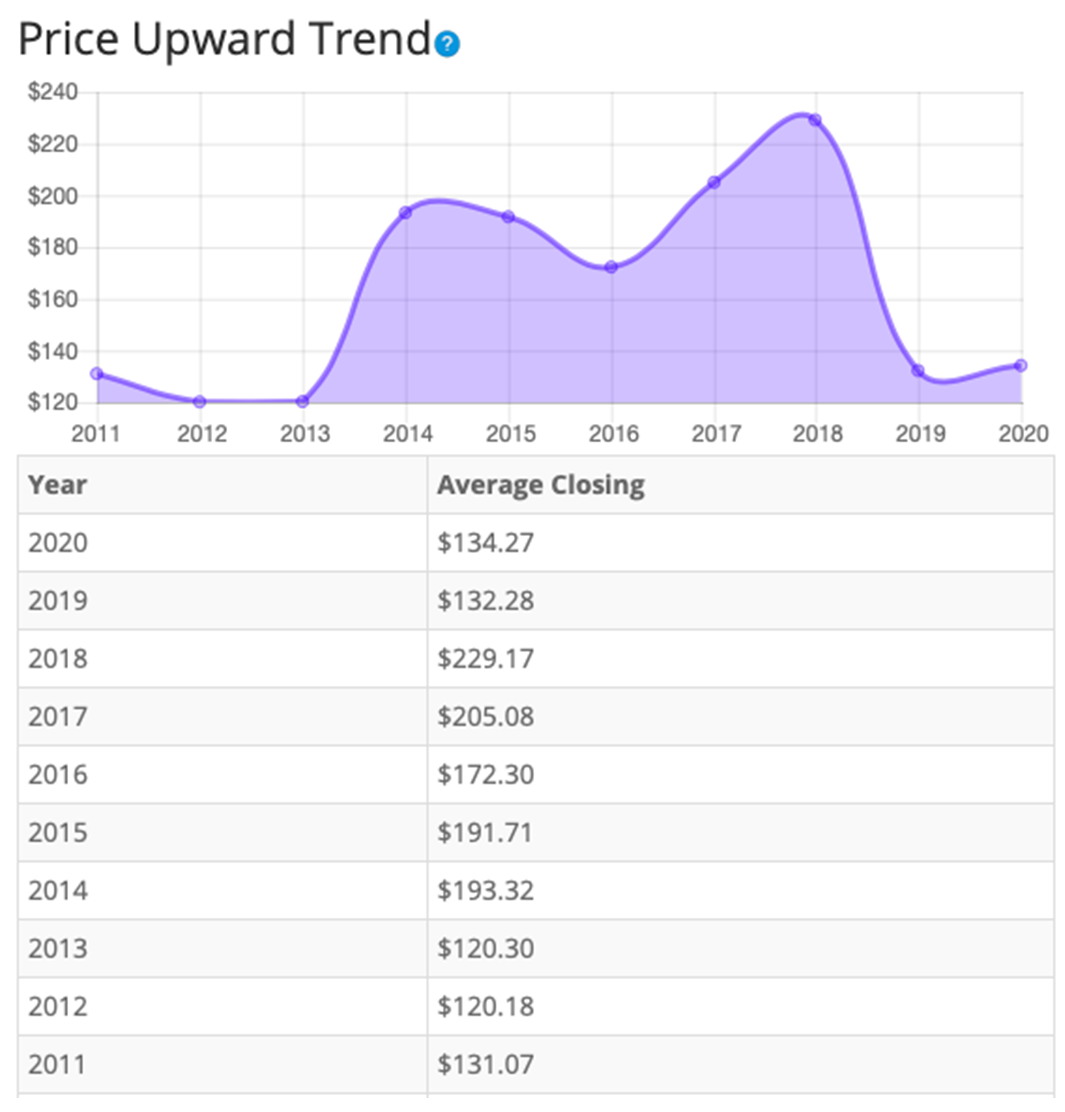
(Source: BTMA Stock Analyzer – Price Per Share History)
Earnings
Looking closer at earnings history, we see that earnings have grown somewhat consistently over the past 10 years, with the exception of 2015.
Consistent earnings make it easier to accurately estimate the future growth and value of the company. So, in this regard, BIDU is a decent candidate of a stock to accurately estimate future growth or current value.
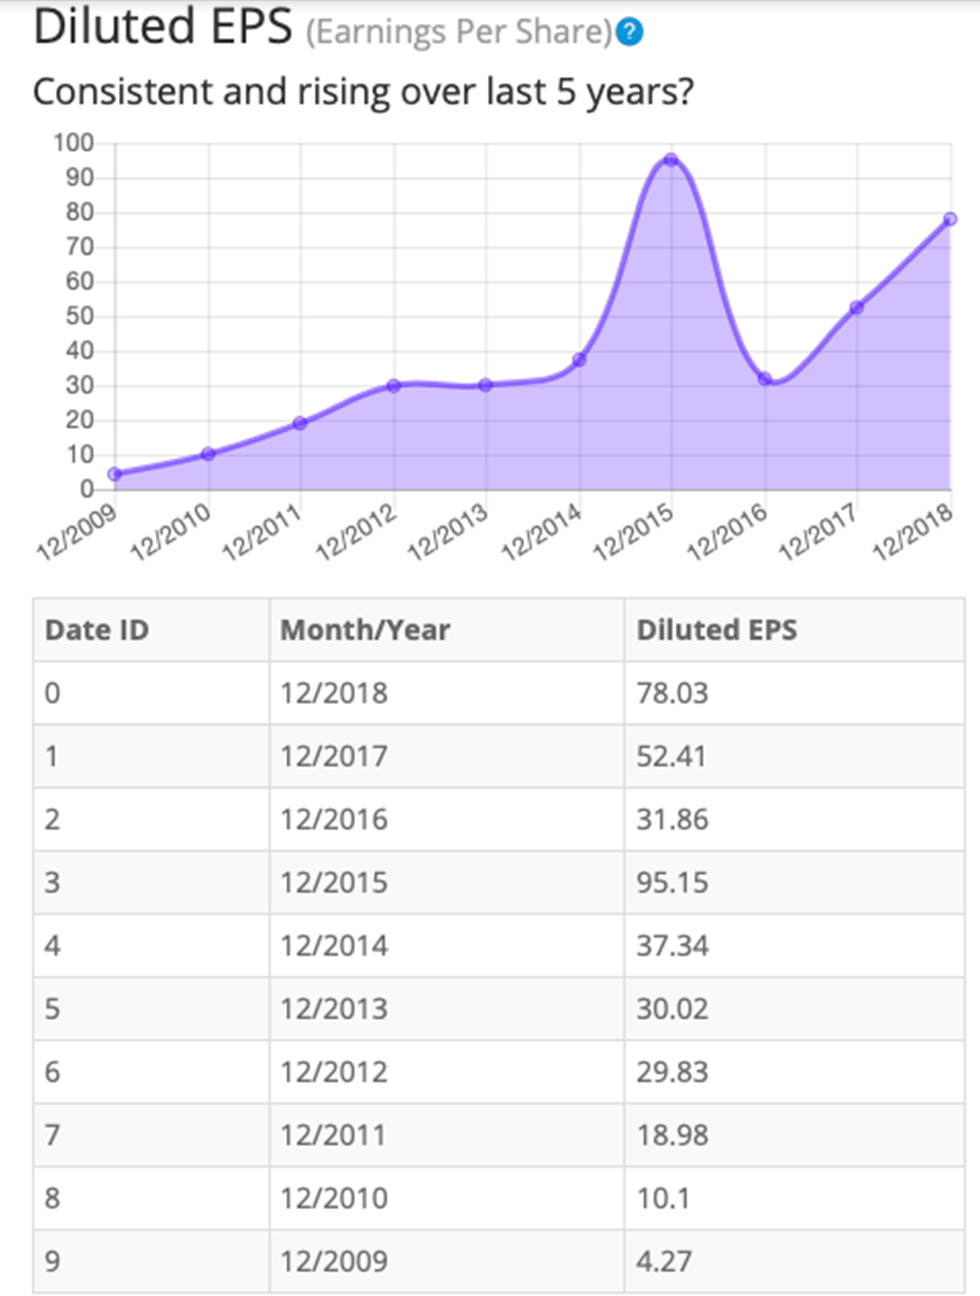
(Source: BTMA Stock Analyzer – EPS History)
Since earnings and price per share don’t always give the whole picture, it’s good to look at other factors like the gross margins, return on equity, and return on invested capital.
Return on Equity
The return on equity shows a spike in 2015, similar to the earnings history. Therefore, it’s better to be more conservative and focus on the ROE values after 2015. In years 2016 – 2018, the average ROE is 16.74. For return on equity (ROE), I look for an average of 16% or more. So BIDU just meets my requirements.

(Source: BTMA Stock Analyzer – ROE History)
Let’s compare the ROE of this company to its industry. The average ROE of 69 Information Services companies is 30.52%.
Therefore, Baidu, Inc.’s 5-year average of 26.00% and current ROE of 19.73% are below average.
Return on Invested Capital
The return on invested capital has been mostly increasing when disregarding 2015 as an outlier for special and one-time items that have affected ROIC. Five-year average ROIC is fine at around 17%. For return on invested capital (ROIC), I also look for a 5-year average of 16% or more. So BIDU just passes this test as well.
(Source: BTMA Stock Analyzer – Return on Invested Capital History)
Gross Margin Percent
The gross margin percent (GMP) has been decreasing over the last five years. Five-year GMP is good at around 54%. I typically look for companies with gross margin percent consistently above 30%. So BIDU has proven that it has the ability to maintain acceptable margins over a long period.
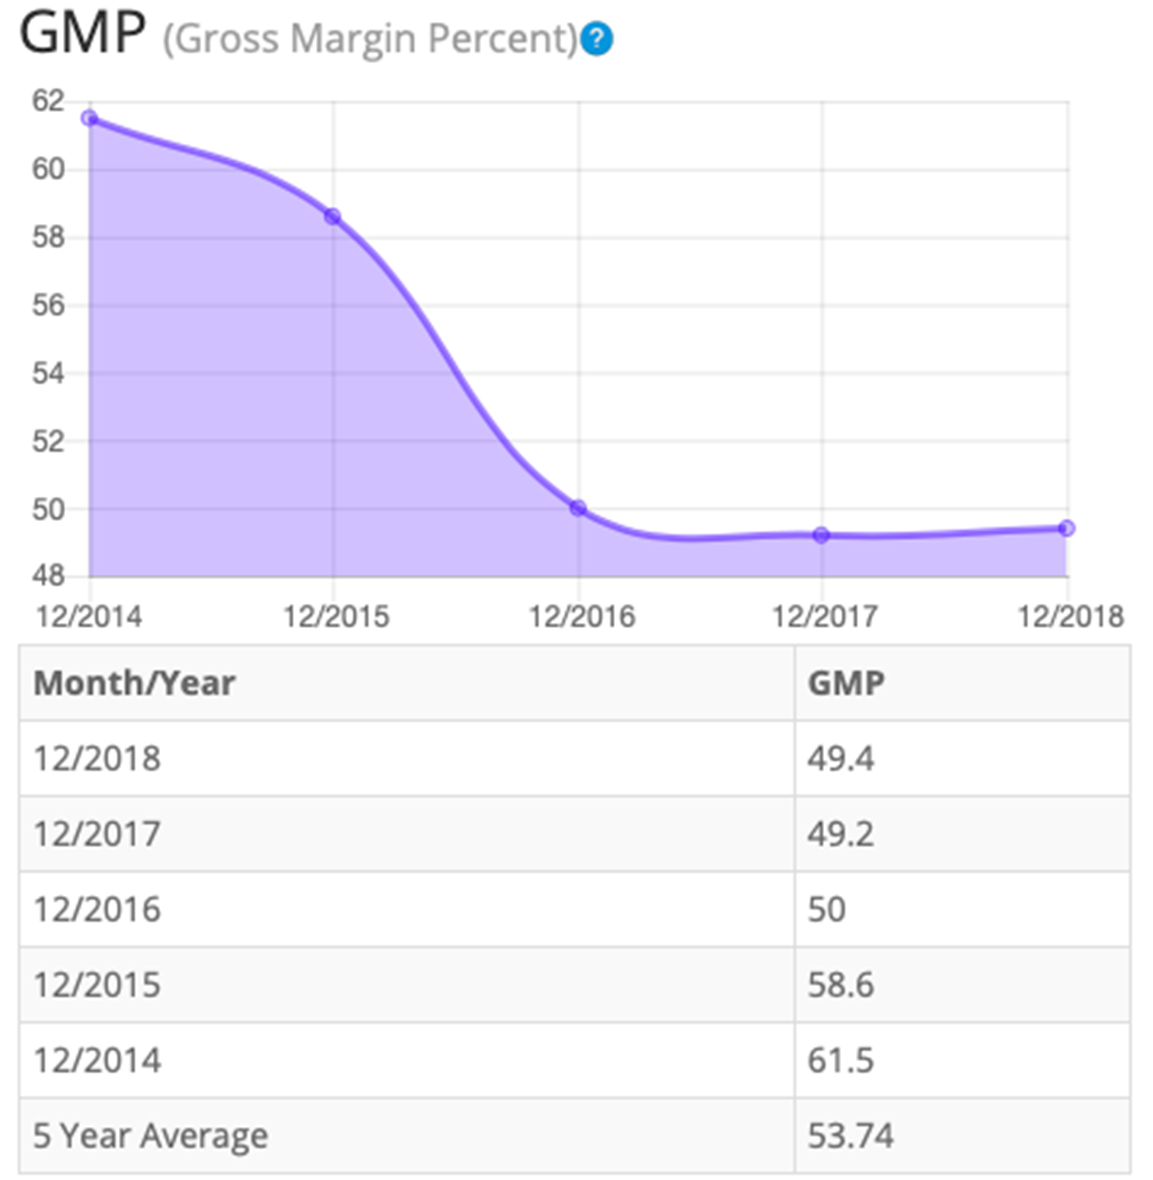
(Source: BTMA Stock Analyzer – Gross Margin Percent History)
Looking at other fundamentals involving the balance sheet, we can see that the debt-to-equity is less than 1. This is a good indicator, telling us that the company owns more than it owes.
BIDU’s Current Ratio of 2.59 is good, indicating that it has a good ability to use its assets to pay its short-term debt. Ideally, we’d want to see a Current Ratio of more than 1, so BIDU exceeds this amount.
According to the balance sheet, the company seems to be in good financial health. In the long term, the company seems fine in regards to its debt-to-equity. In the short term, the company’s financial situation soundly demonstrates it has the ability to repay short-term debt.
The Price-Earnings Ratio of 19.7 indicates that BIDU might be selling at a high price when comparing BIDU’s P/E Ratio to a long-term market average P/E Ratio of 15. The 10-year and 5-year average P/E Ratio of BIDU has typically been between 32 and 24, so this indicates that BIDU could be currently trading at a low price when comparing to BIDU’s average historical P/E Ratio range.
BIDU does not currently pay a regular dividend.
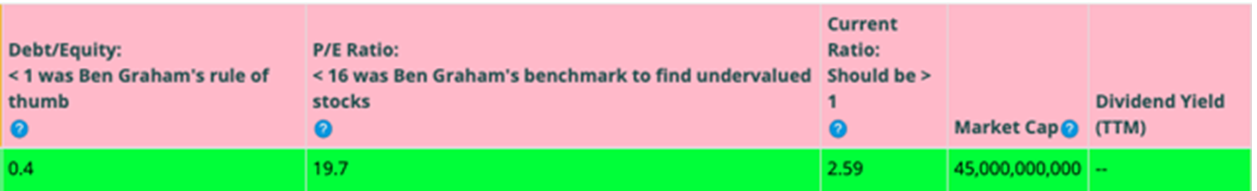
(Source: BTMA Stock Analyzer – Misc. Fundamentals)
Value Vs. Price
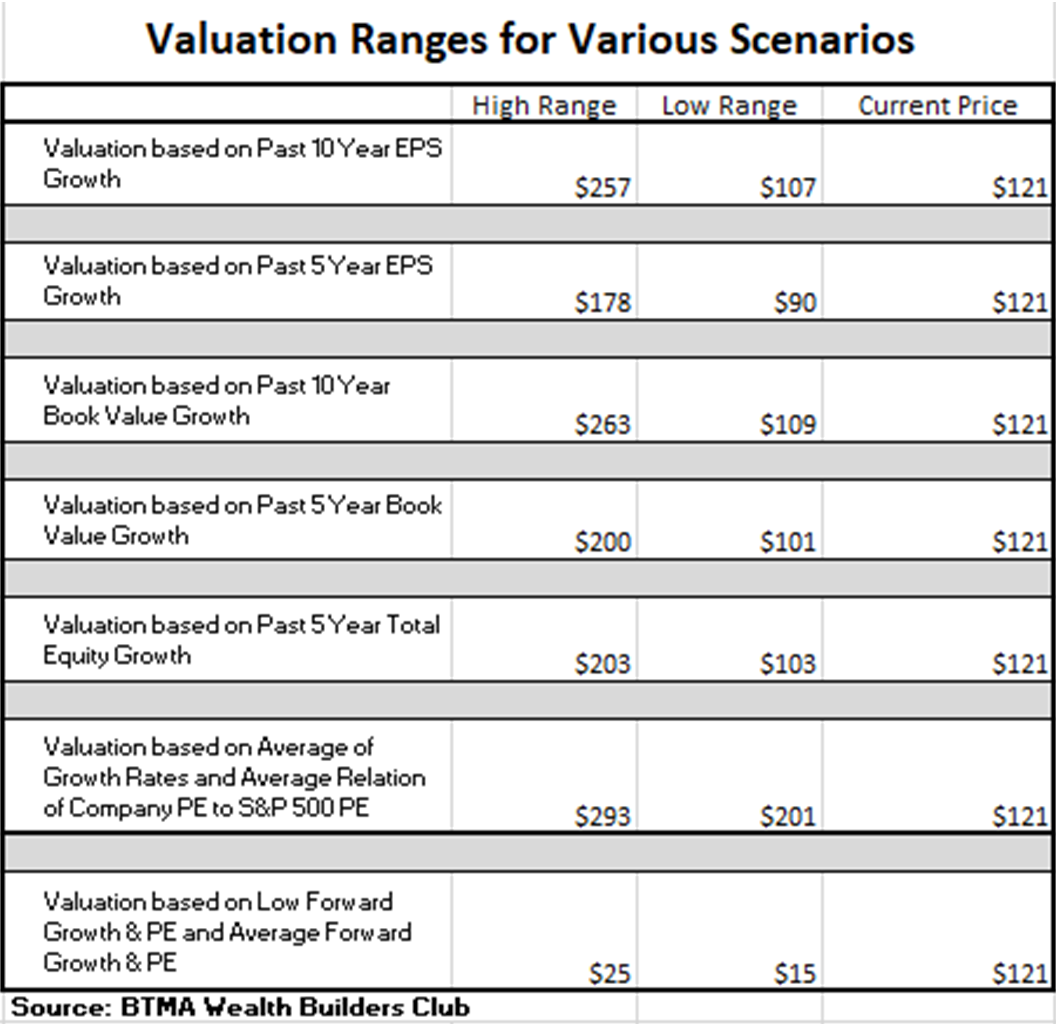
For valuation purposes, I will be using a diluted EPS TTM of 46.94. I’ve used various past averages of growth rates and P/E Ratios to calculate different scenarios of valuation ranges from low to average values. The valuations compare growth rates of EPS, Book Value, and Total Equity.
In the table below, you can see the different scenarios and in the chart, you will see vertical valuation lines that correspond to the table valuation ranges. The dots on the lines represent the current stock price. If the dot is towards the bottom of the valuation range, this would indicate that the stock is undervalued. If the dot is near the top of the valuation line, this would show an overvalued stock.
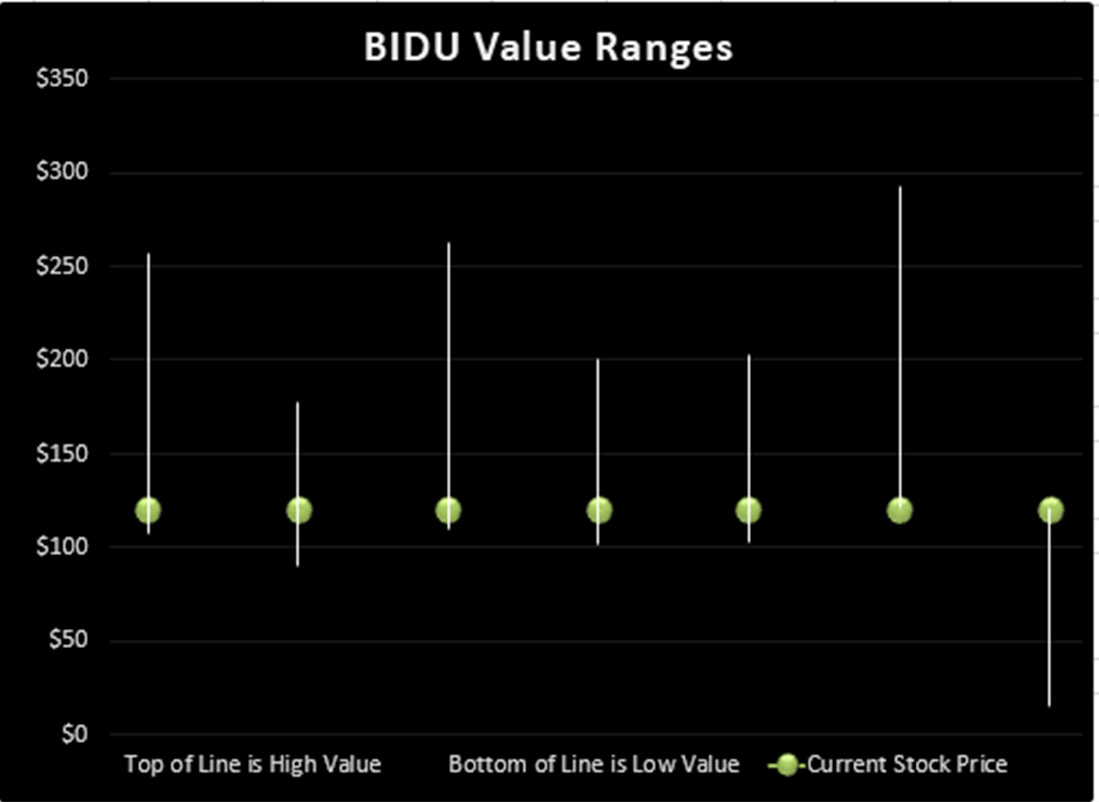
(Source: BTMA Wealth Builders Club )
According to this valuation analysis, BIDU is undervalued.
- If BIDU continues with a growth average similar to its past 10 years’ earnings growth, then the stock is undervalued at this time.
- If BIDU continues with a growth average similar to its past 5 years’ earnings growth, then the stock is undervalued at this time.
- If BIDU continues with a growth average similar to its past 10 years’ book value growth, then the stock is undervalued at this time.
- If BIDU continues with a growth average similar to its past 5 years’ book value growth, then the stock is undervalued at this time.
- If BIDU continues with a growth average similar to its past 5 years’ total equity growth, then the stock is undervalued at this time.
- According to BIDU’s typical P/E ratio in relation to the S&P 500’s P/E Ratio, BIDU is undervalued.
- If BIDU continues with a growth average as forecasted by analysts, then the stock is overpriced.
This analysis shows an average valuation of around $153 per share versus its current price of about $121, this would indicate that Baidu Inc. is undervalued. But this valuation amount is far from reliable because of two main reasons.
The past growth of the company has been immense, which doesn’t directly translate into the same kind of future growth, since the company is showing strong signs that growth has been slowing. This slowed growth is very evident when you compare the 10 year EPS growth (33%) by the much smaller 5 year EPS growth (15%).
Secondly, future forecasts are all over the board. But mostly the analysts are forecasting much lower growth and sometimes growth of -66% to -84%. These predicted growth rates are unreliable, but they are at least a warning that we could expect much lower future growth and that the valuation of the company cannot be based off of the astronomical growth of the past.
Forward-Looking Conclusion
According to the facts, Baidu is financially healthy in a long-term sense in having enough equity as compared with debt, and in the short term because the current ratio indicates that it has enough cash to cover current liabilities.
Other fundamentals are solid, including ROE, ROIC, and EPS.
Lastly, this analysis shows that the stock is undervalued, but also unreliable.
Future Potential Growth
To get an idea of future potential growth, let’s first look at actual 10 and 5 year return results of Baidu.
______________
10 Year Return Results if Invested in BIDU:
Initial Investment Date: 3/2/2010
End Date: 3/2/2020
Cost per Share: $51.89
End Date Price: $120.77
Total Return: 132.74%
Compound Annualized Growth Rate: 9%
_______________
5 Year Return Results if Invested in BIDU:
Initial Investment Date: 3/2/2015
End Date: 3/2/2020
Cost per Share: $205.04
End Date Price: $120.77
Total Return: -41.08%
Compound Annualized Growth Rate: -10%
_________________
From these scenarios, we have produced results from -10% to 9%. It’s not exactly a predictable company for returns. From these numbers it seems more like a stock that could make or break you.
The chart below will provide a visual perspective of how Baidu stock performed against the S&P 500 from 2007 to 2020.
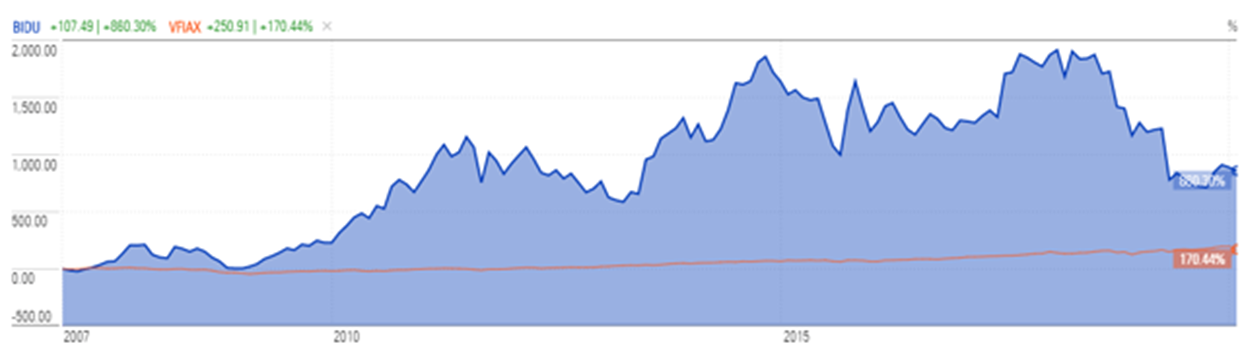
It’s obvious that Baidu experienced a huge amount of growth overall vs. the S&P 500. But also Baidu is much more volatile. During the 2008 recession, Baidu fell much more than the general market. Then in years following the company experienced highs and lows like a roller coaster running on rocket fuel!
For me, the choice is certain. I would take an objective look at this company and realize that Baidu, Inc. is a company with good overall fundamentals, but it is extremely unpredictable. Analysts are all-over the board trying to guess what will happen next for this stock and shareholders could be in the ride of their life (up or down) while holding this exciting investment that isn’t for the faint-hearted. Hopeful shareholders of Baidu better be ready for super high highs and heart-stopping drops. While I do see some great value potential in this company, I’m in search of more consistent and predictable companies. Therefore, I’ll let this roller coaster pass on by.
If you want to find good companies at bargain prices that will provide you with long-term returns and dividends or monthly swing trade profits, then my Seeking Alpha Marketplace service (Good Stocks@Bargain Prices) is a good match for you. I combine the proven methods of Warren Buffett’s and Benjamin Graham’s value investing with a practical system to apply these methods into today’s market.
Disclosure: I/we have no positions in any stocks mentioned, and no plans to initiate any positions within the next 72 hours. I wrote this article myself, and it expresses my own opinions. I am not receiving compensation for it (other than from Seeking Alpha). I have no business relationship with any company whose stock is mentioned in this article.
This Plunge for Stocks Makes No Sense. Here’s How We Know.
March 9, 2020 2:12 pm ET
There are big things for investors to worry about as the coronavirus spreads and the price of oil falls, but the fear is so widespread that the market’s response is looking indiscriminate.
As investors scramble for safety, prices for Treasury debt, seen as a haven, have surged. Yields on all Treasuries, from 2-year to 10-year to 30-year debt, have fallen below 1%.
Stocks have sold off, big time. The odd thing is that so far in March, stock in companies with the highest free-cash-flow yields—free cash flow per share divided by the share price—is getting hit harder than shares of firms less cash-generating ability.
Companies with less debt are getting hit harder in the market downdraft than companies with more debt. It feels backwards.
Businesses with less financial leverage and better cash flow should be able to weather economic turmoil better. But in the sell-first frenzy, everything has been taken down regardless of balance-sheet quality.
Free cash flow, of course, is similar to earnings, but it excludes noncash items, such as depreciation, that are used to calculate profits. Only actual cash items—the money that comes in the door through sales and goes out again for things such as wages and capital spending—counts.
Cash is king for a reason. Companies, and investors for that matter, can’t spend earnings. It takes cash to build plants, pay dividends, and weather economic turmoil.
So far in March, the most heavily indebted companies in the S&P 500 are down about 5%, while less-indebted companies are off about 6%. The drop for the companies with the strongest free cash flow is about 8% month to date. The drop for those with relatively weaker free cash flow is 6%.
For the index as a whole, the decline is 5.9%, while the average drop for S&P 500 companies is more than 7%. Don’t forget that the S&P 500 is weighted by market capitalization, so larger companies count for more. That 7% decline is the simple average of all 500 or so components, regardless of size.
Some of the outperformance of more-indebted companies can be explained away. Diamondback Energy (ticker: FANG) and Marathon Oil (MRO), for instance, don’t have too much debt relative to their peers, but their stocks are getting hammered, down 56% and 45% month to date, respectively. The collapse in the price of crude is a big problem for oil producers.
And several utilities have a lot of debt, but the industry often trades with bond yields. When bond yields fall, as they are now, bond prices rise. NextEra Energy (NEE), a utility stock, is up about 4.5% month to date.
Still, the overall action means one thing: Fear is dominating markets. That will create opportunities for investors down the road. Perhaps that is the silver lining for days like Monday.
The S&P was down 6.8% in afternoon trading. The Dow Jones Industrial Average was off 7.1%.
HI Financial Services Mid-Week 06-24-2014