
HI Market View Commentary 02-21-2022
What threats do we have to our markets today?
Russia attacking the newly declared by Russia Independence of two breakaway regions of Eastern Ukraine
The Biden Administration, Germany and France, United Nations,
Inflation
Consumer Spending is already slowing down = Inflation, Fear, No more free ride Stimulus Checks, No extra unemployment checks $300, Taxes will be larger this year as we’ve already received half the child tax credits, No more free rent CAN’T BE evicted
The next two months will suck = Means we are going to full collar trades, Adding the short call to make up the cost of the long puts
Need to protect DIS, F stock ownership
Need to add stock/index protection for leaps
Technically speaking IF you back out the stimulus and profits made from stimulus then the market could fall 72%
S&P 1885 number to 1739 range for FIB
We are mostly over to Schwab without holdovers during transferred
PYPL is it a good investment?
Ytd – 41.38% and trailing 12 months is down -62.81% SO…..is it down enough
Lowered Guidance after raising it, declining “eBay transactions”
People are choosing to use Apple Pay, Google Pay, Credit cards with rewards,
We see less payments to PayPal….. Due to a slowing economy
Use extra protection to make more on the way down until June, then use your cash pile to buy “SIGNIFICANTLY depressed stocks”
New positions to look at are Gas Stocks
Why is PE so high for the S&P 500 right now? Buybacks, Stimulus, Growth in Technology/Finance, Innovation
https://www.briefing.com/the-big-picture
The Big Picture
Last Updated: 18-Feb-22 14:20 ET
The stock market is lower priced, but it isn’t cheap
“The Stock Market Hasn’t Looked This Cheap in Nearly Two Years.” That was the headline for a piece we saw published in The Wall Street Journal earlier this week.
The observation is true. We just happen to disagree with the characterization.
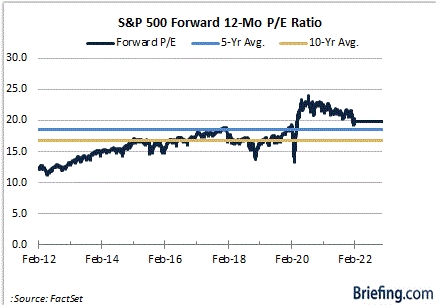
The stock market is sporting its lowest forward 12-month P/E multiple in nearly two years, yet that doesn’t necessarily mean that it’s “cheap.”
On the Contrary
When 2022 began, the S&P 500 was trading at 21.3x forward 12-month earnings. Today it trades at 19.2x forward 12-month earnings. Sounds like a nice discount, yet it is still a premium to the 5-year average of 18.6x and the 10-yr average of 16.7x.
The multiple compression is not because earnings estimates have gone up appreciably. On the contrary, it is because stock prices have come down appreciably.
As of this writing, the S&P 500 is down 8.6% year-to-date, whereas the forward 12-month EPS estimate has increased by 2.2%, according to FactSet.
Things would get “cheaper” from a P/E standpoint if stock prices keep sliding, yet the message of stock prices sliding more than earnings estimates is a telling one. It means investors don’t believe the stock price is justified by the underlying earnings — either the actual earnings or the expected earnings.
Since the stock market is a forward-looking entity, though, it often pertains to misgivings about expected earnings.
Those misgivings could revolve around rising interest rates, higher costs, weakening consumer confidence, disruptions in trade activity, a reduced wealth effect, declines in real disposable personal income, or even a military conflict.
Any of that sound familiar? It should, because all of that is in play right now as a source of upset for the bull market or, specifically, for the earnings growth outlook.
Peak Profit Margins?
Rising interest rates and higher costs are at the core of the market’s earnings concerns and rightfully so. Profit margins are at risk of contracting — and have already in many cases.
The question, though, is this: do current earnings growth estimates adequately represent what will come to fruition in the future? We have our doubts.
First, there is a lag effect with changes in interest rates. What goes up today (interest rates) will go down as an economic drag six months or so later, meaning analysts are likely still giving too much credit to earnings growth prospects in the second half of the year.
Also, don’t forget that other central banks are also removing policy accommodation, so the coming economic headwind won’t be just a U.S. issue.
Wage pressures are expected to remain elevated, too, because raises aren’t going to be rescinded if economic activity slows. That means either there will be profit margin pressures if employers don’t cut staff or it means there will be consumer spending pressures if employers do cut staff.
Neither is a support for the earnings growth outlook.
Of course, some will argue that an improving inflation picture in the second half of the year will mitigate some of the profit margin concerns. Perhaps, but we’re not there yet. Where we are is in an inflation morass that has continued to prove difficult to exit because of ongoing supply chain problems.
It all boils down to a view that we have likely seen peak profit margins for this cycle. Accordingly, investors’ willingness to pay a premium for every dollar of earnings is going to lessen and their approach to doing so will become more discriminating. That is the transition point to a stock picker’s market as opposed to a market — like last year’s market — that is more than happy to give a lift to all boats; hence, the bigger movement will happen below the index level.
Lots of Overhead Space
What we know today is that inflation is the highest it has been in nearly 40 years. The Fed hasn’t even started raising rates yet. What it has done is start talking about raising its policy rate and reducing the size of its balance sheet.
That communications guidance has gotten the market thinking some worrisome thoughts, namely that the Fed is well behind the inflation curve and will need to be aggressive with its policy shift, perhaps ushering in a recession.
A recession this year is not in our forecast, but suffice it to say, recessions are bad for earnings.
We digress.
The point is that a 10-yr note yield at 1.92% is a long way from being aligned with an inflation rate of 7.5% for CPI and 5.8% for the PCE Price Index. That is, it has ample overhead space to move to get in-line with an inflation rate that matches the Fed’s median PCE inflation projection of 2.6% for 2022, never mind anything that could prove to be higher than that.
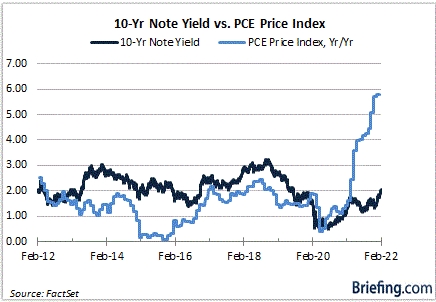
Interestingly, the 10-yr average yield for the 10-yr note is 2.04%. We’re not far from there today. Just as interesting, though, is that the 10-yr average forward 12-month P/E multiple is 16.7x — and with the inflation rate far lower than it is today over that period.
The current multiple of 19.2x forward 12-month earnings is approximately 15% higher than the 10-yr average, yet the current multiple is also based on earnings estimates that we think are still too high, so it may not be as “cheap” as some think it is.
If we use the 10-yr average multiple and today’s consensus estimate for forward 12-month earnings, we get an S&P 500 trading closer to 3,800.
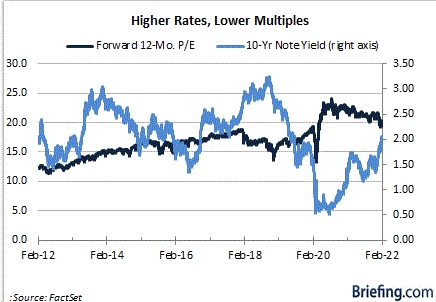
We’re not predicting a slide there, although it is not impossible. What can be seen in the chart below, though, is that the forward 12-month P/E multiple hasn’t been above 20x at any point over the last 10 years with the 10-yr note yield at 2.00% or higher.
What It All Means
This stock market could still have some pandemic excess to work off, either through a further price correction or with a time-based correction that manifests itself in a choppy, lateral consolidation phase. That’s because earnings estimates remain in question as the Fed goes to work to fight inflation.
The stock market, then, trades at a lower valuation that it did when the year began. That much is true. To say that it is “cheap,” though, before there has been any real normalization in interest rates, is still stretching it.
—Patrick J. O’Hare, Briefing.com
Where will our markets end this week?
Lower
DJIA – Bearish
SPX – Bearish
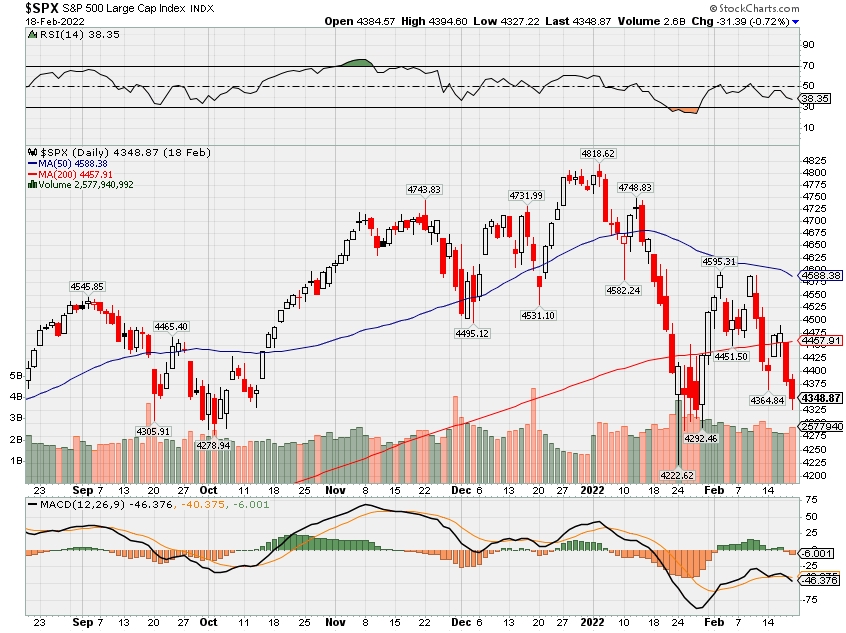
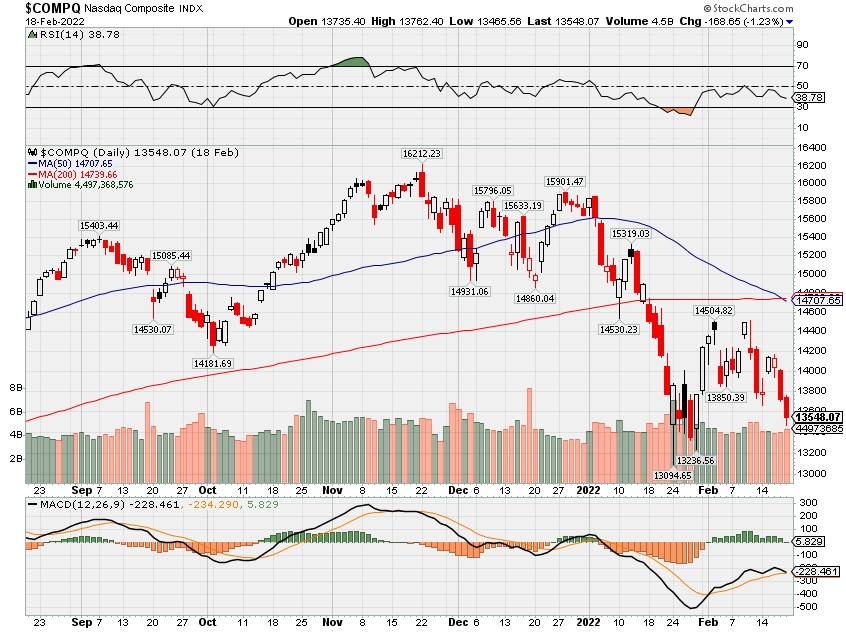
COMP – Bearish
Where Will the SPX end February 2022?
02-21-2022 -5.0%
02-14-2022 -3.0%
02-07-2022 -3.0%
01-31-2022 -3.0%
Earnings:
Mon: Presidents Day
Tues: HD, KBR, M, MOS, PANW, TOL, RIG
Wed: LOW, TAP, TJX, EBAY, HTZX, IMAX, VAC, NTAP,
Thur: BUD, LNG, DDS, NTES, AES, BYND, DELL, INTU, MNST, VMW, BABA, SQ
Fri: FL, IEP
Econ Reports:
Mon:
Tues: FHFA Housing Price Index, S&P Case Shiller, Consumer Confidence
Wed: MBA,
Thur: Initial Claims, Continuing Claims, GDP 2nd Estimate, GDP Deflator, New Home Sales,
Fri: Durable Goods, Durable ex-trans, PCE Prices, Core PCE, Personal Income, Personal Spending Michigan Sentiment
How am I looking to trade?
Long put protection AND Short calls to full collar trade has been added to certain stocks
www.myhurleyinvestment.com = Blogsite
customerservice@hurleyinvestments.com = Email
Questions???
Why are you adding short calls after the fact or tomorrow ? Huge volatility increase with Russia Invading
Stocks at risk of bearish ‘head-and-shoulder’ pattern, Bank of America chart analyst says

Jorge Sanz | LightRocket | Getty Images
The S&P 500′s choppy trading in recent months is falling into a pattern that could be bad news for investors, according to a Bank of America chart expert.
Stephen Suttmeier, the bank’s technical research strategist, said Tuesday in a note to clients that the market appears to be nearing the end of a “head-and-shoulder” trading pattern, which could mean a big drop is coming soon.
A head-and-shoulders pattern involves three peaks in quick succession, with the first and third topping out near the same level, while the second one briefly trades above that level. Chart analysts believe that if the stock falls from the third peak, breaking below that trading range, it could lead to a large pullback.
The S&P 500 is currently trading near 4,400 after trading around 4,600 a week ago, looking similar to a previous trading range from late November of last year — with a peak to roughly 4,800 in the middle.
“A bearish weekly reversal on a failed attempt to clear resistance at 4495-4565 … increases the risk for a 6-month head and shoulders top on the SPX. Staying below the shoulder peaks of 4565-4600 keeps this risky pattern intact,” Suttmeier’s note said.
https://datawrapper.dwcdn.net/x0R02/1/ If the market index does fall below the right-side shoulder, the S&P 500 could fall roughly 10% before finding serious support, Suttmeier said.
“A decisive break below the 4278-4222 area is the signal to confirm the head and shoulders top with deeper downside risk toward 4000 … and even into the 3800s,” the note said.
To be sure, chart analysis and trading patterns are not a guaranteed way to predict what comes next in the market. But many professional traders rely on the charts to inform their moves, and some algorithmic trading firms incorporate the analysis into their programs.
Global investors snap up Chinese stocks despite market declines
KEY POINTS
- International investment inflows to mainland Chinese stocks have increased since the fourth quarter, according to EPFR Global.
- The positive turn on sentiment comes as investment banks upgrade Chinese stocks.
- However, the data shows global emerging markets funds have increased their allocations more to India than mainland China, amid uncertainty about regulation and economic growth.
BEIJING — International investors are putting more money into Chinese stocks, even as local investors have remained cautious on the mainland markets.
Mainland Chinese stock funds saw net inflows of $16.6 billion in January — only the fourth time since the pandemic that monthly inflows have exceeded $10 billion, according to research firm EPFR Global. That followed nearly $11 billion in net inflows in December, the data showed.
“Investor interest in China has actually strengthened coming into the fourth quarter of last year,” Cameron Brandt, director of research at EPFR, said in a phone interview last week. “The driver there I think is a perception — especially among institutional investors — that in the emerging markets space, China is, for a variety of reasons, something of a safe play this year.”
The latest wave of buying is from institutions, rather than retail investors whose interest in China dropped off since early last year, Brandt said.
The divergent interest comes as global investment firms have turned increasingly positive on mainland Chinese stocks in the last several months.
Analysts are betting, in part, that Beijing wants to ensure growth in a year the ruling Chinese Communist Party is set to choose its next leaders at a national congress in the fall. At the same meeting, President Xi Jinping is expected to take on an unprecedented third term in power.
“Everything will need to look quite to perfection for [such] a monumental event,” Jason Hsu, chairman and CIO of Rayliant Global Advisors, said in a phone interview last week. “For anyone who is a rational investor, this is probably as favorable a sentiment as you’re going to get.”
China has also become “a good contrarian play” this year because the local market is entering a period of stimulus and easier policy, while the U.S. Federal Reserve embarks on a tightening cycle, Hsu said.
Goldman Sachs and Bernstein are so optimistic that they each released lengthy reports in the last few weeks recommending mainland Chinese stocks, also known as A-shares.
The upbeat calls come despite worries about how regulatory uncertainty may have made those stocks “uninvestable.”
“We believe China A shares, a US$14tn asset class, have become more investable given the ongoing liberalization and reform measures in the Chinese capital markets,” Goldman’s chief China Equity Strategist Kinger Lau and his team said in an 89-page report Sunday.
In the last 18 months, Beijing has cracked down on alleged monopolistic practices by Chinese internet companies and property developers’ high reliance on debt, among other issues. The sometimes abrupt policy changes have surprised global investors.
Global emerging markets funds have turned to India in the meantime, EPFR data showed.
“Managers of funds who run diversified funds, they’re less enthusiastic about China, certainly relative to other markets,” Brandt said.
Average allocation to China has fallen from 35% of the portfolio in the third quarter of 2020 to 27% as of Jan. 1, according to Brandt. During the same period, he said the funds’ allocation to India rose from 8.5% to 12.7%.
Market pessimism in China
Although the mainland Chinese stock market is the second largest in the world by value, it differs significantly from that of the U.S., the world’s largest.
Speculative retail investors rather than institutions dominate the mainland market, which for years has drawn comparisons to a casino.
But there have been signs of progress.
In a sign of how the market is maturing, index giant MSCI decided in 2018 to add some China A-shares to the benchmark MSCI Emerging Markets Index. The move forced international funds tracking the index to buy more A-shares. But retail investors still dominate the mainland market by far.
Our overall view is this year, [the] China market is not an easy bull market. It’s more likely to be buying on hope and selling on fact and results.
Winnie Wu
CHINA EQUITY STRATEGIST, BANK OF AMERICA SECURITIES
Weak onshore sentiment, along with better opportunities in developed markets, have contributed to J.P. Morgan Asset Management’s neutral view on Chinese stocks since early last year, Sylvia Sheng, global multi-asset strategist at the firm, said in a phone interview Monday.
She said if growth improves in the second quarter, sentiment could turn as well, noting: “We are actually looking to get more positive on Chinese equities.”
The Shanghai composite is up about 3% for February to-date after a week-long closure for the Lunar New Year holiday. The index had kicked off the year with a decline of 7.65% in January — its worst month since October 2018. Last year, the index posted relatively muted gains of 4.8%.
Everyone’s sentiment on investing in A-shares has dropped significantly, Schelling Xie, senior analyst at Stansberry China, said in a phone interview Friday. He pointed to uncertainty about the degree of change on regulation and economic growth.
Although some economists have said the worst of China’s regulatory crackdown is over, they also said it doesn’t mean a reversal or an end to new rules.
It will take time for the market to rebuild confidence, but it is not appropriate to be overly pessimistic right now, Xuan Wei, chief strategist of China Asset Management, said in a note. He added that there are opportunities in new energy and technological growth stocks.
China opening to foreign finance
While analysts assess Chinese stock performance, the mainland market increasingly offers business opportunities for international investment firms.
The financial industry is one of the few areas in which Beijing has relaxed ownership restrictions in the last few years. The policy changes have allowed BlackRock, Goldman Sachs and UBS among others to buy full control of their local securities or mutual fund operations.
“One of the reasons why we’re bullish is we work in an area where China has really opened up in a big, big way,” said Brendan Ahern, chief investment officer of KraneShares. The firm sells one of the primary U.S.-listed exchange-traded funds that tracks Chinese internet stocks, KWEB.
“In general, I think there’s this disparity between what the Chinese think about China and what foreign investors think about China,” Ahern said.
KWEB is up 3.8% for the year so far after dropping by more than 50% in 2021. Hong Kong’s Hang Seng index is up about 5.5% year-to-date, while the Shanghai composite is down about 4.7%.
Overseas investors generally “like to buy China for growth” rather than banks and other industries with many state-owned enterprises, said Winnie Wu, China equity strategist, Bank of America Securities.
However, she noted the state-owned businesses have led recent outperformers, a trend she doubts can lead to sustained gains for the market.
“Our overall view is this year, [the] China market is not an easy bull market,” she said. “It’s more likely to be buying on hope and selling on fact and results.”
10 Stocks Warren Buffett Is Selling (And 7 He’s Buying)
Berkshire Hathaway CEO Warren Buffett ended 2021 like he started it: selling. But while he unloaded plenty in Q4, he also added a few new interesting stakes.
by: Dan Burrows
February 14, 2022
Ford’s Mustang Mach-E beats Tesla’s Model 3 as Consumer Reports’ top electric vehicle for 2022
KEY POINTS
- The designation is further validation of Ford CEO Jim Farley’s belief the company can not only compete with Tesla but also beat Elon Musk when it comes to EVs.
- Consumer Reports says reliability data it has collected shows the Mach-E has very few problems, so far.
- That data, along with owner reviews and testing conducted by the nonprofit group, prompted Consumer Reports to make the Mach-E its “Top Pick” for an electric vehicle.
Ford’s Mustang Mach-E, the automaker’s bold bet to lead its transformation into selling more electric vehicles, replaced the Tesla Model 3 as Consumer Reports’ “Top Pick” for an electric vehicle in 2022.
The designation is further validation of CEO Jim Farley’s belief Ford can not only compete with Tesla but also beat Elon Musk when it comes to EVs.
Jake Fisher, senior director of automotive testing at Consumer Reports, says he was impressed with the Mach-E as soon as the nonprofit group bought it. “Not only is it a really fun vehicle to drive, it is sporty, but it is also extremely mature,” Fisher told CNBC. “When I say that it rides nice, it is very quiet. I mean it really feels well built.”
Consumer Reports says reliability data it has collected shows the Mach-E has very few problems, so far. That data, along with owner reviews and testing conducted by Consumer Reports, prompted it to make the Mach-E its 2022 “Top Pick” for an electric vehicle, replacing the Tesla Model 3.
Consumer Reports is still recommending the Model 3, but Fisher says the small electric car fails to match the Mach-E in certain areas, most notably when it comes to hands-free driving and alerting drivers who fail to pay attention. Ford’s BlueCruise system uses a camera to monitor and alert drivers when they are not paying attention. The Model 3 also has a camera watching the driver, but Consumer Reports says that camera could be more effective.
“In our tests we can cover up the camera, we could not look at the road and it really doesn’t give any alerts to the driver to make sure they are looking where they are going,” says Fisher.
Overall, Tesla fell seven spots to 23rd place in Consumer Reports ranking of 32 major auto brands. It’s the poorest showing in the seven years Tesla has been included in the “Top Picks” issue.
In addition to concerns about Tesla’s Autopilot system, Consumer Reports is critical of the automaker’s steering yoke, a change from the steering wheel in the Model S and Model X. Fisher says using the yoke is frustrating. “It is not just about making it harder to turn the wheel, but they also got rid of the turn signal stalk,” he said.
Fisher added that the quality of the “Top Picks” for 2022 are better than ever, with the brands once again dominated by Japanese automakers. Subaru was rated No. 1, followed by Mazda, BMW, Honda and Lexus. At the bottom of the list this year are Mitsubishi and GMC, just above Jeep which was the lowest-rated brand.
CNBC’s Meghan Reeder contributed to this report.
Cathie Wood says her innovation stocks are ‘way undervalued’ and recent fund losses temporary
Cathie Wood of Ark Invest said Thursday the technology companies in her innovation-focused portfolio are drastically undervalued, and she believes that her fund’s recent sell-off is short-lived.
“We’ve had a significant decline,” Wood said Thursday on CNBC’s “Halftime Report.” “We do believe innovation is in the bargain basement territory. … Our technology stocks are way undervalued relative to their potential. … Give us five years, we’re running a deep value portfolio.”
Her flagship fund Ark Innovation ETF was caught in the epicenter of the tech-driven sell-off in 2022, down 26% year to date. Some of her big holdings, including Zoom, Teladoc Health and Roku, have tumbled as much as 70% this year on expectations of rising interest rates.
“Our biggest concern is that our investors turn what we believe are temporary losses into permanent losses,” Wood said.
Higher rates typically punish growth pockets of the market that rely on low rates to borrow for investing in innovation. And their future earnings look less attractive when rates are on the rise.
Wood said she doesn’t invest in any of those mature Big Tech companies like Microsoft. ARKK bets on companies in the forefront of disruptive technology in a variety of industries from DNA to automation, robotics and artificial intelligence. Her top holdings include Tesla, Exact Sciences, UiPath and Coinbase.
“Today we have investors doing the opposite of what they did in the late ’90s. They are running for the hills. It’s risk-off because of inflation and interest rates. And the hills are their benchmarks. They are running to the past,” Wood said.
“If we are right and the disruptive innovation that is evolving is going to disintermediate and disrupt the traditional world order, those benchmarks are where the risk is. Not our portfolios,” she added.
Despite the big underperformance, her ARKK has attracted more than $70 million in net inflows year to date, according to FactSet.
The innovation investor said she believes the inflationary drag on growth stocks will end ultimately and that deflationary forces will return.
“A lot of what’s going on is supply chain related,” Wood said. “I do think the deflationary forces building in the economy are pretty strong.”
Dow sheds more than 200 points Friday, stocks fall for two straight weeks as Russia-Ukraine tensions roil markets
U.S. stock indexes fell Friday and notched a second consecutive losing week as the Russia-Ukraine conflict put investors on edge.
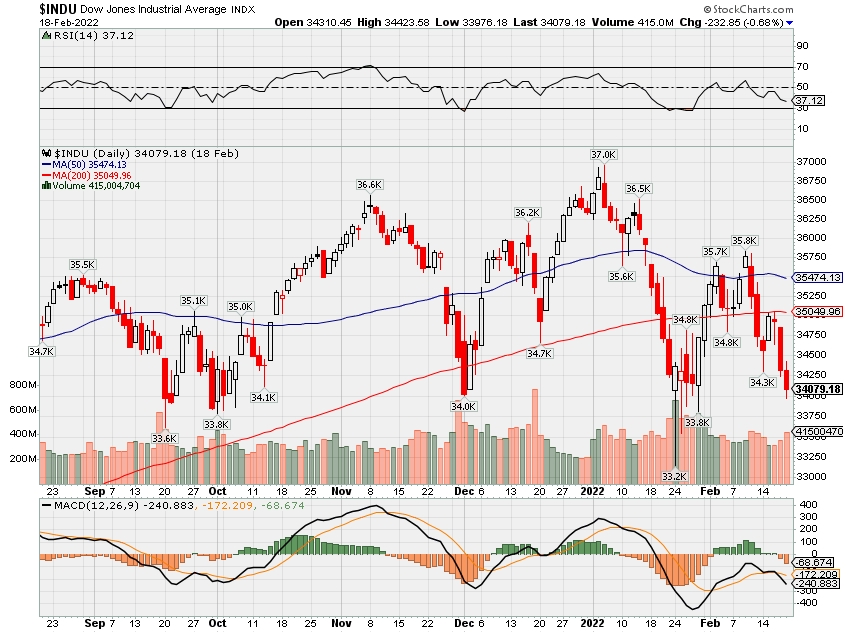
The blue-chip Dow Jones Industrial Average shed 232.85 points, or 0.7%, at 34,079.18. The S&P 500 lost 0.7% to close at 4,348.87. The Nasdaq Composite retreated 1.2% to 13,548.07.
The indexes each lost more than 1% this week.
Ongoing tensions between Russia and Ukraine continued to drive market action. The Wall Street Journal reported midday Friday that U.S. officials expect an attack from Russia in a few days. President Joe Biden is expected to move more U.S. troops closer to Ukraine, NBC News reported.
Secretary of State Antony Blinken speaking to the United Nations on Thursday warned that the situation is at a “moment of peril.”
“Investors are having a hard time holding onto risk as the likelihood that the standoff between the West and Russia will ultimately lead to some ground conflict,” Oanda’s Edward Moya said in a note Friday. “Wall Street will remain jittery until we see a major de-escalation.”
Friday was particularly volatile with trillions of dollars in options and futures on stocks, indexes and ETFs set to expire. Option expiration days, which generally occur on the third Friday of the month, can cause the market to swing in a wide range as these positions are closed out.
WTI crude oil and natural gas dipped Friday, and energy stocks eased. Schlumberger lost 2.2% and Devon Energy was nearly 1% lower.
Intel was the biggest laggard on the Dow, down 5.3%. Bank of America reiterated an underperform rating on the stock.
Roku shares dropped 22.3% after the video-streaming company reported a revenue miss and issued weaker-than-expected guidance.
Investors have also been grappling with the outlook for Federal Reserve policy. St. Louis Fed President James Bullard, who had just called for aggressive action, warned that inflation could get out of control without rate hikes.
New York Fed President John Williams on Friday said he didn’t see any compelling reason to take a big step at the beginning, but the central bank could decide later to speed up.
“Whether it’s geopolitics, whether it’s the labor market, whether it’s supply disruptions — no matter what you look at, everything is pointing to inflation being front and center,” Rich Bernstein, Richard Bernstein Advisors CEO, told “Closing Bell” on Friday.
Growth stocks rule in Goldman screen of biggest retail investor buys and sells
Feb. 21, 2022 11:12 AM ETNVIDIA Corporation (NVDA), AMD, AMZN, BABA, AAPLBNTX, BIDU, SNAP, T, SNOW, SHOP, ROKU, MRNA, BAC, GOOGL, GOOG, C, AAL, UAL, UNH, PLTR, PFE, NKE, CRM, COST, HD, MDT, MU, WMT, ABBV, UBER, JPM, BA, VZ, PYPL, V, DIS, FB, MSFT, TSLA, GME, AMC, IBB, XLI, XLY, XLK, IWV, SPY, IWMBy: Kim Khan, SA News Editor44 Comments

ipopba/iStock via Getty ImagesRetail investors continue to favor growth names over value and lean to tech, according to Goldman Sachs’ new report on retail buy and sell activity.
“We estimate retail investors were net buyers of $7 billion in Russell 3000 (NYSEARCA:IWV) stocks since the volatility spike on 24-Jan-2022,” John Marshall, Goldman head of derivatives strategy, and team wrote in a note. “The vast majority of flows have been into S&P 500 (NYSEARCA:SPY) stocks with a small amount into Mid-cap (outflows from Russell 2000 (NYSEARCA:IWM) names). This analysis helps to explain the significant underperformance of Russell 2000 vs the S&P 500.”
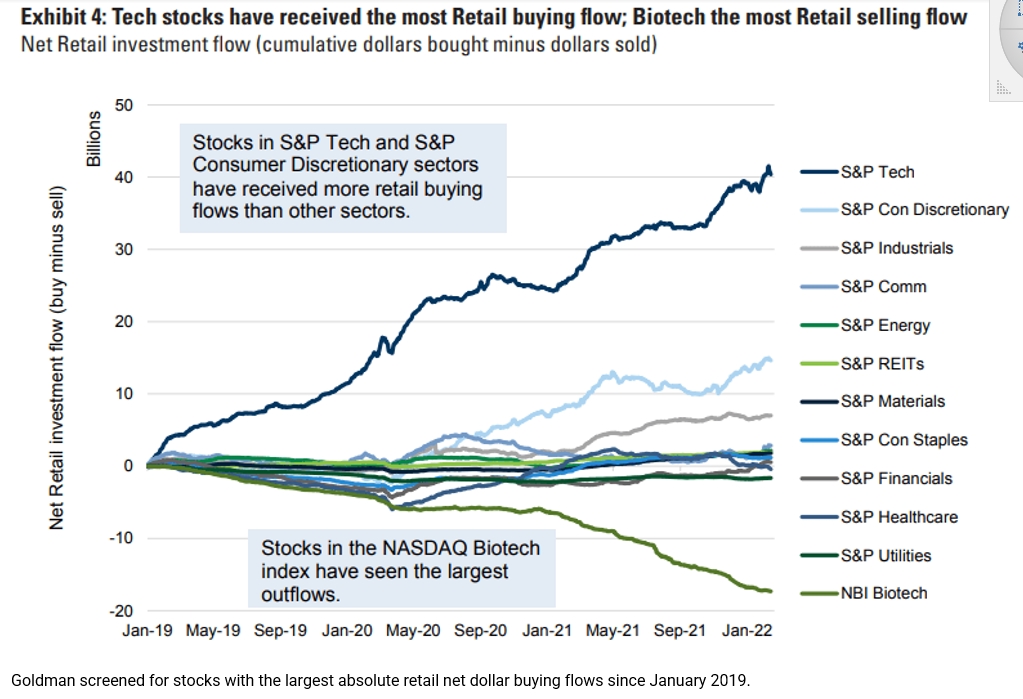
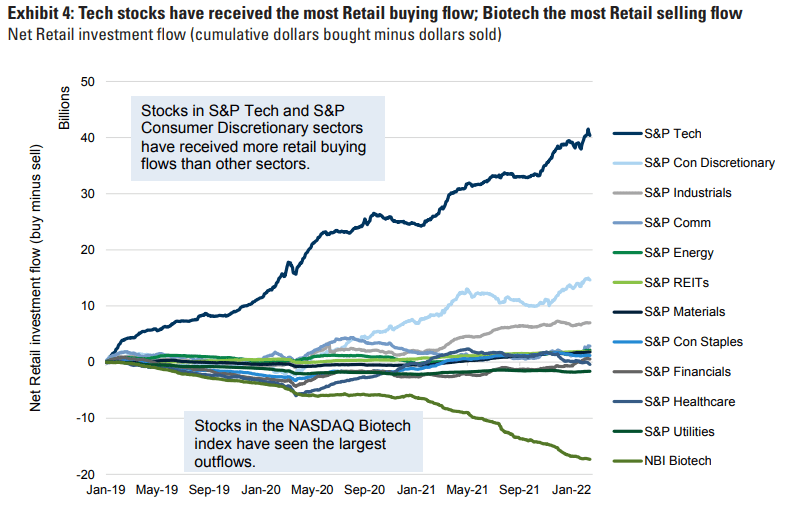
Lookings at sector inflows and outflows, Info Tech (NYSEARCA:XLK) remains the outsized favorite, followed by Consumer Discretionary (NYSEARCA:XLY) and Industrials (NYSEARCA:XLI). Biotech (NASDAQ:IBB) is still the least favorite by a wide margin.
“Biotech outflows are consistent with their smaller average size; however, we note that the cumulative outflows from Biotech ($17b) are larger than the entire cumulative outflow from all Russell 2000 constituents ($15b) over the full period,” Marshall said. “Retail selling has correlated with significant underperformance of the Biotech sector over the past year.”
Goldman screened for stocks with the largest absolute retail net dollar buying flows since January 2019.
As a percentage of market cap, the top buys are meme favorite AMC (NYSE:AMC), GameStop (NYSE:GME) and AMD (NASDAQ:AMD).
Biggest buys since January 2019:
- Nvidia (NASDAQ:NVDA), cumulative retail buying $10.4B, % of market cap 4.4%
- AMD (AMC), $9.5B, 23.2%
- Amazon (NASDAQ:AMZN), $9.2B, 0.7%
- Tesla (NASDAQ:TSLA), $7.3B, 0.7%
- Microsoft (NASDAQ:MSFT), $6.4B, 0.4%
- Apple (NASDAQ:AAPL), $5.9B, 0.6%
- Meta (NASDAQ:FB), $5.4B, 0.9%
- Disney (NYSE:DIS), $3.6B, 1.5%
- Visa (NYSE:V), $3.5B, 1%
- PayPal (NASDAQ:PYPL), $3.3B, 1.2%
- Verizon (NYSE:VZ), $2.8B, 1.2%
- Boeing (NYSE:BA), $2.7B, 2%
- JPMorgan Chase (NYSE:JPM), $2.5B, 0.7%
- Uber (NYSE:UBER), $2.2B, 3.4%
- AbbVie (NYSE:ABBV), $2.2B, 1.4%
- Walmart (NYSE:WMT), $2.1B, 0.5%
- Micron (NASDAQ:MU), $2.1B, 4%
- Medtronic (NYSE:MDT), $2B, 1.4%
- Home Depot (NYSE:HD), $1.8B, 0.7%
- Costco (NASDAQ:COST), $1.7B, 1.2%
- Salesforce (NYSE:CRM), $1.7B, 0.9%
- Nike (NYSE:NKE), $1.7B, 1%
- AMC (AMC), $1.7B, 121.1%
- Pfizer (NYSE:PFE), $1.6B, 0.8%
- Palantir (NYSE:PLTR), $1.6B, 4.9%
- UnitedHealth (NYSE:UNH), $1.5B, 0.4%
- GameStop (GME), $1.5B, 31.4%
- United Airlines (NASDAQ:UAL), $1.4B, 14.6%
- American Airlines (NASDAQ:AAL), $1.4B, 20.7%
- Citi (NYSE:C), $1.4B, 1.1%
It also screened for biggest buy and sell flows over the last three months.
Biggest buys:
- Nvidia (NVDA), $4.49B
- Amazon (AMZN), $2.24B
- Tesla (TSLA), $1.68B
- Microsoft (MSFT), $1.38B
- Disney (DIS), $936M
- Meta (FB), $654M
- Boeing (BA), $495M
- JPMorgan Chase (JPM), $492M
- Alphabet (NASDAQ:GOOG) (NASDAQ:GOOGL), $482M
- Bank of America (NYSE:BAC), $400M
Biggest sells:
HI Financial Services Mid-Week 06-24-2014