
HI Market View Commentary 02-03-2020
| Market Recap |
| WEEK OF JAN. 27 THROUGH JAN. 31, 2020 |
| The S&P 500 limped into the close last Friday as fears of a global contagion reverberated through financial markets and rekindled worries of a potential worldwide recession resulting in the worst week for the S&P in six months. New cases of the coronavirus outside of China and the quarantine of more than 45 million Chinese overshadowed upbeat earnings from bellwether stocks like Apple (AAPL), Amazon (AMZN), Starbucks (SBUX), Microsoft (MSFT) and Tesla (TSLA), and wiped out all of its gains for 2020.
The benchmark index closed the week at 3,225.52 down from 3,295.47 last week and down from 3,230.78 at the end of December. Although geopolitical events weighed on the index as a whole, there were a few standouts thanks to better-than-expected fourth-quarter results, primarily in the technology sector. Amazon was catapulted to its highest level on record – surpassing the $1 trillion market cap – on earnings that crushed Wall Street’s expectations. The rally came despite a selling frenzy in stocks that sent the S&P index more than 58 points lower from the prior day’s close. But while the technology sector was insulated from most of the week’s sell-off, the consumer discretionary sector, down 0.5%, felt the full weight of the fallout from the coronavirus. Carnival Corp (CCL) and Royal Caribbean (RCL) both lost as much as 9% in value this week as investors punished both stocks for a quarantined cruise ship in Italy. Of the eleven sectors, energy shares suffered the biggest losses amid fears that the quarantine of 3% of China’s population will undermine economic growth. In sympathy with a 4.6% drop in the price of West Texas Intermediate this week, the energy sector was down 5.5% from last Friday’s close with component stocks Exxon (XOM) down 6.2% and Chevron (CVX) down 4.2% from last week. After the energy sector, the worst performing sectors were materials, down 3.5% and healthcare, off 3.2%. Utilities was the only sector to end the week positive, up 0.9%. Provided by MT Newswires. |
What I want to talk about today?
So lets talk about the stock market frustrations of the last week and why some rules are for fools
Obviously I’m grateful for earnings to have protection on for core positions but I’m frustrated that I wouldn’t take more profits off the table and maybe do a better job protecting ALL long call/stock replacement positions.
We took profits on leap long call positions (100%+) and will re-enter positions here soon
Understand that rules in stock market trading are for fools –
Goal make as much money as you can while taking as little risk possible
My Rules
Let positions run when bullish
I use limit orders to exit option trades to get my desired ROI
I’m not comfortable with the irrationality and I’m not sure IF I’m willing to risk being insolvent or straight stock positions without using protection
The Corona Virus minus the lime/worm is an opportunity to lower cost basis, reposition profitable options positions to give them more time, that we can enter new positions at a lower cost basis than a week ago !!!
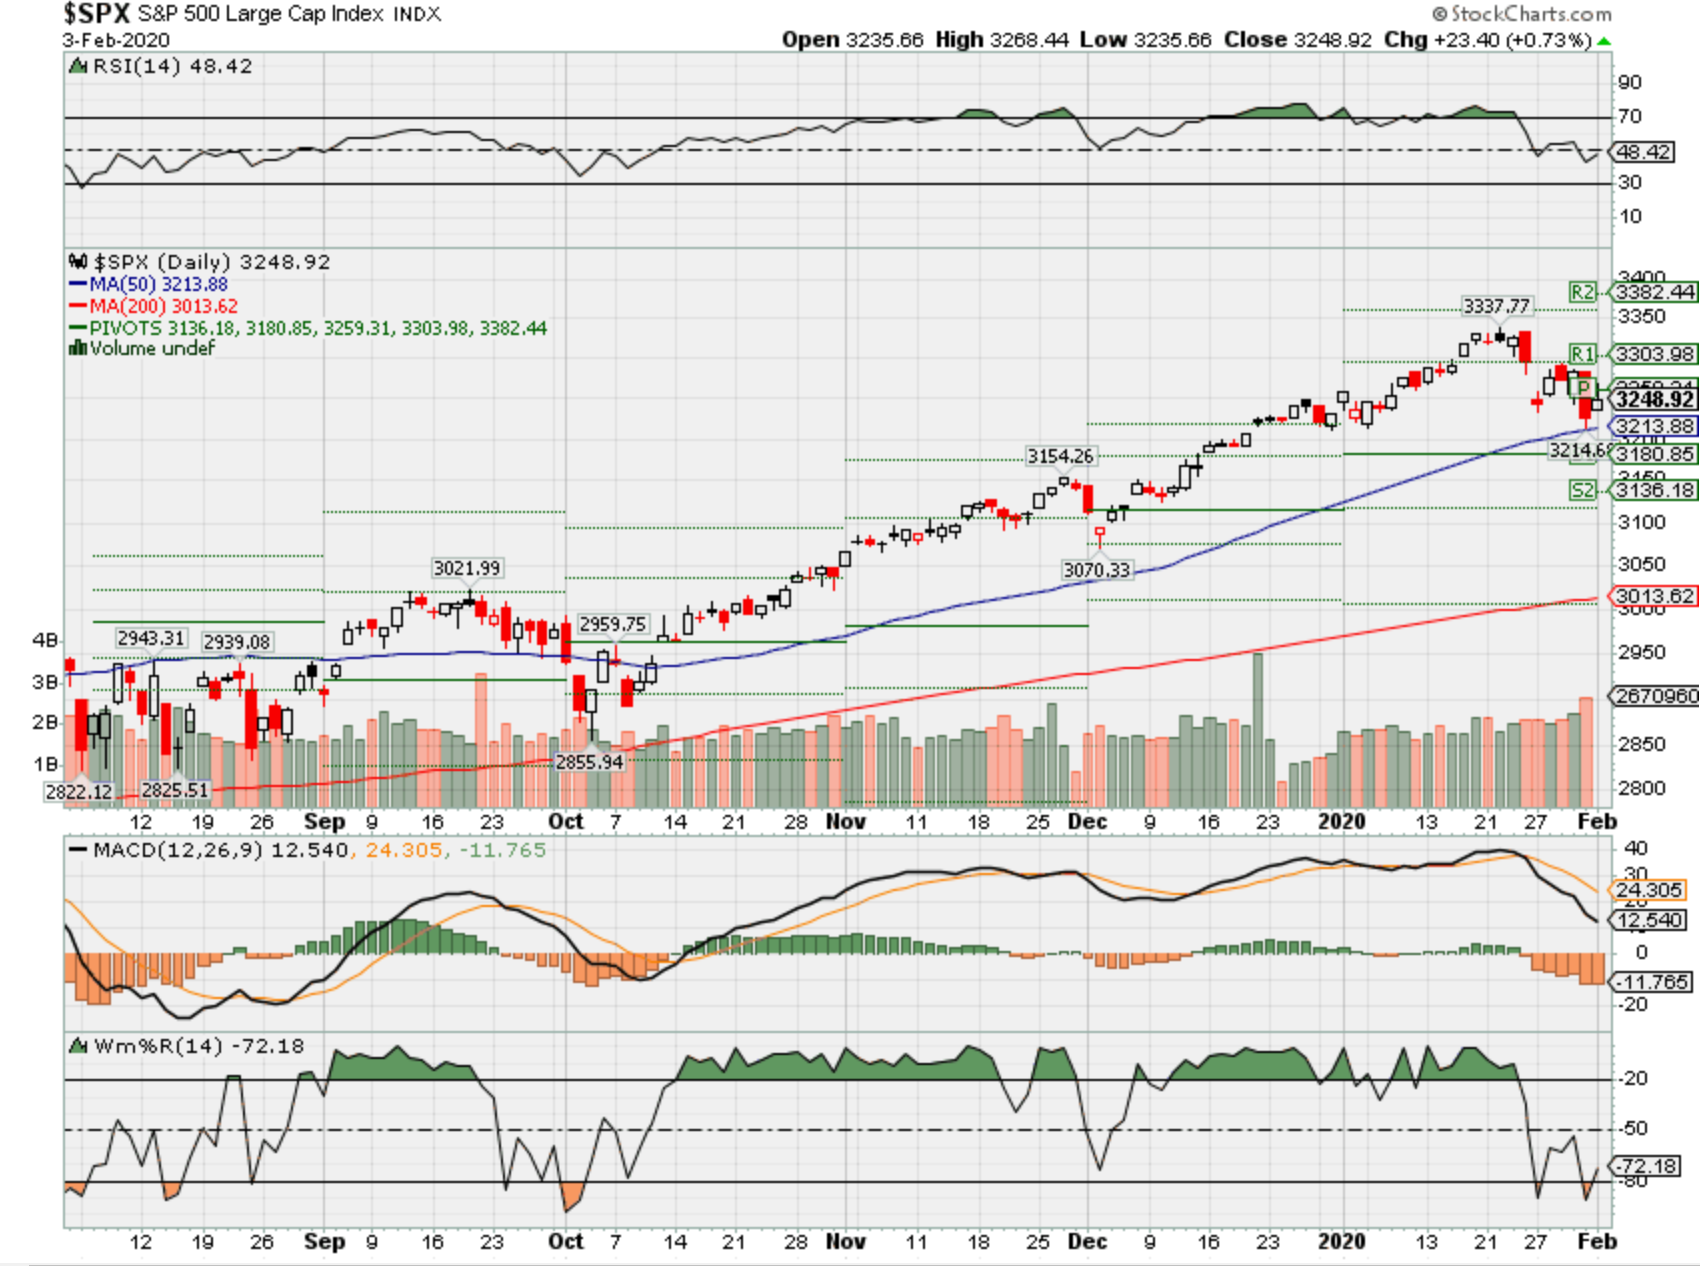
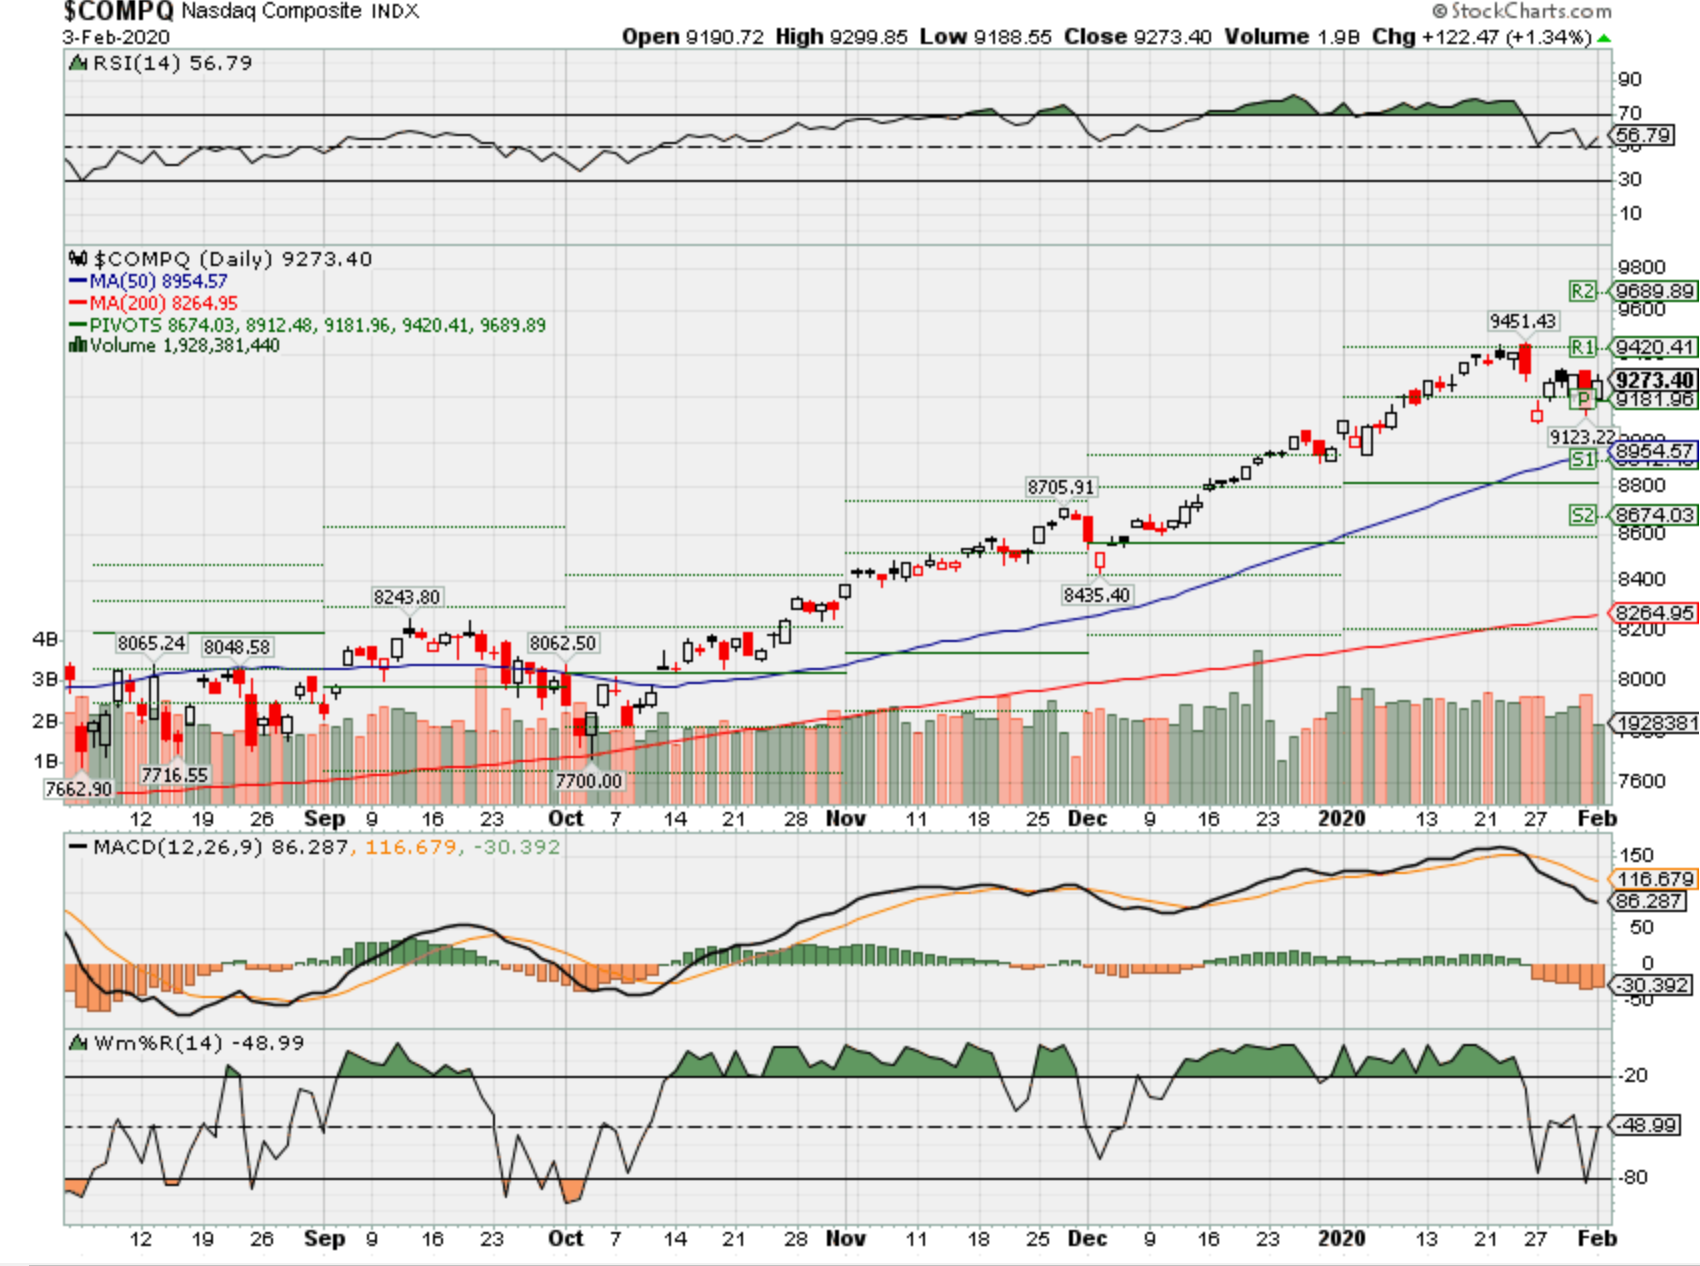
Where will our markets end this week?
Lower
DJIA – Bearish 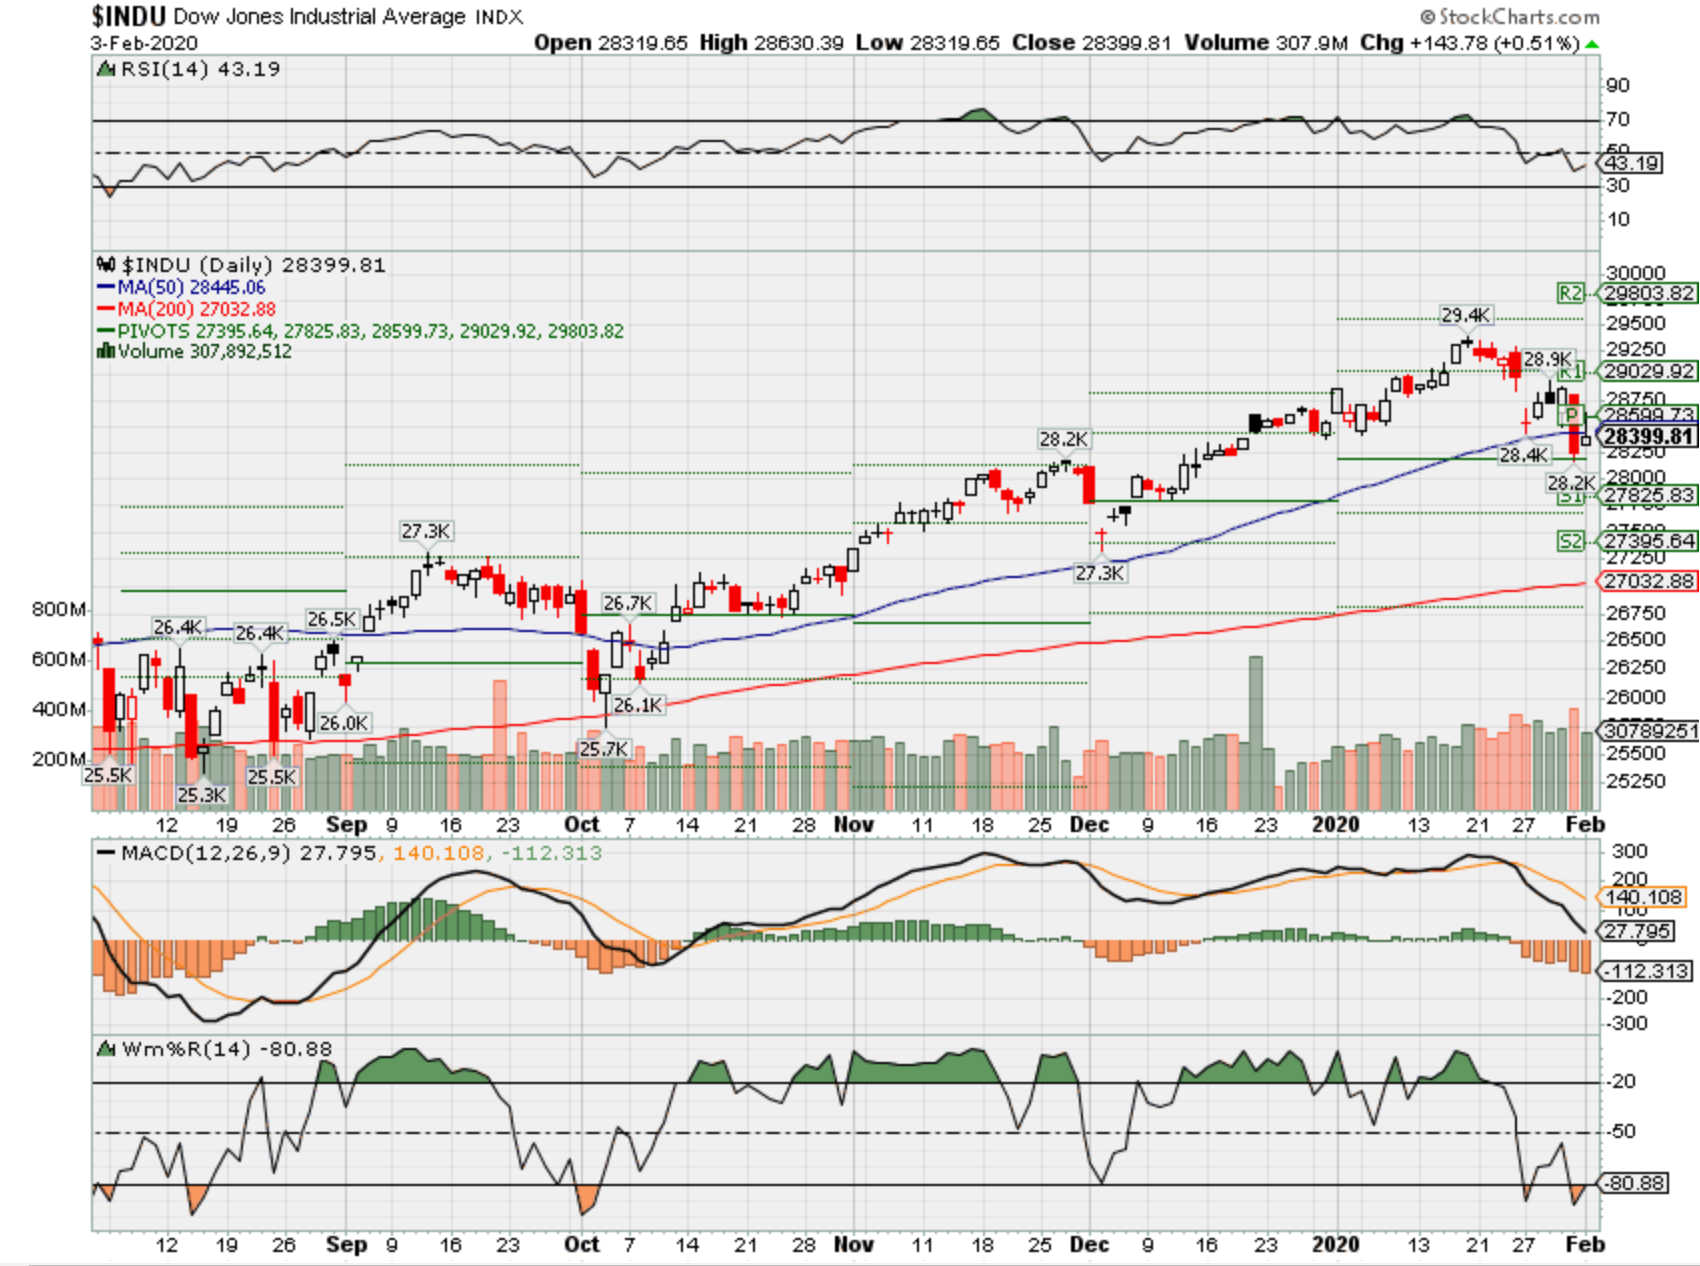
SPX – Bearish
COMP – Bullish
Where Will the SPX end February 2020?
02-03-2020 -2.0%
Earnings:
Mon: GOOGL
Tues: CLX, COP, CMI, EMR, MCK, RL, ALL, CB, ETH, GILD, SNAP, F, DIS
Wed: BSX, GM, HUM, MRK, FEYE, GPRO, MET, QCOM, YUMC, ZNGA
Thur: ARCH, BMY, EL, K, TWTR, TUM, TMUS, UBER
Fri: GOOS
Econ Reports:
Mon: Auto, Truck, Construction Spending, ISM Manu
Tues: Factory Orders
Wed: MBA, ADP Employment, Trade Balance
Thur: Initial, Continuing, Productivity, Unit Labor Costs,
Fri: Average Workweek, Non-Farm Payroll, Private Payroll, Unemployment Rate, Hourly Earnings, Wholesale Inventories, Consumer Credit
Int’l:
Mon: CN: Caixam Manufacturing PMI
Tues –
Wed – ECB Pres Lagardre Speech
Thursday – ECB Pres Lagardre Speech
Friday-
Sunday –
How am I looking to trade?
Earnings are coming up and protecting through earnings with protective puts and NO short Calls
AOBC – 3/05 est
BA – 1/29 BMO
BIDU – 2/27 est
CVS – 2/12 BMO
DIS – 2/04 AMC
F – 2/04 AMC
MRO – 2/12 AMC
MU – 3/19 est
NEM – 2/20 BMO
TGT – 3/03 est
UAA – 2/13 est
www.myhurleyinvestment.com = Blogsite
customerservice@hurleyinvestments.com = Email
Questions???
https://seekingalpha.com/article/4320550-facebook-q4-results-changed-nothing-still-15-annual-return
Facebook: Q4 Results Changed Nothing; Still 15%+ Annual Return
Feb. 3, 2020 8:00 AM ET
Summary
Facebook’s 19Q4 revenue growth deceleration was not a surprise, being part of longstanding guidance that was reiterated at last quarter’s results.
Robust operational metrics point to the continuing strength of Facebook’s ecosystem, and the potential for a still-strong 15%+ revenue CAGR.
While management’s outlook implies a slightly down EBIT in 2020 due to expense growth, we expect margins to stabilise thereafter.
We expect Facebook’s EPS CAGR to be 15%+, valuation multiples to be stable, and the share price to grow in line with EPS with a 15%+ CAGR.
At $209.53, Facebook’s valuation multiple is similar with other high-quality large caps despite its higher growth. We reiterate our Buy rating.
This article was highlighted for PRO+ subscribers, Seeking Alpha’s service for professional investors. Find out how you can get the best content on Seeking Alpha here.
(We previously wrote about Facebook as “Blue Sky Capital“)
Introduction
Facebook (FB) shares fell 6.1% on Thursday, the day after the release of its 19Q4 results, with most negative headlines focusing on its slowing growth. However, we believe that FB’s robust operational metrics in fact support our original investment case (“Facebook: Multi-Year Double-Digit Earnings Growth After 2019“) and that, despite the near-25% return in the 11 months since our initiation, FB shares remain a long-term compounder capable of delivering a 15%+ average annual investor return over time.
Q4 Growth Deceleration Not A Surprise
After 19Q4 results, most negative headlines focused on FB’s ad revenue growth slowing to “only” 24.6% year-on-year (26.4% in constant currency), from the high 20s level it saw in the first 3 quarters of 2019:
| FB Ad Revenue Growth Year-on-Year (2017-19)
Source: FB company filings. |
However, this deceleration in revenue growth was not a surprise, and had in fact been part of longstanding management guidance, including being reiterated at last quarter’s results. On the 19Q3 call, FB’s CFO guided to a “mid-to-high single digit” sequential deceleration in revenue growth for 19Q4, and the actual deceleration of 4.0% (from 28.6%) was within this range:
“We continue to expect a more pronounced deceleration of our revenue growth rate in Q4. We expect our Q4 reported revenue growth rate will decelerate by a mid-to-high single digit percentage compared to our Q3 rate. This deceleration is largely driven by the lapping of several successful product optimizations in Q4 of last year, as well as ad targeting related headwinds. Since these factors are largely unique to Q4, we would expect our revenue growth deceleration in 2020 versus the Q4 rate to be much less pronounced.”
David Wehner, Facebook CFO (19Q3 Earnings Call)
Similarly, the outlook for 2020 has remained unchanged from last quarter, when management guided for growth to continue decelerating in 2020 but in a “less pronounced way” than in Q4. As FB’s CFO stated on the call this week:
“I would … characterize the outlook as .. unchanged for 2020 .. I gave fairly explicit guidance on low- to mid-single-digit decel(eration) compared to the (2019) Q4 rate in (2020) Q1. So I don’t think there’s … any big change in outlook on 2020 in Q4 or coming out of the Q4 results.”
David Wehner, Facebook CFO (19Q4 Earnings Call)
Long-Term 15%+ EPS CAGR
While a slower growth rate was always inevitable as FB grows in size, we believe the company can sustain an EPS Compounded Annualised Growth Rate (“CAGR”) of 15%+ in the medium term, based on both FB’s still-strong revenue growth potential and its natural operational leverage.
FB’s still-strong revenue growth potential is demonstrated by operational metrics that have again been robust in 19Q4, as we will show below.
FB’s operational leverage is a result of a cost base that is relatively fixed even as revenue grows, as incremental ad impressions can be delivered with little extra cost, and the price of ads continues to rise. Much of the cost increases we have seen since 2018 have been an one-off step change, the result of FB catching up on privacy- and security-related capabilities following public controversies. While current guidance points to a further margin contraction in 2020, we believe margins will eventually stabilise (likely after 2020) or even expand, just as we have seen in similar businesses.
Operational Metrics Remain Robust
FB’s robust operational metrics in 19Q4 point to the continuing strength of its ecosystem, and the potential for revenue CAGR to remain at 15%+.
Ultimately FB’s revenues are driven by its number of users, the level of user engagement, and the value of FB ad products to advertisers. Metrics reflecting these key drivers continue to be favourable in 19Q4 .
In terms of the number of users, Facebook-only Monthly Average Users (“MAU”) grew 7.7% year-on-year and 2.0% quarter-on-quarter in 19Q4, with a positive growth in every region, even in the most mature U.S. & Canada region (which was up 0.4% sequentially):
| Facebook-Only Monthly Active Users (Since 2017)
NB. Facebook and Messenger only; exclude Instagram and WhatsApp. Source: FB company filings. |
User engagement, as measured by the DAU/MAU (“DAU” is Daily Average Users) ratio, was stable quarter-on-quarter globally, with every region improving except for APAC (which was down a small 10 bps in Q4 after a strong 60 bps increase in Q3):
| Facebook-Only DAU/MAU Ratio (Since 2017)
NB. Facebook and Messenger only; exclude Instagram and WhatsApp. Source: FB company filings. |
Reassuringly, even the most mature U.S. & Canada market continued to see DAU and MAU growing in 19Q4, and its DAU/MAU ratio has remained stable:
| Facebook-Only DAU/MAU Ratio – U.S. & Canada (Since 2017)
Source: FB company filings. |
To demonstrate the growth of newer apps such as Instagram and WhatsApp, management has introduced new metrics that cover the FB’s family of apps rather than just Facebook, Family Monthly Average People (“MAP”) and Family Daily Average People (“DAP”). Both MAP and DAP have continued to rise, reaching 2.9bn and 2.3bn respectively in December, and the level of engagement is actually higher due to the nature of the newer apps, with Family DAP/MAP at 78% in Q4, higher than Facebook-Only DAU/MAU at 66%:
| Facebook Family MAP and DAP (Since 18Q4)
Source: FB company filings. |
Ad revenue per MAU, which is the result of user engagement and the value of FB ad products to advertisers, also continues to show strong growth in 19Q4. Ad revenue per MAU grew 15.7% year-on-year, with the U.S. & Canada region (which already has highest figure) growing 18.6%, and Europe and APAC both growing above 20% (Rest of World was slightly lower at 17.4%):
| FB Ad Revenue Per MAU ($) (Since 2017)
Source: FB company filings. |
The U.S. & Canada region has the highest average revenue per user, because it is the most pure-play developed market region (whereas Europe includes both Eastern Europe and Turkey), and the highest penetration for products such as Instagram. The gap between the U.S. & Canada and other regions shows the size of the revenue potential that still remains globally.
Mid-Teens EBIT Growth in 19Q4
Notwithstanding the negative media coverage, FB still managed to grow its EBIT by mid-teens year-on-year in 19Q4.
Driven by robust operational metrics described above, FB’s financial performance was strong in Q4. Revenues grew 24.6% year-on-year, with ad revenue growth driven by a 31% increase in the number of ad impressions, offset by a 5% drop in average price per ad, due to the growth in lower-priced ads in Stories and non-U.S. regions. EBIT grew 13.3% even after the accrual of “most” of the cost of a $550m settlement with the state of Illinois on a privacy-related lawsuit; excluding this, Q4 EBIT growth was likely near 20%:
| FB 19Q4 Results – Group Key Items
NB. FTC settlement accruals of $3bn in 19Q1 and $2bn in 19Q2; one-off $1.1bn tax expense in 19Q2 after unfavourable tax ruling; Illinois settlement costed $550m in total, “most” of which accrued in 19Q4 but “some” in prior quarters. Source: FB company filings. |
For full-year 2019, Facebook grew revenues 26.6% year-on-year and, excluding the $5.0bn settlement with the FTC fine and an $1.1bn expense from an unfavourable tax ruling, grew its EBIT by 16.3%.
2019 EPS growth was 12.9% (excluding the FTC and tax ruling costs), lower than EBIT growth due to a higher effective tax rate. FB’s effective tax rate was 25.5% in 2019, partly because settlement costs are not tax-deductible, and is expected to be only “high teens” in 2020.
2020 Outlook
FB’s 2020 outlook remains unchanged and implies a slightly down EBIT in 2020, but we believe this may be conservative and, in any case, expect margins to stabilise after 2020.
Management guidance is for year-on-year revenue growth in 20Q1 to decelerate from 19Q4 by a “low-to-mid single digit percentage point”; FB has indicated previously that 2020 year-on-year revenue growth is expected to decelerate from 19Q4 but in a “much less pronounced” way than the decline in Q4. 2020 expenses are to be $54-59bn, the mid-point of which implying an approx. 37% growth from 2019 (excluding the $5.55bn settlement costs with the FTC and Illinois). If we assume a 20% revenue growth for full-year 2020, then the guidance implies a small 4.1% decline in EBIT (Adjusted):
| FB Illustrative P&L (from Management Outlook)
Source: FB company filings, Librarian Capital estimates. |
Our working assumption is for margin to contract in 2020 but to stabilise thereafter, still giving a 15%+ EBIT CAGR over the medium term, given FB’s ability to grow revenues with a CAGR of 15%+.
FB management is also known to be conservative on guidance – for example, 2019 expenses were originally guided to grow 40-50% year-on-year at the 18Q4 earnings call, but only ended up growing 33%. There is a meaningful chance that 2020 revenue and/or expenses would be much better than guided.
Valuation
At $209.53, on 2019 financials, FB shares are on a P/E of 24.5x and a Free Cash Flow (“FCF”) Yield of 2.4% (excluding the net cash on the balance sheet, which is worth 8% of the current market capitalisation):
| FB Net Income & Cashflows (2014-19A)
Source: FB company filings. |
FB’s valuation is similar to that of many high-quality large cap stocks, but FB has much stronger growth potential. Given FB’s strong growth and our “lower for longer” expectations on interest rates, we believe FB’s current valuation multiples are reasonable.
Since our initial Buy rating in March, FB shares have returned nearly 25%, outperforming the S&P 500 (SPY) but slightly behind Alphabet (GOOG):
| Facebook Share Price vs. Alphabet & S&P 500 (Since 06-Mar)
Source: Yahoo Finance (31-Jan-20). |
Conclusion
FB’s revenue growth deceleration in 19Q4 was not a surprise, and was within the range of longstanding management guidance. Its robust operational metrics support our belief in a long-term revenue CAGR of 15%+. While 2020 may see some margin contraction, we expect margins to stabilise thereafter, leading to EBIT and EPS also growing with CAGR of 15%+.
At $209.53, FB shares on a P/E of 24.5x and a FCF Yield of 2.4%, similar to many high-quality large cap stocks that have less growth potential.
We expect FB’s valuation multiples to be stable, and its share price to grow in line with its EPS, i.e. with a 15%+ CAGR over time.
FB is a unique asset and will continue to be a multi-year compounder. We reiterate our Buy rating.
Note: A track record of my past recommendations can be found here.
Disclosure: I am/we are long FB. I wrote this article myself, and it expresses my own opinions. I am not receiving compensation for it (other than from Seeking Alpha). I have no business relationship with any company whose stock is mentioned in this article.
https://seekingalpha.com/article/4320271-i-bought-apple-in-2013-now-selling-is-why
I Bought Apple In 2013: Now I’m Selling, Here Is Why
Jan. 30, 2020 2:35 PM ET
Summary
I first bought Apple in 2013 and added in late 2015 and 2018 during dips in the stock price.
Apple stock has been very good to me over the past several years, but the estimated forward returns have become too low for me to continue holding the stock.
I sold my Apple stock this week and will be looking to reallocate my funds while I wait for Apple’s price to trade at a lower valuation.
Introduction
I have been a long-term Apple (AAPL) shareholder and bullish on the stock for nearly seven years. I first purchased the stock as a value investment for my then three-year-old daughter’s custodial account in the summer of 2013 for about $59 per share, split-adjusted. That purchase has done very well for her and has contributed a substantial sum toward her college education, a down-payment on a house, or her retirement someday.
Data by YCharts
The total return on that first Apple investment has been almost 500%, about 4x that of the S&P 500 over the same time period.
I wasn’t finished buying Apple. For my son, who is two years younger than my daughter, I made a second purchase of Apple stock in late 2015 at a price around $109.
Data by YCharts
Again, this investment has produced fantastic returns over the past four years, returning about 3x the S&P 500 index.
And I made one last Apple investment on 12/14/18 during the market correction, this one for my Roth retirement account.
Data by YCharts
And once again, I was able to more than triple the returns of the S&P 500 index.
I imagine that I’m somewhat unique in that I made so many deliberate Apple investments, yet have never purchased a single Apple product. My kids have a second-hand iPad and a Mac desktop they received from their grandparents, and my wife has used Macs for years as a graphic designer, but I, much like Warren Buffett, don’t own an iPhone. I’m hardly an Apple fanboy.
But the fact is, up until recently, Apple stock has been a good value, and one would have to be blind in order not to see the devotion Apple fans have for their products. I first noticed it back in 2013 when I went back to graduate school. College students loved their Apple products. Their MacBooks and iPhones brought them a joy that few other things in life seemed to bring them, and walking in between classes their eyes were always buried in their phones. These phones had become similar to what a car had been to teenagers when I was growing up. The trend didn’t seem like a fad to me, even though I wasn’t participating (and still don’t use a smartphone to this day).
But 2020 is a new year. Apple stock is not only no longer cheap, it has gotten expensive. And this week, I sold all of my shares.
Apple’s Valuation
This is, surprisingly, the first article on SA I’ve written about Apple despite it being one of the two largest positions in my portfolios for the past several years. (The other being Berkshire Hathaway (BRK.B), which also holds a large stake in Apple.) The reason I haven’t previously covered Apple is that the company is fairly difficult to value, and whenever possible, I like to keep my SA articles focused mostly on the numbers and less on speculation and stories about what might happen in the future. In fact, each time I purchased Apple stock, the news and expectations for the company were horrible at the time. And I didn’t buy the stock because I had some wonderful story about Apple with which to counter the negative stories, I bought it because the price was cheap, and the forward returns looked good so long as nothing absolutely terrible happened.
So, I lacked a positive story when bought Apple, just as I lack a negative story now that I’m selling. But when I made my Apple purchases, I considered them speculative, even though I thought the price was cheap. The reason for that is because with the invention and launch of the iPhone around 2007, Apple became a very different company than it was before then. So, starting around that time, I felt like Apple needed to be treated as a ‘new’ business. And this meant that an investment in Apple was speculative. Here’s why.
Part of my stock valuation process is to include earnings growth for a full economic cycle. I even call them “full-cycle analyses”. Any full cycle analysis must, in my opinion, include at least one recessionary period. And since we aren’t currently in a recession, I typically like to go back to 2006 or 2007, a little before the last recession and measure earnings growth from that point in time in a way that includes any earnings declines that occurred during the recession. For some moderately cyclical stocks (like Apple), this can be very important because when recessionary earnings growth declines are included, often, the earnings growth rate will be lower than if we just measure earnings at point A and then measure them at point B, and assume a smooth earnings growth increase was spread evenly throughout the entire period.
Examining the stock and earnings during a recessionary period is also useful in helping to determine what sort of opportunity one might have to get back into a stock at a reasonable price if one decided to sell it because history can serve as a guide for how far earnings might decline during a recession. Unfortunately, because the iPhone was essentially being launched during the last recession and was in heavy growth mode during that time, we don’t have any good data on what Apple’s business might do during the next recession. That is why I’ve always considered it a speculative bet, even if it turned out to be a good one. (I’ll revisit this idea of speculation later in the article.)
Right now, I want to begin by performing a basic ‘full-cycle’ analysis, starting in 2007 for Apple. Spoiler: I’m eventually going to disregard these initial estimates, but I wanted to share them nonetheless, first, before I share my preferred, alternative approach.
Market Sentiment Returns
In order to estimate what sort of returns we might expect over the next 10 years, let’s begin by examining what return I could expect 10 years from now if the P/E multiple were to revert to its mean from the previous economic cycle. I start the previous cycle around 2007, about a year before the last recession.
Apple’s current blended P/E is 25.09, while its normal P/E this past cycle has been 19.00. With most stocks, unless there is a dramatic change in their business over time, their P/E will fluctuate up and down around its long-term mean, which F.A.S.T. Graphs labels ‘normal’ P/E in blue. If, over the course of the next 10 years, the P/E were to revert to its normal 19.00 level, and everything else was held equal, it would produce a 10-year CAGR of about -2.74%. So, if the market simply changed its mind about how it feels about the stock and reverted to its long-term ‘average’ feeling over the course of 10 years, and nothing else changed, an investor buying the stock today should expect to lose -2.74% per year, for 10 years with this investment, based just on sentiment alone.
Current and Historical Earnings Patterns
We previously examined what would happen if market sentiment reverted to the mean. This is entirely determined by the mood of the market and is quite often disconnected, or only loosely connected, to the performance of the actual business. In this section, we will examine the actual earnings of the business. The goal here is simple, we want to know how much money we would earn (expressed in the form of a CAGR %) over the course of 10 years if we bought the business at today’s prices and kept all of the earnings for ourselves.
There are two main components of this, the first is the earnings yield, and the second is the rate at which the earnings can be expected to grow. Let’s start with the earnings yield, which, according to FAST Graphs, is +3.99%.
The way I like to think about this is if I bought Apple’s whole business for $100, I would earn $3.99 per year on my investment if earnings remained the same for the next 10 years.
But that’s not the end of the story. Business earnings do not typically stay the same every year. Sometimes earnings grow; sometimes, they shrink; and sometimes, they fluctuate both up and down. So, in order to estimate how much money the business might earn over ten years, one needs to estimate how the annual earnings might change over that time period.
There are as many ways to estimate this as there are investors. My approach is to base my forward expectations on the earnings of at least one full previous economic cycle (so that at least one recession is included in the estimate) for businesses whose earnings are not highly cyclical. For businesses whose earnings are highly cyclical, earnings history is not very reliable at predicting future returns, so I use the price history from at least two previous economic cycles for those highly cyclical stocks.
As you can see in the green shaded area that represents EPS in the FAST Graph, Apple has experienced two years where earnings declined by -10% over the past 13 years. These declines took place outside of a recession and are likely due to Apple’s product cycles more than anything else. So, we know that there is some cyclicality with Apple’s earnings even when the wider economy is doing good. It was during these downcycles I made my purchases of Apple stock. Ultimately, we know Apple’s earnings will be affected by the next recession. We just don’t know how much. I feel comfortable assuming that earnings will be moderately cyclical, meaning they will probably decline more than -20%, but less than -50% off of their eventual highs, during a recession. So, I don’t think Apple’s earnings will be so cyclical that using a P/E ratio as part of a valuation process becomes useless (as it would with a highly cyclical stock like Micron (MU), for example). But we should assume that there will be some moderate cyclicality, so we shouldn’t just project Apple’s future earnings in a straight line over the long term. It’s more reasonable to assume some significant dips in earnings along the way.
Earnings Growth
We know what Apple is currently earning. The next step is to estimate their earnings growth over the next decade. I do that by figuring out at what rate earnings grew during the last cycle and applying that rate to the next ten years. This involves calculating the EPS growth rate since 2007, taking into account each year’s EPS growth or decline, and then backing out any share buybacks that occurred over that time period (because reducing shares will increase the EPS due to fewer shares).
Let’s start by looking at how much shares were reduced since 2007.
Data by YCharts
Apple has reduced its shares outstanding by about -27% since 2007. When I back these buybacks out, I get a cyclically adjusted earnings growth rate for Apple of +23.38%, which is an incredible earnings growth rate (more on this later).
Next, I’ll apply that growth rate to current earnings looking forward 10 years in order to get a final 10-year CAGR estimate. The way I think about this is, if I bought Apple’s whole business for $100, it would pay me back $3.99 the first year, and that amount would grow at +23.38% per year for 10 years. I want to know how much money I would have in total at the end of 10 years on my $100 investment, which I calculate to be about $251.01. When I plug that growth into a CAGR calculator, that translates to a +9.64% 10-year CAGR estimate for the expected earnings returns.
10-Year, Full-Cycle CAGR Estimate
Potential future returns can come from two main places: market sentiment returns or earnings returns (both of which we just estimated). If we assume that market sentiment reverts to the mean from the last cycle over the next 10 years, it will produce a -2.74% CAGR. If the earnings yield and growth are similar to the last cycle, the company should produce a +9.64% 10-year CAGR. If we put the two together, we get an expected 10-year, full-cycle CAGR of +6.90%.
Currently, I consider an expected 10-year CAGR greater than 12% a “Buy,” in between 4% and 12% a “Hold”, and less than 4% a “Sell.” This is currently in the range of 4-12%, so Apple stock would be a ‘hold’ based on my most basic analysis here.
However, I don’t think it’s wise to use the basic analysis in Apple’s case. The reason for that is because Apple experienced huge earnings growth for the five years from 2007 to 2012 with the launch of the iPhone. These were people buying iPhones for the first time. That sort of growth is unlikely to happen again. So, I think it’s a good idea to run the numbers for the last seven years, from 2012 through 2019, so see what Apple has done since the initial growth spurt from the iPhone.
Market Sentiment Returns (Since 2012)
Apple’s current blended P/E is 25.09, while its normal P/E since October 2012 has been 15.32. If over the course of the next 10 years, the P/E were to revert to its normal 15.32 level, and everything else was held equal, it would produce a 10-year CAGR of about -6.80%. That’s a pretty big decline, and it may be overstated due to Apple’s shift into services, but even if we used an average P/E of 20, we would get an expected 10-year CAGR of -2.21%.
Earnings Growth (2012)
For this section, I’ll calculate the EPS growth rate since 2012, taking into account each year’s EPS growth or decline, and then backing out any share buybacks that occurred over that time period (because reducing shares will increase the EPS due to fewer shares).
Let’s look at how much shares were reduced by since 2012.
Data by YCharts
Apple has reduced its shares outstanding by about -33% since late 2012. When I back these buybacks out, I get a cyclically adjusted earnings growth rate of only +3.34%, which is much, much lower than what we had when measuring from 2007.
Now, let’s go through the same process and apply that growth rate to current earnings looking forward 10 years in order to get a final 10-year CAGR estimate. The way I think about this is, if I bought Apple’s whole business for $100, it would pay me back $3.99 the first year, and that amount would grow at +3.34% per year for 10 years. I want to know how much money I would have in total at the end of 10 years on my $100 investment, which I calculate to be about $148.00. When I plug that growth into a CAGR calculator, that translates to a +4.00% 10-year CAGR estimate for the expected earnings returns.
10-Year, Full-Cycle CAGR Estimate (2012)
If we assume that market sentiment reverts to the mean from the last cycle over the next 10 years, it will produce a -2.21% CAGR (I’m using the more generous number here of an average P/E of 20). If the earnings yield and growth are similar to what we have experienced since 2012, the company should produce a +4.00% 10-year CAGR. If we put the two together, we get an expected 10-year, full-cycle CAGR of +1.79%. This forward return estimate is below my 4% threshold for a ‘sell’, so I currently rate Apple a ‘sell’, and I have sold my shares.
Importantly, these assumptions do not include a recession, which, as I discussed earlier, would probably cause Apple’s earnings to drop anywhere from -20% to -50%, so I think the assumptions I’m making here are pretty optimistic since I didn’t include that assumption in my earnings growth rate calculation. Perhaps, this will be offset by growth in services and other segments of their business that are potentially counter-cyclical, but those assumptions are speculative.
Time Until Payback Perspective
Since with Apple there is a big gap between the market sentiment returns and the actual business returns, some long-term investors might want to just ignore the market sentiment and focus solely on the business.
I think this is a legitimate way to think about long-term investing (that’s what Warren Buffett does). But I think if one does that, one of the key questions an investor should ask is, “How long will earnings from this business take to pay me back on my investment?” In other words, if I invest $100, how long will it take for my $100 investment to return an additional $100 so that I end up with $200?
The shorter this time until payback is, the better the investment. But just as importantly, when the time until payback gets quite long, I think an investor really has to think about whether they can predict earnings and earnings growth that far into the future. Personally, I prefer investments that pay me back in 8 years or less (and when I first purchased Apple stock, it would have). Additionally, I would look to sell if the time-until-payback exceeded 16 years in most cases, and I would likely never hold onto a stock if the time-until-payback was over 20 years because I don’t think it’s possible to predict that far into the future. Each investor will have to decide what time until payback they are willing to accept for each business, but having a solid number to reference when making that determination can be very useful.
Using the numbers since 2012, I calculate that it would take about 16 years for Apple to pay for itself if purchased at today’s prices. That’s right at my ‘sell’ threshold. This doesn’t take into account market sentiment at all and is purely based on the business.
Opportunity Risk/Reward
Since I think Apple is a great business but is simply priced too high, it’s worth looking at the odds of the price falling to a level where we could buy it near its average P/E ratio if we sell at today’s levels versus what we might miss out on by rotating out of the stock at today’s prices.
Apple’s business is obviously rapidly changing, but it doesn’t seem unreasonable to me to think that during the next economic slowdown, or perhaps even before then, Apple’s P/E will fall at least to a 20 level. If the company’s P/E contracts from its current multiple of 25 to 20 while earnings are held steady, the price would drop about -20%. If it falls to the long-term market average and Apple’s average PE since 2012 of about 15, it would lose -40%.
In order to estimate the opportunity risk/reward, I use F.A.S.T. Graphs’ forecasting tool to estimate future price appreciation, including dividends, for the next 2 years using analysts’ estimates. What I want to know is, if the stock reverts to the mean after 2 years, whether I will have a reasonable chance to buy the stock at a significantly lower price than it trades today or if I would likely never get a chance at a lower price.
Forecasting out 2 years using analysts’ estimates to January 2022, including dividends, we can expect to add $85.60 to Apple’s current price. That gives us a price estimate 2 years from now of $387.90 using today’s 25.09 P/E ratio. If the stock price at that point reverts to a 20 P/E, it would lose about -20% of its value and produce a price of $310.32, which is essentially where the stock trades at today. So, even a modest correction over the course of the next two years would give an investor a chance to get back in at a similar price.
I think it’s getting more and more likely we will experience a serious economic slowdown at some point during the next couple of years, though. And if that happens, even after we allow two years of growth for Apple, if the P/E reverts to 15, the stock could lose -40% just on market sentiment alone and bring the price down to $232.74. If earnings were to fall -20% to -50% as I suspect they could during a recession, that would cause the price to fall even farther.
For these reasons, I don’t see much opportunity risk in rotating out of the stock today. For some ideas on where to put the proceeds from the sales, consider reading about my rotational strategy in these three articles: Part 1 – “Ignore Sentiment Cycles At Your Own Risk,” Part 2 – “Mitigating Sentiment Cycles” and Part 3 – “Sentiment Cycles: When To Sell And When To Buy Back Again.”
Since Apple was such a large part of my portfolio, I’m going to take a few weeks to reallocate my funds. I have a list of several stocks I need to examine as potential buys, and then most of the remaining funds will likely into the default ETFs I suggest in my rotational strategy.
I will track how this idea performs each month going forward, along with many other high-quality, overvalued stocks I have written about this year. Click the orange “Follow” button at the top of the page if you would like to follow the progress of this idea.
If you have found my strategies interesting, useful, or profitable, consider supporting my continued research by joining the Cyclical Investor’s Club. It’s only $29/month, and it’s where I share my latest research and exclusive small-and-midcap ideas. Two-week trials are free.
Disclosure: I am/we are long BRK.B. I wrote this article myself, and it expresses my own opinions. I am not receiving compensation for it (other than from Seeking Alpha). I have no business relationship with any company whose stock is mentioned in this article.
https://content.seleritycorp.com/hosted/assets/www/Kzg2mwJCPuokXQ0GkcKEKLSJcif3xX2yLwoLBe6JsHc
Dow Jones NewsFeb 3, 6:54 PM UTC
DJ Apple’s Real Coronavirus Risk Is the iPhone Supply Chain, Not China Retail Stores — Barrons.com
By Eric J. Savitz
On its earnings call last week, Apple that the evolving coronavirus crisis introduces some unpredictability into the company’s financial outlook. And that was immediately apparent. On the call last Tuesday, CEO Tim Cook said Apple had closed one store in China. But by the end of the week, the company had temporarily shut down all of its China facilities.
“Out of an abundance of caution and based on the latest advice from leading health experts,” Apple (ticker: AAPL) said in a statement released Friday, “we’re closing all our corporate offices, stores and contact centers in mainland China through February 9. Apple’s online store in China remains open. We will continue to closely monitor the situation and we look forward to reopening our stores as soon as possible.”
While many analysts say the impact of the virus on Apple should be limited, investors should worry more about the iPhone supply chain than near-term retail sales, according to Deutsche Bank’s Jeriel Ong.
Ong writes in a research note Monday that while overall the coronavirus issue continues to gain importance to the company, the size of the financial impact from the shuttering of their China retail stores is likely to be “relatively minimal.” Apple has 42 stores in China, and he estimates that a week of closures would imply just $40 million to $50 million in lost sales. (Let’s put this in perspective: Apple had overall December quarter sales of $91.8 billion — that’s about $1 billion a day, or roughly $40 million an hour.) Additional activity in the App Store — as people stuck at home download more games and other apps — could offset some of those sales, he notes.
The bigger cause for concern is the supply chain. “The real question to us is whether channel inventories work down materially, should production plants of Apple’s semiconductor components or Foxconn’s own plants be disrupted in any material way in the coming weeks,” Ong writes. “To us, it’s too early to call shortages of iPhone parts, but in reality, disruption to any single part of the supply chain could impact Apple’s ability to maintain their inventories even if the rest of the chain is working as planned.”
For now, however, the stock should be low-risk when it comes to the virus, other analysts say.
Apple had said its relatively wide March quarter guidance range of between $63 billion and $67 billion in revenue reflects the potential effects of the virus. Evercore ISI analyst Amit Daryanani writes in a research note that by adjusting their outlook to reflect the risk involved in the virus, Apple has become “one of the more de-risked” China-affected stocks.
Wedbush analyst Daniel Ives wrote in a research note over the weekend that there is a possibility that sales of up to 1 million iPhones could be shifted out of the March quarter and into the June quarter. But he adds that “with the vast majority of sales online we view a one-week closure of Apple stores as having a negligible impact thus far despite the scary and concerning headlines from the region.”
Adds Ives: “While the coronavirus outbreak is a sad situation and concerning headline for investors, for the stock we believe the fundamental impact from this issue to Apple’s top-line is negligible.” He maintains his Outperform rating and $400 target.
Apple stock was up 0.8%, to $311.96 in recent trading.
Write to Eric J. Savitz at eric.savitz@barrons.com
(END) Dow Jones Newswires
February 03, 2020 13:54 ET (18:54 GMT)
Copyright © 2020 Dow Jones & Company, Inc.
https://content.seleritycorp.com/hosted/assets/www/PSVda2mNUXWtiV6qgk2a_egMlICwT0yEI1ViKkUm8vE
Dow Jones NewsJan 31, 9:30 PM UTC
Press Release: Baidu to Report Fourth Quarter and Fiscal Year 2019 Financial Results on February 27, 2020, and Updates its Financial Guidance
Baidu to Report Fourth Quarter and Fiscal Year 2019 Financial Results on February 27, 2020, and Updates its Financial Guidance
PR Newswire
BEIJING, Jan. 31, 2020
BEIJING, Jan. 31, 2020 /PRNewswire/ — Baidu, Inc. (NASDAQ: BIDU) (“Baidu” or the “Company”), the leading Chinese language Internet search provider, today announced that the reporting date for its unaudited financial results for the fourth quarter and fiscal year ended December 31, 2019 has been revised to February 27, 2020, and it has updated its guidance for the fourth quarter of 2019 below.
Baidu has revised the date to announce its unaudited financial results for the fourth quarter and fiscal year of 2019, due to the evolving situation brought upon by the outbreak of the novel coronavirus in China. To help control the epidemic, the Company is taking precautionary measures, including extending its employees’ Chinese New Year holiday, which was originally scheduled from January 24, 2020 to January 30, 2020, and requesting employees to work from home for a time period after the holiday.
In light of the evolving situation, Baidu has revised the reporting date for its unaudited financial results for the fourth quarter and fiscal year ended December 31, 2019, to after the U.S. market closes on February 27, 2020. Baidu’s management will hold an earnings conference call at 8:15 PM on February 27, 2020, U.S. Eastern Time (9:15 AM on February 28, 2020, Beijing/Hong Kong Time). The revised date would give the Company more time to observe the business condition for the first quarter of 2020.
Financial Guidance
For the fourth quarter 2019, Baidu expects revenue to be in the range of RMB 28.3 billion ($4.06 billion) to RMB 28.9 billion ($4.15 billion)[1], increasing 4% to 6% year over year, compared to its previous guidance in the range of RMB 27.1 billion to RMB 28.7 billion, or -1% to 6% increase year over year. This forecast assumes that Baidu Core revenue will grow between 4% to 6% year over year, compared to the previous guidance between 0% to 6% year over year.
In addition, Baidu expects net income attributable to Baidu to be in the range of RMB 6.2 billion ($0.89 billion) to RMB 6.7 billion ($0.97 billion), which assumes that net income attributable to Baidu Core will grow between 83% to 90% year over year. Baidu also expects non-GAAP net income attributable to Baidu to be in the range of RMB 8.9 billion ($1.28 billion) to RMB 9.4 billion ($1.36 billion), which assumes that non-GAAP net income attributable to Baidu Core will grow between 50% to 55% year over year. Reconciling items from non-GAAP financial measure to GAAP measure are discussed below in the “Non-GAAP Financial Measure” section.
The above forecast reflects Baidu’s current and preliminary view, which is subject to substantial uncertainty.
Conference Call Information
Baidu’s management will hold an earnings conference call at 8:15 PM on February 27, 2020, U.S. Eastern Time (9:15 AM on February 28, 2020, Beijing/Hong Kong Time). Dial-in details for the earnings conference call are as follows:
International: +65 67135090
China 4006208038
US: +1 8456750437
UK: +44 2036214779
Hong Kong: +852 30186771
Passcode for all regions: 1571908
A replay of the conference call may be accessed by phone at the following number until March 6, 2020:
International: +61 2 8199 0299
Passcode: 1571908
Additionally, a live and archived webcast of this conference call will be available at http://ir.baidu.com.
[1] This announcement contains translations of certain RMB amounts into U.S.
dollars at specified rates solely for the convenience of the reader. Unless
otherwise noted, all translations from RMB to U.S. dollars are made at a rate
of RMB6.9618 to US$1.00, the exchange rate in effective as of December 31,
2019 as set forth in the H.10 statistical release of the Board of Governors of
the Federal Reserve System.
About Baidu
Baidu, Inc. is the leading Chinese language Internet search provider. Baidu aims to make the complicated world simpler through technology. Baidu’s ADSs trade on the NASDAQ Global Select Market under the symbol “BIDU”. Currently, ten ADSs represent one Class A ordinary share.
Safe Harbor Statement
This announcement contains forward-looking statements. These statements are made under the “safe harbor” provisions of the U.S. Private Securities Litigation Reform Act of 1995. These forward-looking statements can be identified by terminology such as “will,” “expects,” “anticipates,” “future,” “intends,” “plans,” “believes,” “estimates,” “forecast,” “confident” and similar statements. Among other things, the outlook for the fourth quarter 2019 in this announcement contains forward-looking statements. Baidu may also make written or oral forward-looking statements in its periodic reports to the U.S. Securities and Exchange Commission, in its annual report to shareholders, in press releases and other written materials and in oral statements made by its officers, directors or employees to third parties. Statements that are not historical facts, including statements about Baidu’s beliefs and expectations, are forward-looking statements. Forward-looking statements involve inherent risks and uncertainties. A number of factors could cause actual results to differ materially from those contained in any forward-looking statement. Further information regarding these and other risks is included in our annual report on Form 20-F and other documents filed with the Securities and Exchange Commission. Baidu does not undertake any obligation to update any forward-looking statement, except as required under applicable law. All information provided in this press release is as of the date of the press release, and Baidu undertakes no duty to update such information, except as required under applicable law.
Non-GAAP Financial Measure
Non-GAAP net income attributable to Baidu represents net income attributable to Baidu excluding share-based compensation expenses, amortization and impairment of intangible assets resulting from business combinations, disposal gain or loss, impairment of long-term investments, fair value change of long-term investments, adjusted for related income tax effects. Baidu’s share of equity method investments for these non-GAAP reconciling items, amortization of intangible assets not on the investees’ books, accretion of their redeemable noncontrolling interests, and the gain or loss associated with the issuance of shares by the investees at a price higher or lower than the carrying value per shares, adjusted for related income tax effects, are also excluded.
For investor and media inquiries, please contact:
Investors Relations, Baidu, Inc.
Tel: +86-10-5992-8888
Email: ir@baidu.com
View original content:http://www.prnewswire.com/news-releases/baidu-to-report-fourth-quarter-and-fiscal-year-2019-financial-results-on-february-27-2020-and-updates-its-financial-guidance-300996865.html
SOURCE Baidu, Inc.
/Web site: http://www.baidu.com
(END) Dow Jones Newswires
January 31, 2020 16:30 ET (21:30 GMT)
Freeport-McMoRan: Short-Term Investor Concerns Ignore Long-Term Demand
Feb. 3, 2020 11:06 AM ET
Summary
Freeport-McMoRan’s recent stock price drop has investors ignoring the long-term demand forecast and over focusing on short-term concerns.
As the company’s recent earnings show, the company has continued has continued its transition plan, which it is well on the plan of completing by YE 2021.
The company’s FCF should increase significantly over the next few years providing massive rewards for investors.
I do much more than just articles at The Energy Forum: Members get access to model portfolios, regular updates, a chat room, and more. Get started today »
Freeport-McMoRan (NYSE: FCX) has seen its stock price decrease by almost 16% over the past month. Despite this, the company, with a market capitalization of more than $16 billion is one of the largest producers in the world. More so, the company’s recent 4Q 2019 earnings show its continued focus on its goals and transition. As we’ll see throughout this article, the company’s impressive portfolio of assets along with long-term demand for what it produces, make the company a strong long-term investment.
Freeport-McMoRan Strong Long-term Demand
Freeport-McMoRan primarily produces copper, gold, and molybdenum all metals with significant long-term demand.
Copper Market Forecast – Freeport-McMoRan Investor Presentation
Copper is the most important aspect of the company’s long-term potential and revenue. The company is focused on a strong fundamental outlook supported by decreasing copper exchange inventories and a lack of medium term supply growth. Additionally, modest demand growth is expected to drive prices higher and the supply and demand gap widens.
Copper demand for the long-term is expected to increase significantly. Copper demand is expected to double over the next 20 years as a result of significant electric demand. Freeport-McMoRan expects the copper supply gap to be ~4.4 million tons by 2029 and the current copper price is significantly below what the company views the incentive price of $3.30 / pound as being.
Additionally, Freeport-McMoRan’s other major producing asset is gold – which it is a counter cyclical asset – people tend to invest in it when they’re worried about the state of the market. As we continue in one of the longest bull markets of all time, having a counter cyclical asset is beneficial. Molybdenum is the last metal, which is a much smaller component of revenue, should also have strong demand.
Freeport-McMoRan 2019 Results
In an environment that should have strong long-term demand, Freeport-McMoRan had strong 2019 results, where it continued to execute on its goals.
Freeport-McMoRan 2019 Forecasts – Freeport-McMoRan Investor Presentation
Freeport-McMoRan has three major initiatives that it is in the middle of a transformation project for. These are the company’s Grasberg underground project, Lone Star oxide project, and overall innovation projects. In the Grasberg project, the company is focused on a two year transition to ramp up the Grasberg underground project. The company has commenced operating and ramp-up is progressing on schedule here.
Additionally, for the company’s Lone Star project, a major growth project in a secure location (Arizona), the development is advancing and nearing completion. Lastly, the company is focused on innovation focused projects primarily in the Americas. These projects should help the company continue to focus on general efficiency and high profits.
Freeport-McMoRan Future Growth
As the company has continued to execute on its goals, it has significant future growth opportunities. Let’s start with one of the most famous mines in the world, Grasberg.
Freeport-McMoRan Grasberg – Freeport-McMoRan Investor Presentation
Here, we can see the history of the Grasberg pit along with the future. Historically, the mine removed 5.2 billion tons with 33 billion pounds of Copper and 53 million ounces of Gold for a total of ~$97 billion. Going forward, as a result of high prices, the company plans to mine 36 billion pounds Copper and 29 million ounces of Gold for ~$150 billion. This will support the mine for the next 21 years.
The company has done a strong job of ramping up Drawbelling and Ore Extraction and expects Ore Extraction to double in the DMLZ and GBC by the end of 2020. That will support a continued steady ramp-up of production. It’s worth noting that a late-2018 deal with Indonesia about the mine will help to support the steady cash flow from the mine from now until 2041.
Freeport-McMoRan Lone Star – Freeport-McMoRan Investor Presentation
Freeport-McMoRan’s other major growth opportunity is the company’s Lone Star copper project. First copper production is expected to startup during 2020 with estimated production at 200 million pounds / year (more than $500 million of revenue / year). The $850 million initial project is ~75% complete, meaning ~$212 million in capital spending left.
The project remains on schedule and within budget, and is continued to focus on expansion. The project has been significantly larger than expected with a number of recent high grade intersections. Ideally, the company will be able to expand the project going forward to increase production. Grasberg and Lone Star help to highlight the future potential the company has, that combined with synergies across the board can help the company’s financials.
Freeport-McMoRan Post-Transition Financial Picture
All of this growth, and all of the company’s 2019 accomplishments, are based on its transition plan which is expected to last from 2019 – YE 2021.
Freeport-McMoRan Transition Plan – Freeport-McMoRan Investor Presentation
The company is focused on growing sales along with a reduction in costs that will lead to a significant improvement in EBITDA. The company expects a 30% increase in copper along with a 40% increase in gold production from 2019 to 2021. That’s a significant increase in production that will be paired with a 25% decline in unit net cash costs as the company improves its efficiency.
All of this together will result in the company’s EBITDA more than doubling, with significant upside in markets that continue to improve. The net result will be strong EBITDA and operating cash flow for the company. Combined with capital expenditures, the net results for shareholders will be strong. Current copper prices, as a result of difficulties are at $2.55 / pound.
The company forecasts average 2021 / 2022 operating cash flow, with $2.75 / pound copper at $4.5 billion. The company expects 2021 consolidated capital expenditures at $2.4 billion. That points towards FCF of $2.1 billion in 2021, probably closer to $1.5 billion with current copper prices. However, with copper prices near incentive prices, the 2021 / 2022 average should be closer to $4 billion.
However, with a $16 billion market capitalization, $1.5 billion as a bottom case in FCF is impressive. More importantly, it’s worth noting that 2021 is still the end of the transition. That is, going into 2022 we should see stronger cash flow and lower capital expenditures. That should support continued improvements in FCF past that going into the mid-2020s.
Freeport-McMoRan’s debt is also something worth keeping in mind. The company’s liquidity position has improved dramatically since late-2015 and the company’s early-2016 bankruptcy concerns. Debt has decreased drastically from $20.2 billion in late-2015 to $7.8 billion at year-end 2019, although it’s worth noting the company still spends ~$400 million in annual interest expenses.
However, with a net cash position of -$5.8 billion, the company’s debt to equity ratio of 0.3 is much more reasonable.
Freeport-McMoRan Risks
Despite strong future growth and the company’s financial picture, the company does have some a risk worth paying attention too. The primary primarily risk is the risk of no recovery in copper prices.
We discussed, in the macroeconomic section above, the forecast for copper prices along with the significant supply gap that’s expected to open up. That’s based on current demand predictions as existing mines decline and demand ramps up from sources like electric cars. However, if this doesn’t materialize, copper prices could remain lower for longer.
Ultimately, the thesis for Freeport-McMoRan rests on continued strength in copper prices. The demand / supply balance supports continued strength here, however, it remains a risk.
Conclusion
Freeport-McMoRan has been punished off of recent fears of the coronavirus in China hurting copper prices. The decline in copper prices has hurt the company’s prospects which are eminently tied to copper prices. Despite this, the company has significant long-term potential on the basis of its transition phase along with the improvement in copper demand.
Specifically, in terms of improvements in the company’s transition phase, even if by 2022 copper prices don’t recover, the company should be making $1.5 billion in annual FCF. That’s significant for a company with a market capitalization of $16 billion. In any event of upside, the company’s annual FCF could increase towards $3-4 billion. That significant upside, likely based on the incentive advice as long-term demand increases, makes the company a strong long-term investment.
Disclosure: I am/we are long FCX. I wrote this article myself, and it expresses my own opinions. I am not receiving compensation for it (other than from Seeking Alpha). I have no business relationship with any company whose stock is mentioned in this article.
HI Financial Services Mid-Week 06-24-2014