HI Financial Services Commentary 12-18-2018
You Tube Link: https://youtu.be/ogp8OkOVqfU
What I want to talk about today?
Historical S&P 500 7.75% return to 8.125% – 1951
How often does that double a portfolio? 10 years
9.5 – 9.75 years
1 $107.75
2 $116.10
3 $125.09
4 $134.79
5 $145.24
6 $156.49
7 $168.62
8 $181.69
9 $195.77
10 $210.94
Most people have how long to invest before retirement ? 39 years = 4 times plus money added
When is the most money added to a trading/investing portfolio 50+
Since 2000 what is the average rate of return for the S&P 500 4.5681
If you had $100 invested in 2000 did you double your money yet? NO
Average rates of returns are not your friend
Story of $1 +50% then lost 50% how much is that dollar worth ? = 0 average rate of return $0.75
Story with 60% gain and a 45% lost= 1.60 = $0.88
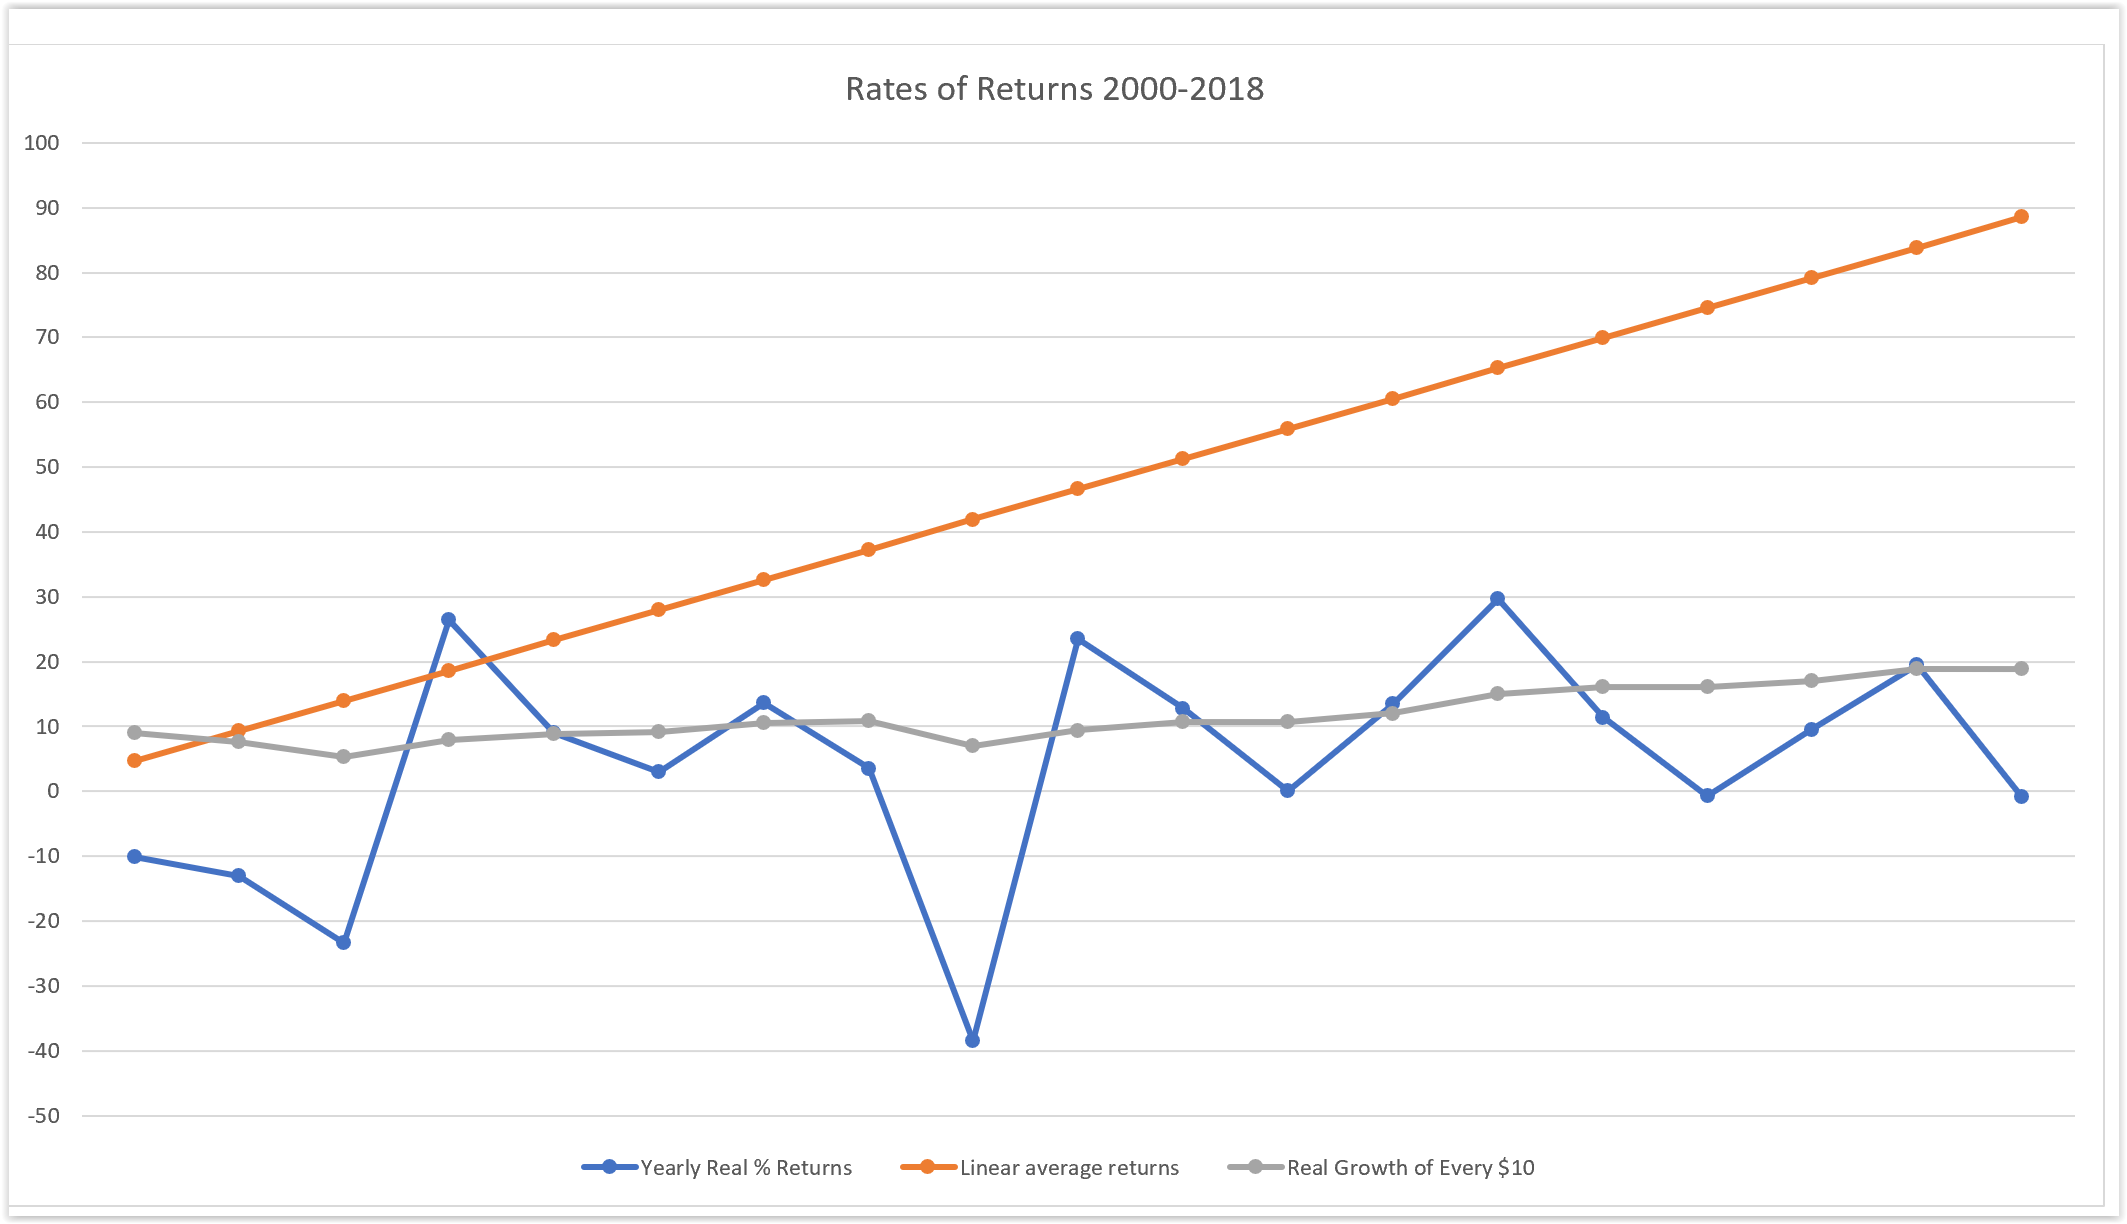
| Year | Yearly % Return | $100 | Total Yearly Growth | |
| 2000 | -10.14 | ($10.14) | $89.86 | |
| 2001 | -13.04 | ($13.04) | $76.82 | |
| 2002 | -23.37 | ($23.37) | $53.45 | |
| 2003 | 26.38 | $26.38 | $79.83 | |
| 2004 | 8.99 | $8.99 | $88.82 | |
| 2005 | 3.01 | $3.01 | $91.83 | |
| 2006 | 13.62 | $13.62 | $105.45 | |
| 2007 | 3.53 | $3.53 | $108.98 | |
| 2008 | -38.49 | ($38.49) | $70.49 | |
| 2009 | 23.45 | $23.45 | $93.94 | |
| 2010 | 12.78 | $12.78 | $106.72 | |
| 2011 | 0.01 | $0.01 | $106.73 | |
| 2012 | 13.41 | $13.41 | $120.14 | |
| 2013 | 29.6 | $29.60 | $149.74 | |
| 2014 | 11.39 | $11.39 | $161.13 | |
| 2015 | -0.73 | ($0.73) | $160.40 | |
| 2016 | 9.54 | $9.54 | $169.94 | |
| 2017 | 19.42 | $19.42 | $189.36 | |
| 2018 | -0.84 | ($0.84) | $188.52 | |
| 88.52 | ||||
| 88.54% | Total Average return | $ 188.52 | ||
| 4.658947368 | Average Yearly Returns since 2000 | |||
Why am I telling you all this? Are you OK with having some stock jockey try to outguess the market and when the markets are down you are expected to pay them to tell you “Just ride it out”. “Don’t worry, it will come back”. “Don’t worry we will get them next year”
For most money managers the job stops when they get your funds, put it into a fund, don’t look at for a year and get pad a management fee and a commission for the amount of money placed into funds.
There are accounts that I will not beat the S&P 500 this year.
Reason why – AAPL, BIDU, FB
By using the long put as insurance I’m nowhere close to losing 35-40%
AND I have added shares with the profits from the long puts into their account without asking for more money to dollar cost average.
What else happens on almost a yearly basis S&P 500, DOW, Russell and the Nasdaq?
The losers get taken out and replace with new companies (big winners)
Where will our markets end this week?
Expect a down week from here – FOMC tomorrow
DJIA – Bearish
SPX – Bearish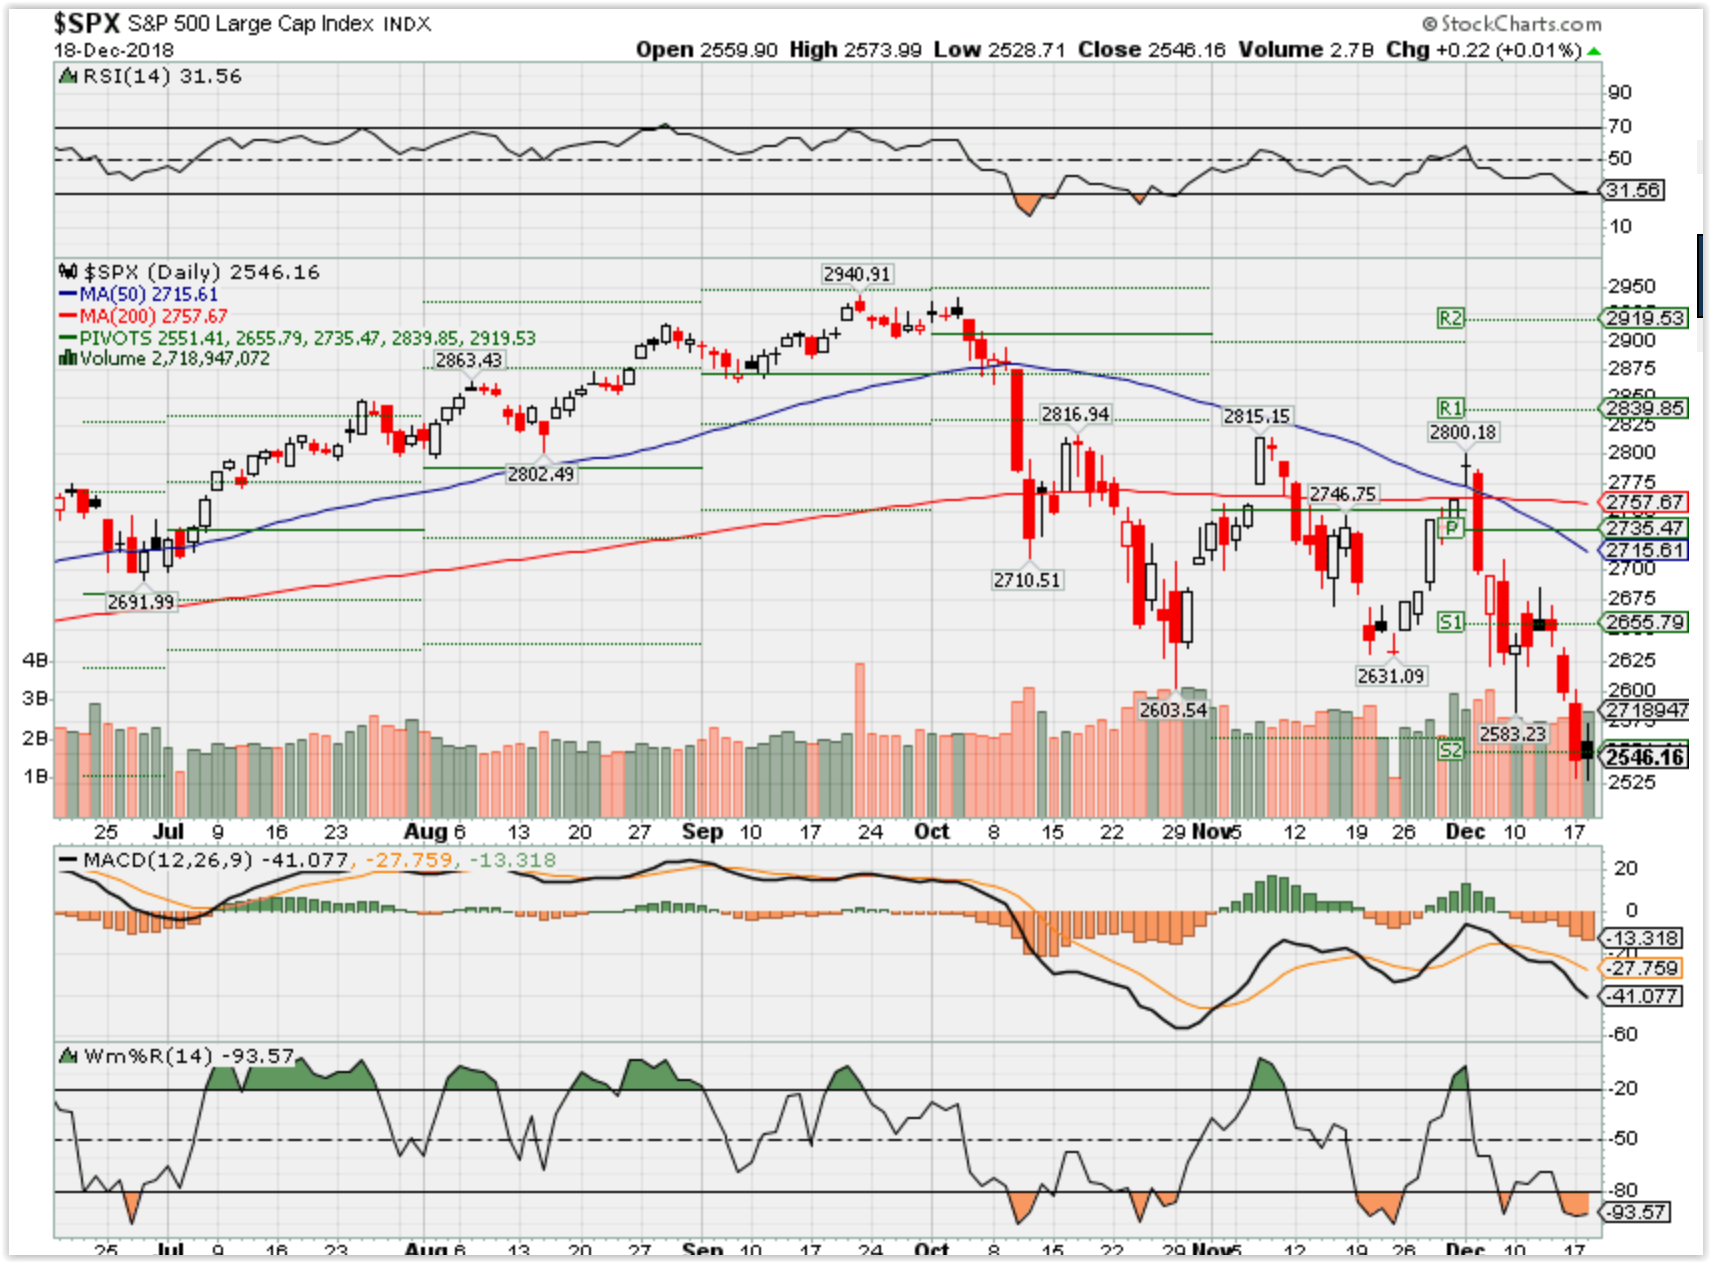
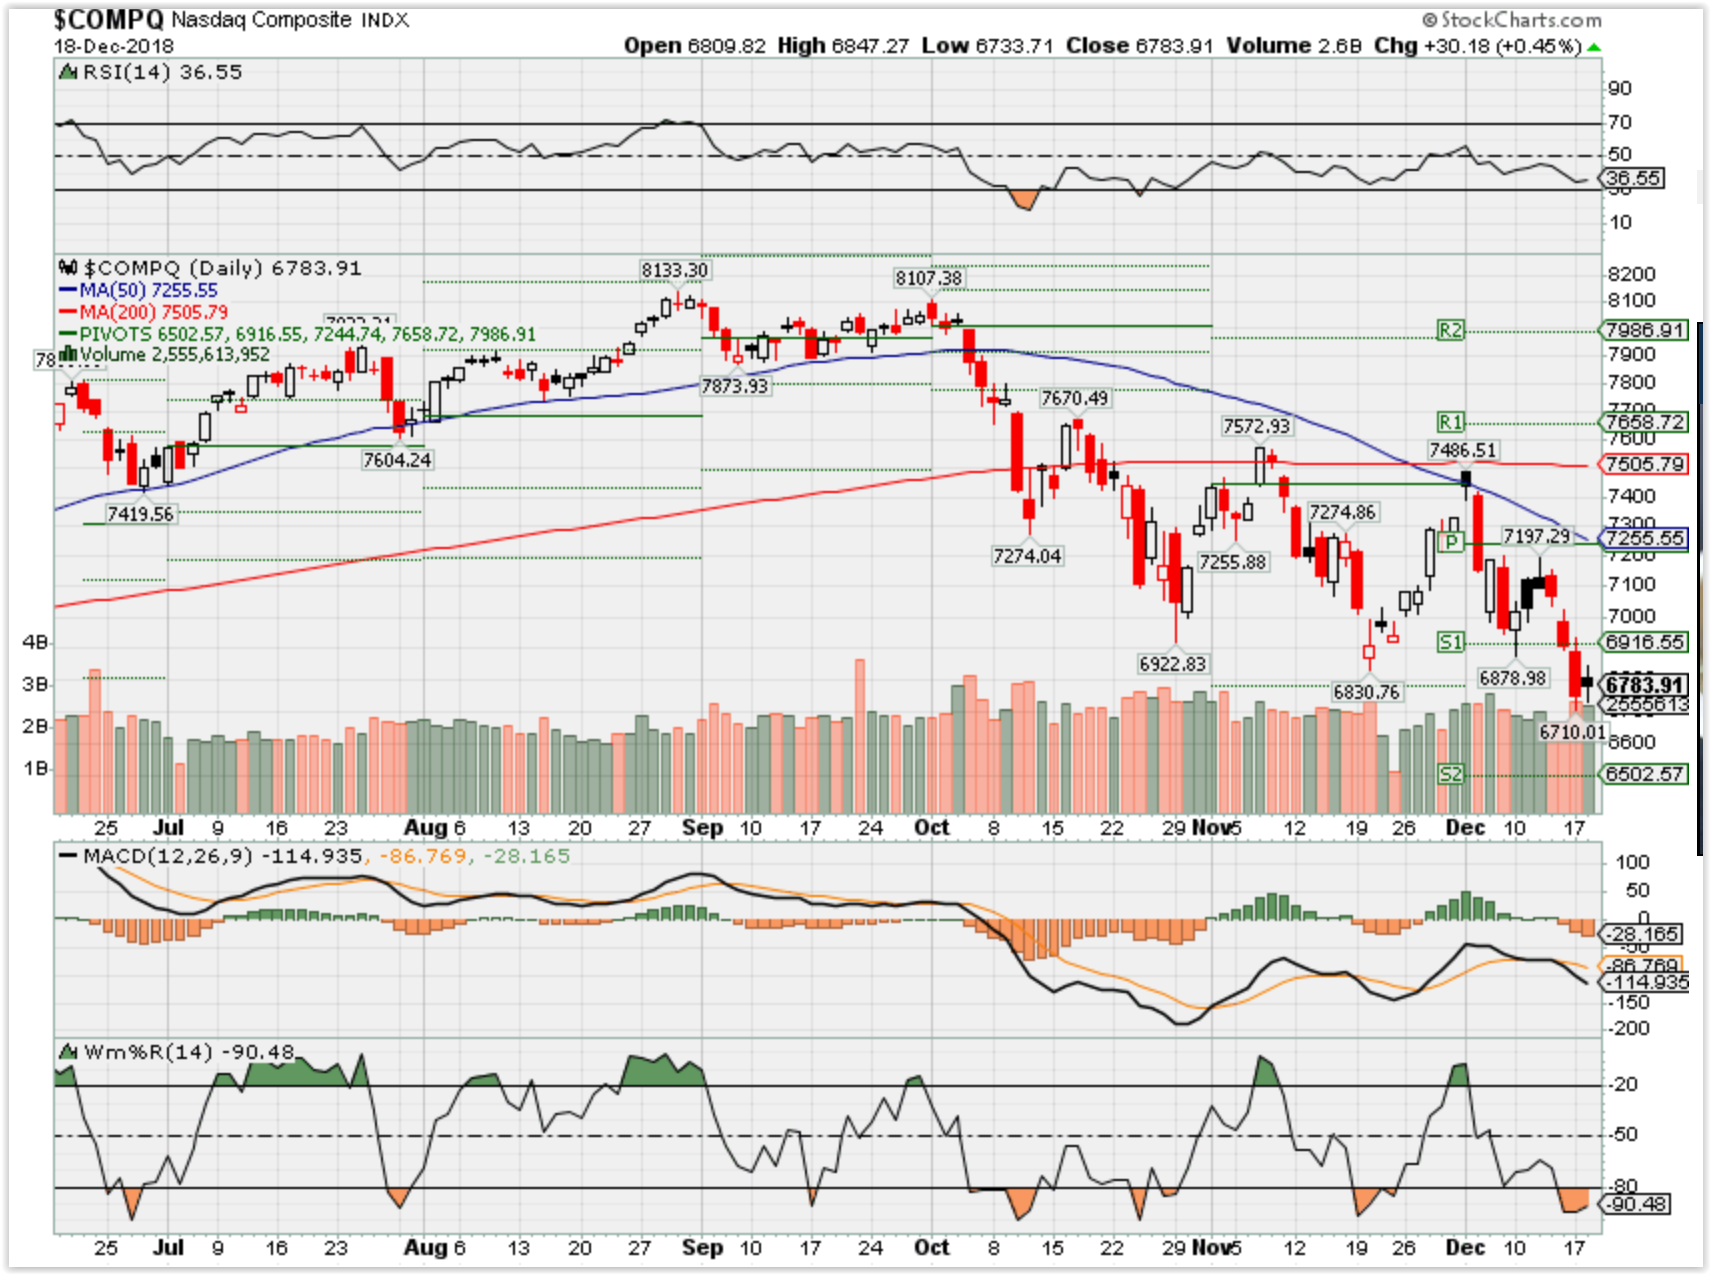
COMP – Bearish
Where Will the SPX end December 2018?
12-18-2018 -4.0%
12-11-2018 -2.0%
12-04-2018 +2.5%
Earnings:
Tues: DRI, SBL, MU
Wed: GIS, PAYX, PIR, RAD
Thur: WBA, CTAS, NKE
Fri: KMX
Econ Reports:
Tues: Building Permits, Housing Starts
Wed: MBA, Current Account Balance, Existing Home Sales, FOMC Rate Decision,
Thur: Initial, Continuing, Phil Fed, Leading Indicators,
Fri: Durable Goods, Durable ex-trans, GDP, GDP Deflator, PCI Prices, Personal Income , Personal Spending
Int’l:
Tues –
Wed –
Thursday –
Friday-
Sunday –
How am I looking to trade?
Protect the Stock Positions through Dec
AOBC 12/06
MRVL 12/04
RHT 12/19
If possible I will be rolling protection up or down to take profits on Long Puts and to move them to ATM prices for most if not all of my equity positions
Opportunities – AAPL, BIDU, FB, F, DIS, V, BAC, GS, CAH, UNH, CVX, AOBC, UAA, GOOGL
www.myhurleyinvestment.com = Blogsite
customerservice@hurleyinvestments.com = Email
Questions???
Well what’s working today
Full collar trades using a short call to pay for most if not all of the long put cost.
This will make up 80-95% of the downward movement
What about a quicker money maker type strategy for monthly income in this volatility
Do strangles/Straddles work now
For a $2300 investment at the close of last Thursday ITM
I made $200 return of 200/2300 = 8.69565 % return in 3 days of being in the market
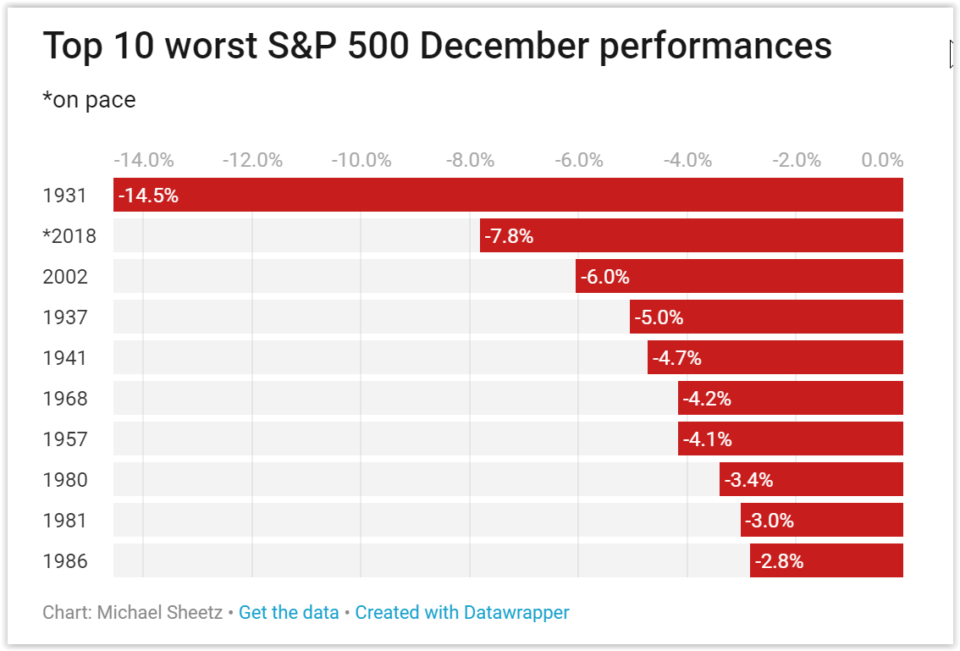
The stock market is on pace for its worst December since the Great Depression
PUBLISHED MON, DEC 17 2018 • 4:24 PM EST | UPDATED 34 MIN AGO
Two benchmark U.S. stock indexes are careening toward a historically bad December.
Both the Dow Jones Industrial Average and the S&P 500 are on pace for their worst December performance since 1931, when stocks were battered during the Great Depression. The Dow and S&P 500 closed Monday down 7.6 percent and 7.8 percent this month, respectively.
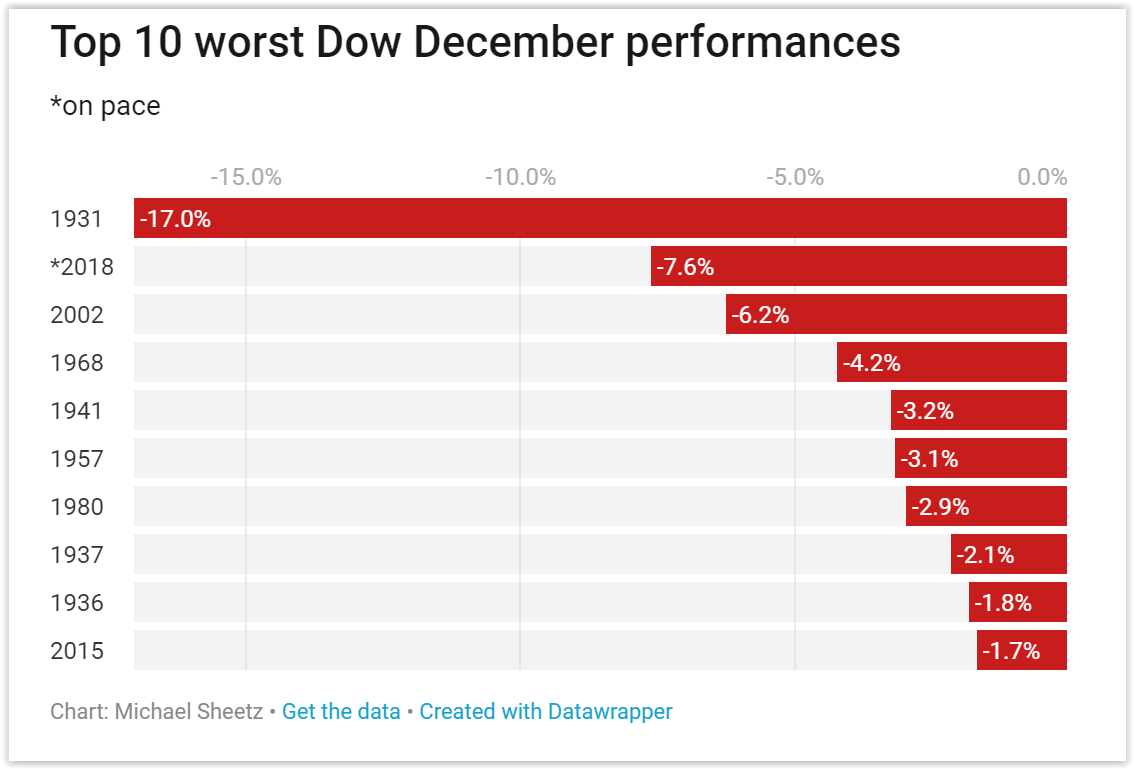

December is typically a very positive month for markets. The Dow has only fallen during 25 Decembers going back to 1931.
The S&P 500 averages a 1.6 percent gain for December, making it typically the best month for the market, according to the Stock Trader’s Almanac.
While the S&P 500 began dissemination in 1950, the performance data was backtested through 1928. It’s worth noting that historically, the second half of December tends to see gains.
– CNBC’s Gina Francolla contributed to this report.
Ron Paul: A 50% correction will spark depression-like conditions that may be ‘worse than 1929’
PUBLISHED SUN, DEC 16 2018 • 5:00 PM EST | UPDATED MON, DEC 17 2018 • 10:21 AM EST
Ron Paul is warning this year’s corrections could be a precursor to an epic market collapse that may come sooner than investors think.
According to the former Republican presidential candidate, Wall Street is becoming more vulnerable to near-depression conditions within the next 12 months.
“Once this volatility shows that we’re not going to resume the bull market, then people are going to rush for the exits,” Paul said Thursday on CNBC’s “Futures Now. ” The relentlessly bearish former congressman added that “It could be worse than 1929.”
During that year, the stock market began hemorrhaging, falling almost 90 percent and sending the U.S. economy into a tailspin.
Paul, a well-known Libertarian, has been warning Wall Street a massive market plunge is inevitable for years. He’s currently projecting a 50 percent decline from current levels as his base case, citing the ongoing U.S.-China trade war as a growing risk factor.
“I’m not optimistic that all of the sudden, you’re going to eliminate the tariff problem. I think that’s here to stay,” he said. “Tariffs are taxes.”
The scenario is exacerbating Paul’s chief reason behind his bearish call: 2008 financial crisis easy money policies. He contended the Federal Reserve’s quantitative easing has caused the “biggest bubble in the history of mankind. ”
“It’s so important to understand the original cause of the problem, and that is the Federal Reserve running up debt and letting politicians spend money,” he added.
Paul argued that Washington lawmakers do not have an ability to effectively fix the debt problem, and he’s been highly critical of the 2017 Trump tax cuts for creating a dire debt situation.
The White House is estimating this year’s budget deficit will total $1.09 trillion. The Obama administration saw deficits just as large while trying to solve the 2008 financial crisis and the subsequent recession.
However, there may be a silver lining in Paul’s forecast.
Unlike the Great Depression, Paul said the next historic downturn doesn’t have to last a decade — as long as Fed policy and lawmakers don’t make the same financial mistakes.
“If you allow the liquidation, it doesn’t last long,” Paul said.
2019 Investment Insights: Managing Risk in An Aging Recovery
Wednesday, December 19, 2018 | 03:00 PM Eastern Standard Time
Secure your spot in this live CE-credit webinar to hear our speakers reflect on the past year and provide their perspectives on key drivers and themes for 2019:
- Expand views on debt: Open questions about rising rates, the pace of economic growth, and corporate and government debt levels will likely require nuance to identify the right investment opportunities.
• Adapt to changing discount rates: Shifting risk premiums and widening credit spreads should cause credit quality and fundamental security selection to play a critical role in helping drive returns.
• Adjust portfolio duration: Duration movement as a result of interest rate movements is more than just a fixed-income concern and knowing when to adjust is important.
Come away with insight about economic developments and market trends that may help you manage risk in this aging market recovery and inform your strategy for the new year.
Jeff Gundlach, the ‘bond king’ managing $120 billion, is bearish on stocks and bonds
PUBLISHED TUE, DEC 11 2018 • 5:29 PM EST | UPDATED WED, DEC 12 2018 • 8:49 AM EST
KEY POINTS
- The Fed seems to be on a “suicide mission,” raising rates while the government deficit increases as a share of GDP, says the founder and chief executive officer of DoubleLine, which manages $120 billion.
- “It certainly looks like the U.S. is going to break down to me and to a lower level,” he says about the stock market.
- “Corporate bonds remain very overvalued, … corporate bonds should be avoided,” Gundlach says in a webcast.
- Jeffrey Gundlach, Wall Street’s bond king and respected prognosticator on all financial markets, is painting a bearish picture of the stock and corporate bond markets, as well as the U.S. economy.
In a webcast Tuesday, he cited weak chart patterns, a rising deficit, signs of an economic slowdown and the Federal Reserve’s shrinking balance sheet.
“It certainly looks like the U.S. [stock market] is going to break down to me and to a lower level,” the founder and chief executive officer of DoubleLine said. He said stocks look headed back to their lows in February and could break below them.
Gundlach used charts to tell his bearish story, showing a chart of chip stocks going back to 2000 and how they were unable to stay above their highs made during the dot-com bubble.
He did the same with financials, showing bank stocks have failed to break out after rising close to highs last seen just before the financial crisis.
Gundlach noted that banks won’t perform even if rates are rising if the yield curve is flattening. And he noted that higher rates have hurt loan growth, which will in turn hurt financial profits. “It’s difficult when demand for your product is dropping,” he said.
The investor also took note of the recent drop in the “FAANG” stocks (Facebook, Amazon, Apple, Netflix, Google-parent Alphabet).
“You’ve got all these now in a bear market,” said Gundlach, whose firm manages $120 billion.
Gundlach noted that consumer confidence readings lately versus economists’ expectations are falling short by a magnitude and consistency last seen prior to the recession in 2007. This continued disappointment could be a sign of economic weakness ahead.
The S&P 500 is down 1 percent for 2018 after a 10 percent drop this quarter. Gundlach noted that the shrinking of the Fed’s balance sheet this year correlates with the rollover in stocks.
Suicide Mission
On interest rates, Gunldach has the view that they may continue to rise even if the economy is weakening because of increased supply from the government trying to fund an increasing deficit.
“The rally in bonds is a long way from impressive,” he said, referring to the recent drop in yields this quarter (bond prices move inversely to yields.)
He proposes that the economy is slowing “and maybe the supply makes it so rates don’t go down with economic weakness.”
The Fed seems to be on a “suicide mission,” raising rates while the government deficit increases as a share of GDP, Gundlach said. Normally when the deficit is expanding, the Fed would be lowering interest rates. The Federal Reserve is widely expected to raise rates on Dec. 19, despite the recent market volatility. That would be the central bank’s fourth rate increase this year.
“Corporate bonds remain very overvalued; … corporate bonds should be avoided,” he added, citing the slowing economy and rising credit risks.
On currencies, Gundlach said, “I still believe pretty deeply that the next big move in the dollar is down.” He cited those same deficit concerns.
But he does like one play for the long term: emerging markets.
“I think you″ll do much better” owning stocks outside of the U.S., Gundlach said, citing his weak dollar forecast.
HI Financial Services Mid-Week 06-24-2014