HI Financial Services Commentary 11-13-2018
YouTube: https://youtu.be/QWtQThyi5dc
What I want to talk about today?
ETF’s are what type of investing? Passive – sit in it more than a year for long term capital gains, schedule K or ownership returns depending on the ETF.
Markets go down 10% and most ETF, Mutual Funds, Asset allocation models have been down 12-15%
Option Traders, Futures Traders, Currency, have been down in the 20% to 33% range from the people I talk to
This passive trading does what to our markets by way of liquidity? Less and exasperating them moves on a short term basis
Larry Kudlow- Hey we are the best in the world right now when it comes to a strong economy
We have negotiated with Canada, Mexico, soon to be Japan, ongoing good European trade discussions and starting to talk again with China
We’ve accomplished a lot and we are still working on accomplishing more
Tariffs as of yet are still not fully in place nor affecting the US companies yet
Why I invest the way I do – I COLLAR TRADE
I’m using the Williams%R in conjunction with Pivot points for a short term (30 day ish) on when I might take off Long puts, Short calls within my collar trade
ALSO on leap long calls when and where to add short calls to start to lower my cost basis – BAC, V, FB
AAPL
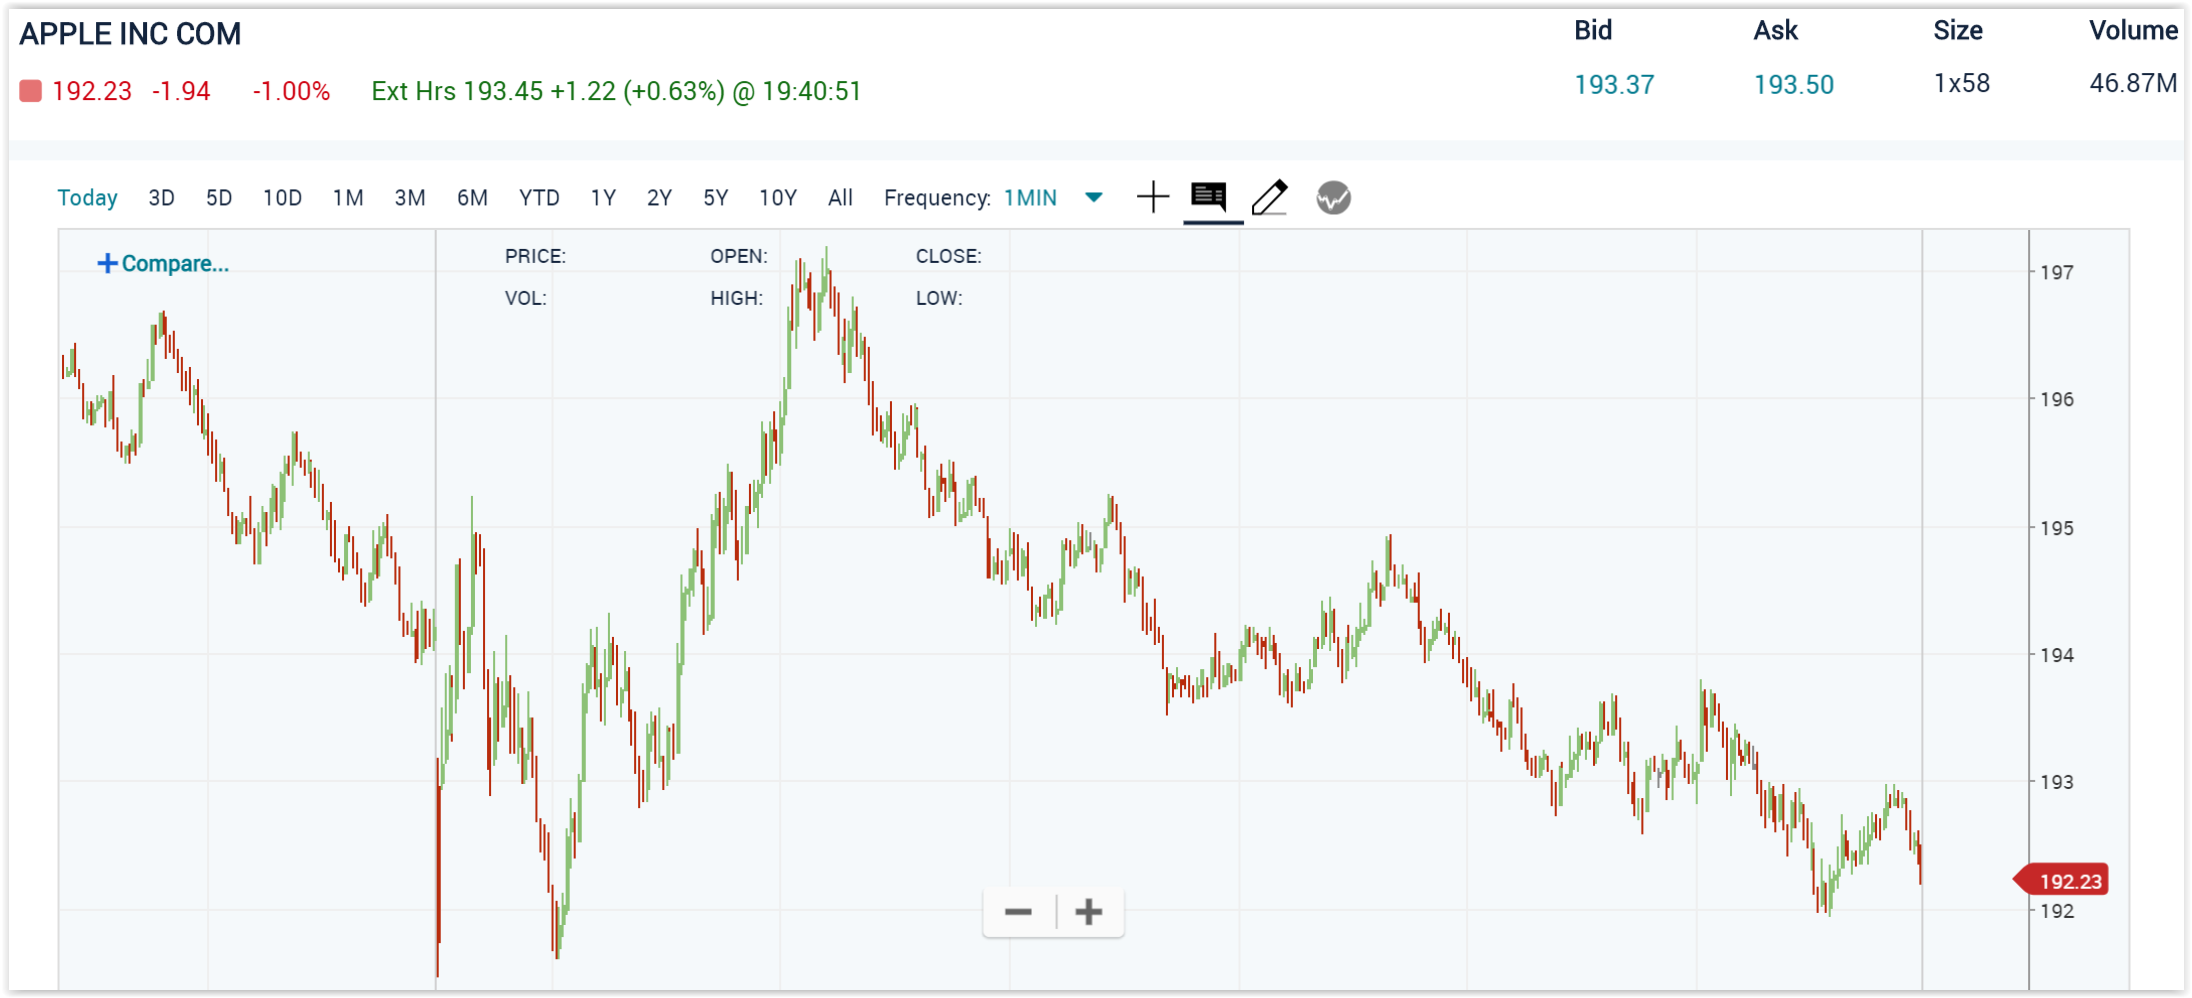
It is extremely hard if not impossible to confirm trends in a headline risk market
Today I choose to keep my long puts on for one more day
Where will our markets end this week?
DJIA – BEARISH 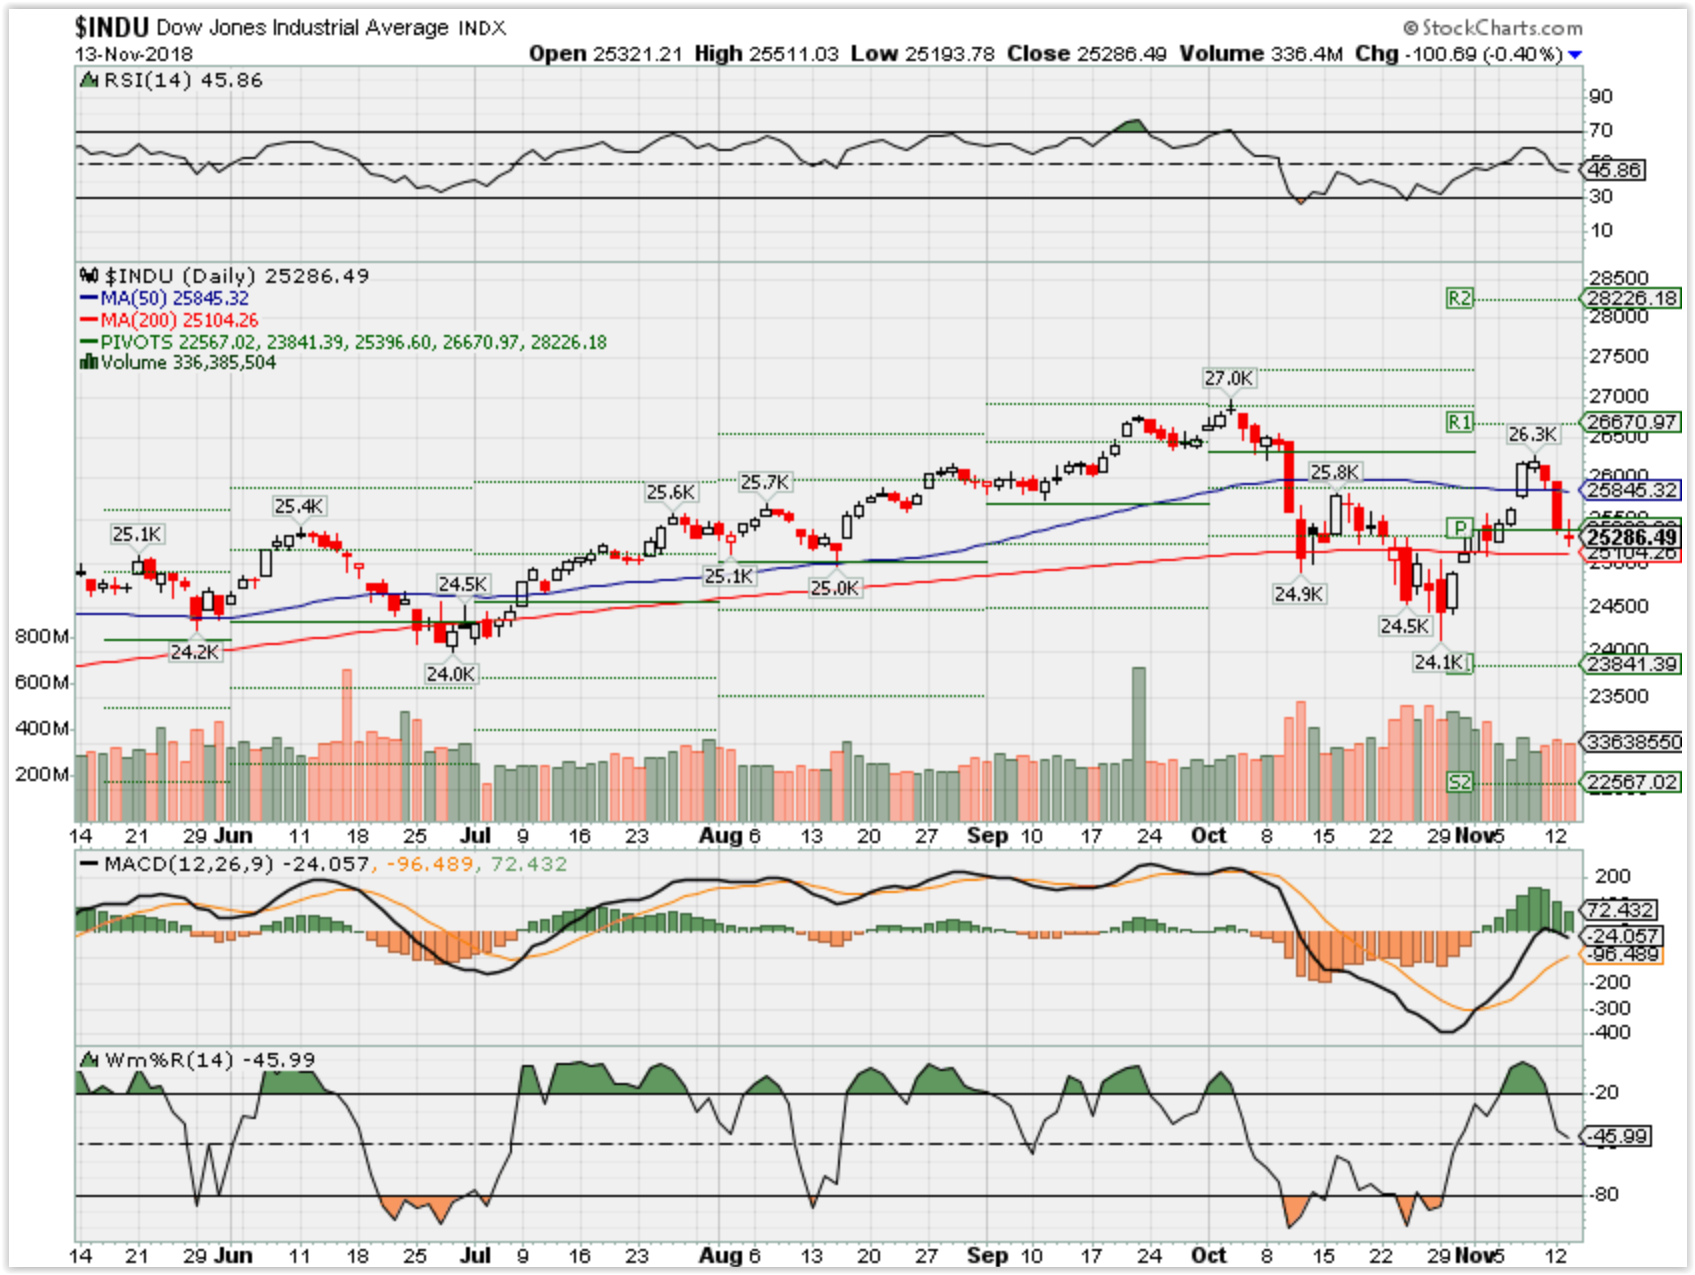
SPX – Bearish 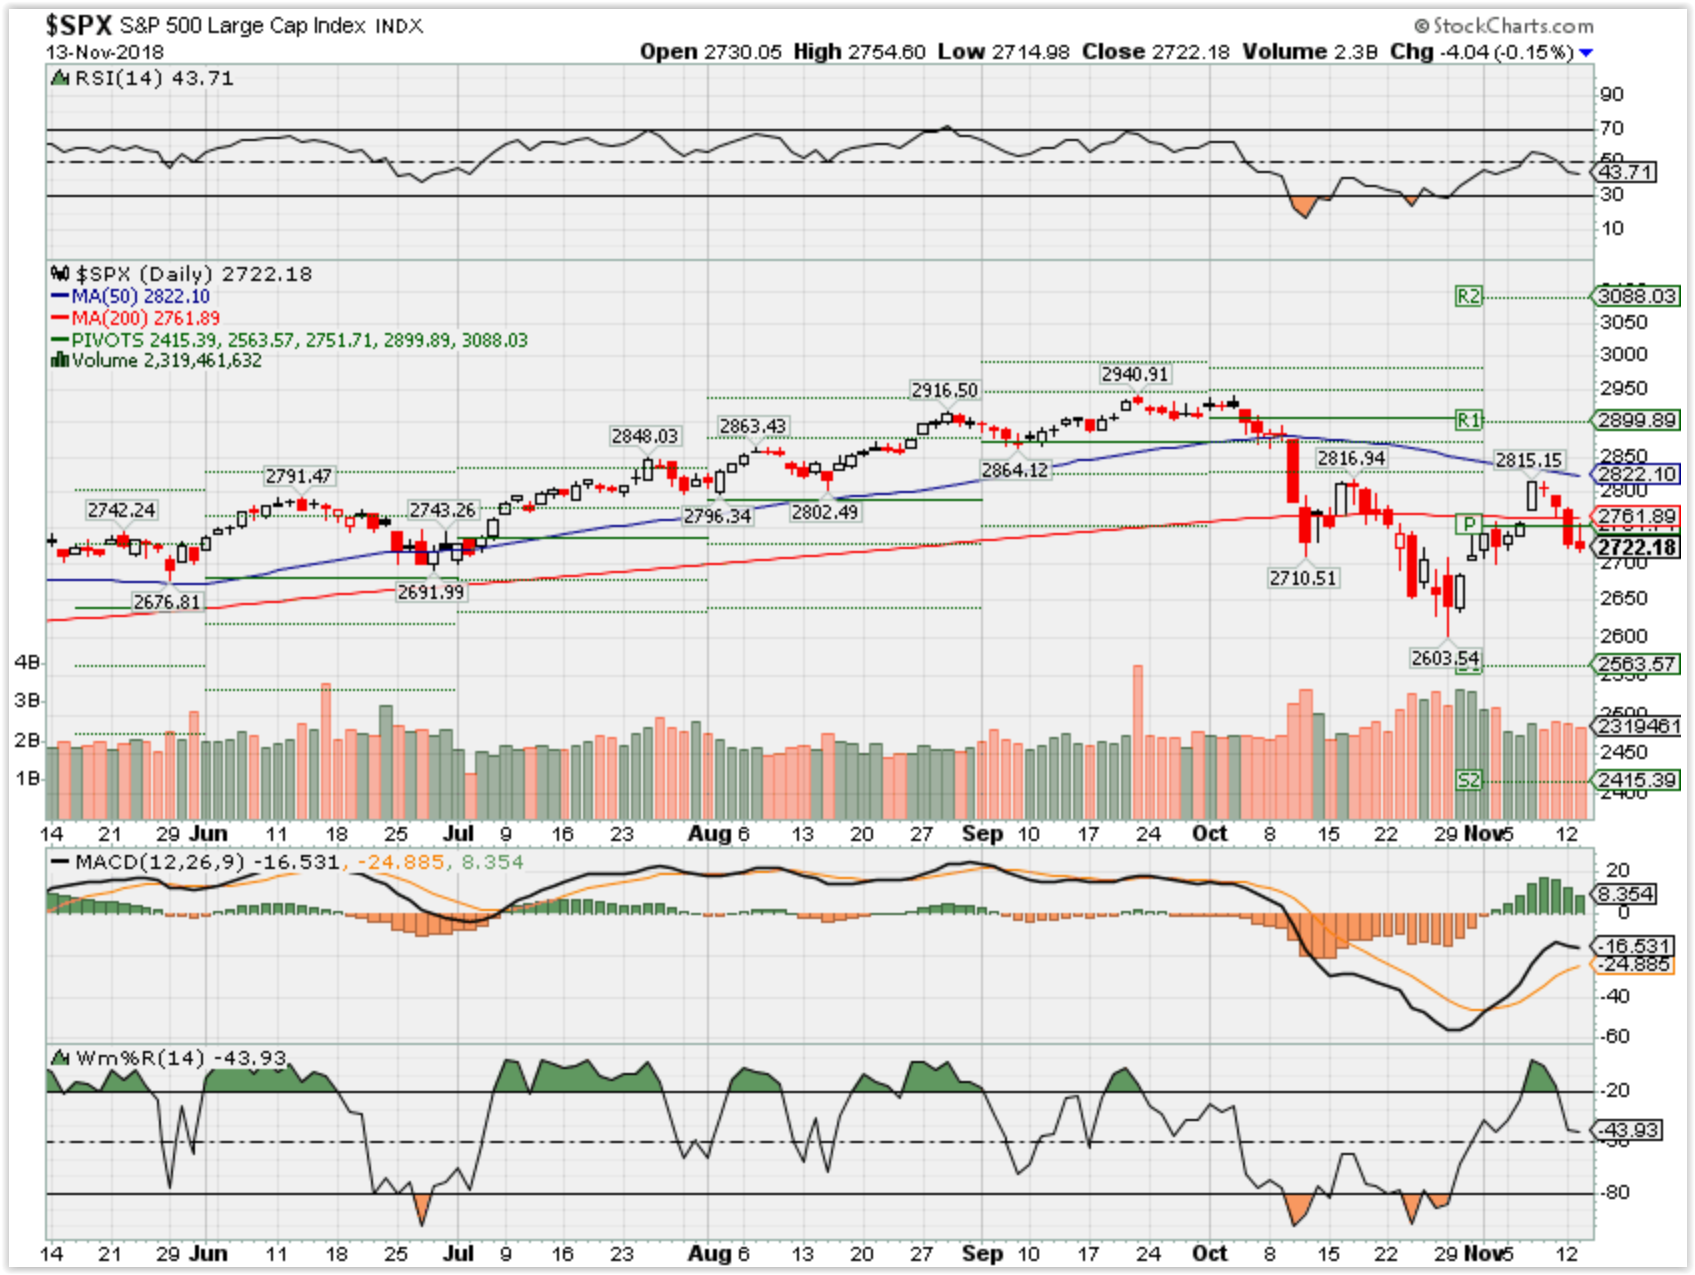
COMP – Bearish 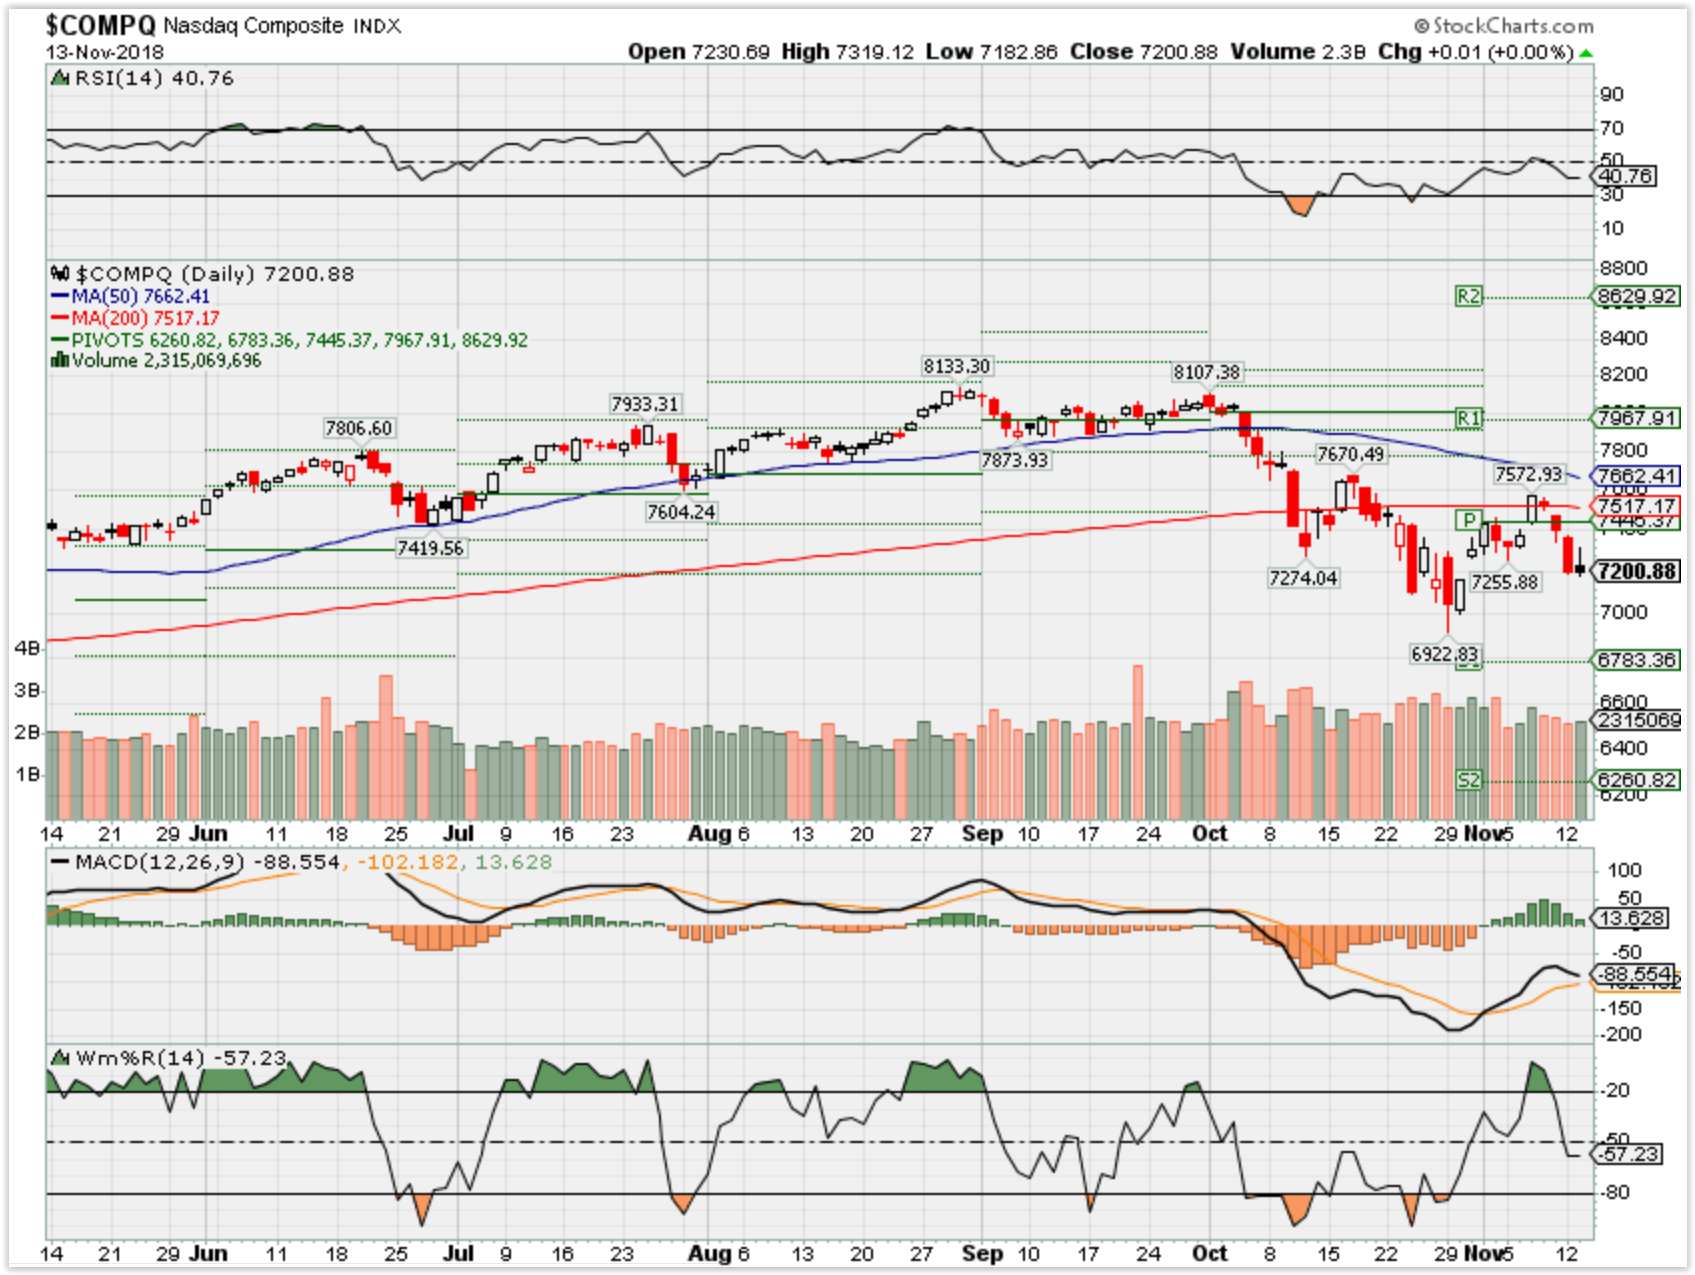
Where Will the SPX end November 2018?
11-13-2018 +1.0%
11-04-2018 +2.5%
Earnings:
Mon:
Tues: HD, BZH
Wed: M, CSCO, NTES
Thur: DDS, WMT, JWN, NVDA
Fri:
Econ Reports:
Tues: NFIB Small Business Optimism
Wed: MBA, CPI, Core CPI
Thur: Initial, Continuing, Retail Sales, Retail ex-auto, Empire, Phil Fed, Business Inventories, Import, Export,
Fri: Industrial Production, Capacity Utilization, Net Long Term TIC Flows, OPTIONS EXPIRATION
Int’l:
Tues – JP: GDP
Wed – CN: Industrial Production, Retail Sales,
Thursday –
Friday-
Sunday –
How am I looking to trade?
Protect the Stock Positions for earnings
AOBC 12/06
MRVL 11/29
RHT 12/19
If possible I will be rolling protection up or down to take profits on Long Puts and to move them to ATM prices for most if not all of my equity positions
www.myhurleyinvestment.com = Blogsite
customerservice@hurleyinvestments.com = Email
Questions???
Michael Virden’s Blogspot OCT Recap – http://mvirden.blogspot.com/
Homeowners poised to start tapping $14.4 trillion in equity, research says
- The amount of home equity that consumers are sitting on has been rising steadily since it hovered at around $6 trillion from 2009 through 2011.
- Homeowners who are considering turning to a home equity loanor line of credit should make sure they understand how these financial instruments work before signing on the dotted line.
Sarah O’Brien | @sarahtgobrien
Published 11:03 AM ET Fri, 19 Oct 2018 Updated 10:57 AM ET Sat, 20 Oct 2018CNBC.com
With untapped home equity at an all-time high of $14.4 trillion, homeowners could be poised to start cashing in, new research suggests.
Home equity — the difference between a property’s value and the amount owed on it — is about $1 trillion higher than its peak in 2005 before the Great Recession, according to a TransUnion study released this week. By 2009, the level had dropped to about $6 trillion as the housing market struggled to recover.
“Consumers have been building up that equity over the last seven years or so,” said Joe Mellman, senior vice president and mortgage business leader at TransUnion. “It has really come roaring back.”
With interest rates rising on consumer debt, home equity loans or lines of credit could be an appealing option for consumers looking to borrow money at a lower cost, Mellman said.
“When rates were low, consumers were taking out equity by refinancing their mortgage,” Mellman said. “Now, with [mortgage] interest rates up, a lot of people might not want to touch their original mortgage.”
In other words, if refinancing would mean paying a higher interest rate on your primary mortgage, it might not be a wise move.
The average rate on a 30-year traditional mortgage is now 5.01 percent, according to Bankrate. The average interest rate on a home equity loan is around 6 percent.
Why consumers tap their home equity
| Use | Description | Percent using* |
| Major expense | Take cash out, often for a large expense like home remodeling | 91 percent |
| Debt consolidation | Consolidate balances from other accounts | 41 percent |
| Refinance | Refinance to get a better rate or term | 23 percent |
| Piggyback | Concurrent with a mortgage origination, often used for down payment | 4 percent |
| Undrawn | Not used immediately (i.e., a rainy day fund) | 2 percent |
Source: TransUnion * Based on 2.4 million home equity loans originated between July 2016 and June 2017
The research found about 70 million homeowners would likely qualify for a home equity loan or line of credit.
However, there are some things to consider before signing up.
For starters, the tax break you could get for using home equity this way is no longer guaranteed.
As of this year, you can only deduct the interest on home equity debt if it’s used to buy, build or improve your home. You also can only write off interest on up to $750,000 in home loans, which includes your mortgage and any home equity loan or line of credit.
So if you tap your home equity to pay off, say, credit card debt or student loans, you cannot deduct the interest. However, you still might be able to pay off the debt faster if the interest rate is lower than what you were paying.
Additionally, be aware of exactly how the account works. If the interest rate is variable, it could fluctuate from year to year, moving higher or lower based on where rates are at each adjustment.
Also be aware of the draw period with home equity lines of credit. This is when you only pay interest, not any of the principal. When that draw period ends — say, 10 years out — your monthly payments can jump significantly as the lender requires you to begin paying down the principal as well.
Remember, too, that you are putting your home up as collateral when you tap your equity.
“You want to make sure you’re being safe in your decision-making about that,” Mellman said.
Sarah O’BrienPersonal finance reporter
Goldman’s ‘bear market risk indicator’ signals returns will be zero the next 12 months
- Goldman’s bear market indicator is at a rare 73 percent, its highest level since the late 1960s and early 1970s.
- At such levels, the tool predicts a zero average return over the next 12 months and a “substantial” risk of drawdown.
- The indicator is “flashing red,” wrote Goldman chief global equity strategist Peter Oppenheimer. “Historically, when the Indicator rises above 60 percent it is a good signal to investors to turn cautious.”
Published 5:26 PM ET Mon, 12 Nov 2018 Updated 7:03 PM ET Mon, 12 Nov 2018CNBC.com
Goldman Sachs’s bear market prediction tool is at an “elevated” level that has historically signaled a zero average return over the next 12 months and a “substantial” risk of drawdown.
Goldman’s bear market indicator — which takes into account the unemployment rate, manufacturing data, core inflation, the term structure of the yield curve and stock valuation based on the Shiller PE ratio — is at a rare 73 percent, its highest level since the late 1960s and early 1970s.
The indicator is “flashing red,” wrote Goldman chief global equity strategist Peter Oppenheimer. “Historically, when the Indicator rises above 60 percent it is a good signal to investors to turn cautious, or at the very least recognize that a correction followed by a rally is more likely to be followed by a bear market than when these indicators are low.”
The caution from one of Wall Street’s banking bellwethers came as the Dow Jones Industrial Average and S&P 500 each added to steep losses over the past few weeks. The Dow finished Monday’s session down 602 points — or 2.3 percent — while the broader S&P’s slid 1.9 percent, bringing its three-month move to a loss of 3.7 percent.
“Coupled with tighter financial conditions, the impact of U.S. trade tariffs and rising oil prices have slowed global growth momentum,” the Goldman stock strategist added. “We often see slightly higher volatility and a peak followed by a correction, and then another peak around the top of a bull market. We have seen corrections twice this year: in January and then again in October.”
Though nearly every sector lost ground on Monday, the pain was worst in technology, consumer discretionary, energy and financials, which all dropped more than 1.9 percent. Amazon, thought by many to be at the intersection of technology and consumer discretionary stocks, closed in a bear market and is down more than 20 percent from recent highs.
The Nasdaq Composite finished the day in correction territory.
But while the Goldman indicator may be suggesting tougher times ahead, Oppenheimer said there many be reason not to jump to conclusions about an upcoming bear market.
“There remain good reasons why this indicator has been consistent with a sharp correction rather than the start of a prolonged bear market,” he wrote. “We continue to expect a sustained period of low returns rather than a sustained bear market.”
For his part, Oppenheimer expected economic growth to slow, but does not forecast a recession. In order for the stock strategist to ring the alarm about impending recession, he said he’d need to see a sharp rise in inflation and interest rates. But because of lethargic inflation, there has been a trend lower in volatility and longer expansion phases.
The Fed’s preferred inflation gauge, the PCE price index excluding the volatile food and energy components, rose 0.2 percent in September after being flat in August.
That left the year-on-year increase in the so-called core PCE price index at 2.0 percent for a fifth straight month. The metric rose above the central bank’s 2 percent inflation target in March for the first time since April 2012.
“Our view about the prospects for low returns is based on the idea that, without a recession, a bear market is not very likely,” Oppenheimer concluded. “While the likelihood of negative returns rises as growth slows, it doesn’t
become high until GDP growth is below 1 percent.”
Cramer explains the Apple-led sell-off and what could stop the declines
- CNBC’s Jim Cramer unpacks Monday’s sell-off and says a combination of factors will help the stock market find a bottom.
- From Apple’s stock recovering to the Federal Reserve changing its tune on interest rates, seven things will help stocksreverse course, the “Mad Money” host says.
Elizabeth Gurdus | @lizzygurdus
Published 6:12 PM ET Mon, 12 Nov 2018 Updated 7:03 PM ET Mon, 12 Nov 2018CNBC.com
Stocks will only recover from Monday’s dramatic sell-off if seven key things happen to brighten the outlook for the broader market, CNBC’s Jim Cramer said as the major averages pulled back.
“The thinking behind today’s action is surprisingly simple: money managers are buying the winners and selling the losers,” he said on “Mad Money.” “Unfortunately, there are a heck of a lot more losers than winners, and I want to put that into context because such behavior, frankly, is highly unusual this close to the end of the year.”
Here are the things Cramer says will allow stocks to reverse course:
1. Apple
A recovery in the stock of Apple, which led much of Monday’s declines after a supplier report implied weakening iPhone orders, would be the first key to a broader reversal, Cramer said.
“It’s a tall order. We keep getting new negatives that frustrate buyers,” he said. “After today, there’s no denying that Apple has some sort of problem selling some of its phones. Is it China? Is it the developing world? Is it a slowdown here in America? We don’t know. Maybe it’s nothing. Then again, maybe it’s something. The question is, what’s the solution?”
Cramer figured that, eventually, Apple’s pricing structure and positive standing with customers would once again start attracting buyers to the stock. But “judging by the ferocity of the decline, … we aren’t there yet,” he warned.
2. FANG
Second, the FANG stocks — Cramer’s acronym for Facebook, Amazon, Netflix and Google, now Alphabet — also have to stabilize, the “Mad Money” host said.
To do that, Facebook has to move past its string of data-privacy issues; Amazon’s stock has to find its footing following the company’s softer-than-anticipated fourth-quarter forecast; people need to find a more cohesive way to value Netflix’s stock; and Alphabet needs to buck investors’ negativity, Cramer explained.
Of all four FANG members, “Alphabet is the biggest conundrum,” he said. “Their stock is pretty inexpensive. They have more than [$]100 billion in cash. They own search. They own online video. They own the self-driving car market, at least for now. I think it’s an outright buy. But no one cares. All this will start mattering at some lower price, though.”
3. Fed
Third, the market would benefit if Federal Reserve Chairman Jerome Powell acknowledged that he was “winning the war against inflation,” Cramer argued. Ideally, that would happen at Federal Open Market Committee meeting in December, at which the central bank is widely expected to raise interest rates again, he said.
Reiterating that he supports one more rate hike, Cramer cited the numerous factors that tell him the economy is slowing: the prolonged decline in oil prices, sliding prices for materials, lower home sales figures and prices, and high mortgage rates.
“Don’t forget, Powell thinks it is his job to slow the economy in order to prevent inflation. To be fair, that’s part of his job. … But the way the Fed tames inflation is by slamming the brakes on the economy so that wages stop rising. You know what? I think that’s ill-advised,” Cramer said. “Powell does not need to say that rate hikes are off the table. He just needs to say he sees concrete evidence that the rate hikes, so far, are working to tame inflation.”
4. China
Fourth, any sign that China may cooperate with the Trump administration’s trade demands would give stocks a boost, Cramer said, adding that the G-20 summit at the end of the month could be the deciding factor. President Donald Trump and Chinese President Xi Jinping will reportedly meet at the Buenos Aires, Argentina gathering.
“The Chinese economy is slowing faster than most people realize, and when the tariffs automatically increase next year, it will hurt them a lot more than it hurts us,” Cramer said.
“Many American companies are frantically moving their orders to Cambodia, to Thailand, to Vietnam,” he continued. “It’s a huge drain on the Chinese economy and it’s accelerating. But it’s possible the Communist Party would rather wreck their own economy than be seen bowing to America.”
5. Dollar
The U.S. dollar is also becoming “a real headwind” for stock prices, Cramer said.
“Stocks trade based on earnings estimates. The strong dollar, which continues to accelerate versus pretty much every other currency, seems unstoppable,” he explained. “That’s bad for the earnings of most companies. So, despite the lower energy costs, the earnings estimates for next year are still too high.”
6. Quality
The “flight to quality” on Wall Street also needs to end for the broader market to go higher, the “Mad Money” host said, pointing to the rallies in consumer packaged goods stocks like Mondelez, Procter & Gamble and Coca-Cola.
“It’s a bad sign — same with the drug stocks,” he said. “This says money managers are hiding in stocks that do well in a recession.”
7. GE
Finally, shares of General Electric, the closely watched industrial giant in the midst of a long-winded turnaround, need to reverse course, Cramer said.
“This morning my colleague David Faber pulled up with Larry Culp — he’s the CEO — and they talked about how the company can turn it around,” he said. “All I heard was it’s going to take a lot of time, a lot of time, and then a lot of time. If that’s the case, why own it? Worse, why not sell it?”
Final thoughts
“Some, if not all, of these things [have] to occur … before this market can find a sustainable bottom,” he concluded. “Everything else is just a phony false floor not to be trusted.”
https://www.cnbc.com/2018/11/13/why-oil-prices-tumbled-from-four-year-highs-into-a-bear-market.html
Why oil prices went from four-year highs to a bear market in just six weeks
- S. crude is plunging from nearly four-year highs six weeks ago to its lowest level since early December.
- The market outlookhas changed: Investors were worried about a shortage of oil, but now expect supply to outstrip demand.
- Investors dumped risk assets like crude futures during a broad market sell-off last month.
Tom DiChristopher | @tdichristopher
Published 4 Hours Ago Updated 3 Hours AgoCNBC.com
The oil market is undergoing a stunning reversal as crude futures wipe out this year’s gains after hitting their highest levels since 2014 just six weeks ago.
The slump reflects a fundamental change in the outlook for the oil prices. A month ago, traders were concerned that a looming shortage of oil would push crude futures to $100 a barrel. Now, supply is expected to swamp demand at the start of 2019.
As a result, oil prices have plunged more than $20 a barrel since the start of October, when Brent crude rose to nearly $87 a barrel and U.S. crude traded just shy of $77. Both benchmarks are now trading firmly in bear market territory, having fallen more than 20 percent from their 52-week highs.
Along the way, U.S. crude has posted its longest losing streak since it began trading in New York more than three decades ago. The contract has now fallen for 12 consecutive sessions. It settled at $55.69 on Tuesday, its lowest closing price since Nov. 16, 2017.
The roots of the pullback can be traced back to the most recent rally itself. At the peak of the run-up, many energy analysts said oil prices never should have risen so far so fast.
Crude futures rose to four-year highs on Oct. 3 as the market braced for renewed U.S. sanctions on Iran, OPEC’s third biggest producer. Through September, the threat of sanctions wiped about 800,000 barrels a day off the market, fueling speculation that some oil importers would struggle to find supplies.
Stock market sell-off
That left oil prices vulnerable to a pullback just as the stock market was about to sell off. One week after crude futures struck their highs, two-thirds of the stocks in the S&P 500 plunged into correction territory.
That kicked off a broad market rout that saw investors shed risk assets, including crude futures. Oil and stocks do not always move in tandem, but the assets were closely correlated during last month’s sell-off.
Right around the same time that investors started dumping stocks and commodities, concerns about faltering oil demand sharpened.
Weaker consumption outlook
In October, both OPEC and the International Energy Agency said oil consumption would grow less than previously forecast, pointing to signs of slowing global economic growth due to trade tensions, rising interest rates and weak emerging market currencies.
Forecasters grew particularly concerned about oil demand deteriorating in places like India, Turkey and Indonesia as oil prices hit new highs in October.
“For many developing countries, higher international prices coincide with currencies depreciating against the U.S. dollar, so the threat of economic damage is more acute,” the International Energy Agency said last month.
The U.S. dollar has risen nearly 3 percent against a basket of currencies over the last two months. That makes crude oil, which is sold in dollars, more expensive to holders of other currencies.
Rising output
Meanwhile, the world’s top three oil producers are pumping at or near all-time highs and the 15-member OPEC cartel is in the middle of a coordinated production increase.
U.S. output has topped 11 million barrels per day in recent months, while Russia is pumping at post-Soviet era highs at roughly the same level. Saudi Arabia has trailed just behind at 10.6 million bpd in October.
OPEC, along with Russia and several other producers, began capping their output in January 2017 to drain a global crude glut and end a punishing oil price downturn. However, they agreed to reverse course and hike output in June after cutting output more than they intended.
The rising production and weakening demand outlook now has much of the market convinced that supply will outstrip the world’s appetite for oil early next year.
Iran waivers
The Trump administration’s decision to allow eight countries to continue importing Iranian crude for the next six months has also relieved downward pressure on oil prices.
“That really messed up the calculus” for OPEC and its oil market allies, said John Kilduff, founding partner at energy hedge fund Again Capital. The group was pumping more oil to offset the anticipated drop in Iranian exports, but “the waivers really undercut that,” Kilduff said.
“They worked so hard over the last few years to balance the market. They sort of tripped into an oversupply situation,” he told CNBC.
With demand growth looking shaky and oil prices collapsing, OPEC and its allies are now considering a fresh round of output cuts.
Last month, a committee representing the group said the alliance may have to once again throttle back production to prevent oversupply. The group essentially reiterated that position at its latest meeting on Sunday. The following day, Saudi Arabia’s energy minister said the group believes an output cut approaching 1 million bpd may be in order.
Still, oil prices continued to move lower on Tuesday, after President Donald Trump urged OPEC and Saudi Arabia to stay the course and as Russia’s energy minister continues to express skepticism about the wisdom of supply cuts.
HI Financial Services Mid-Week 06-24-2014