
HI Financial Services Commentary 10-10-2018
Youtube Link: https://youtu.be/cdfofFo8Efw
What I want to talk about today?
Our futures look awful Wednesday Morning
I collar trade to make up some of the downward movement
It’s a fools game to outguess the market timing
$1 = $1.50 = $0.75 on a ZERO percent return
NFIB Small Business Index 107.9 vs est 109
Things look like a pretty big drop and I am mostly protected with long puts preparatory for Earnings
I have protection on BAC for next Monday 29 Nov 23 long puts
What happening this week and why?
Week before Earnings season technically starts
Start the first of three weeks for financial earnings
Where will our markets end this week?
Uncertain due to volatility within individual indexes
DJIA – Bullish 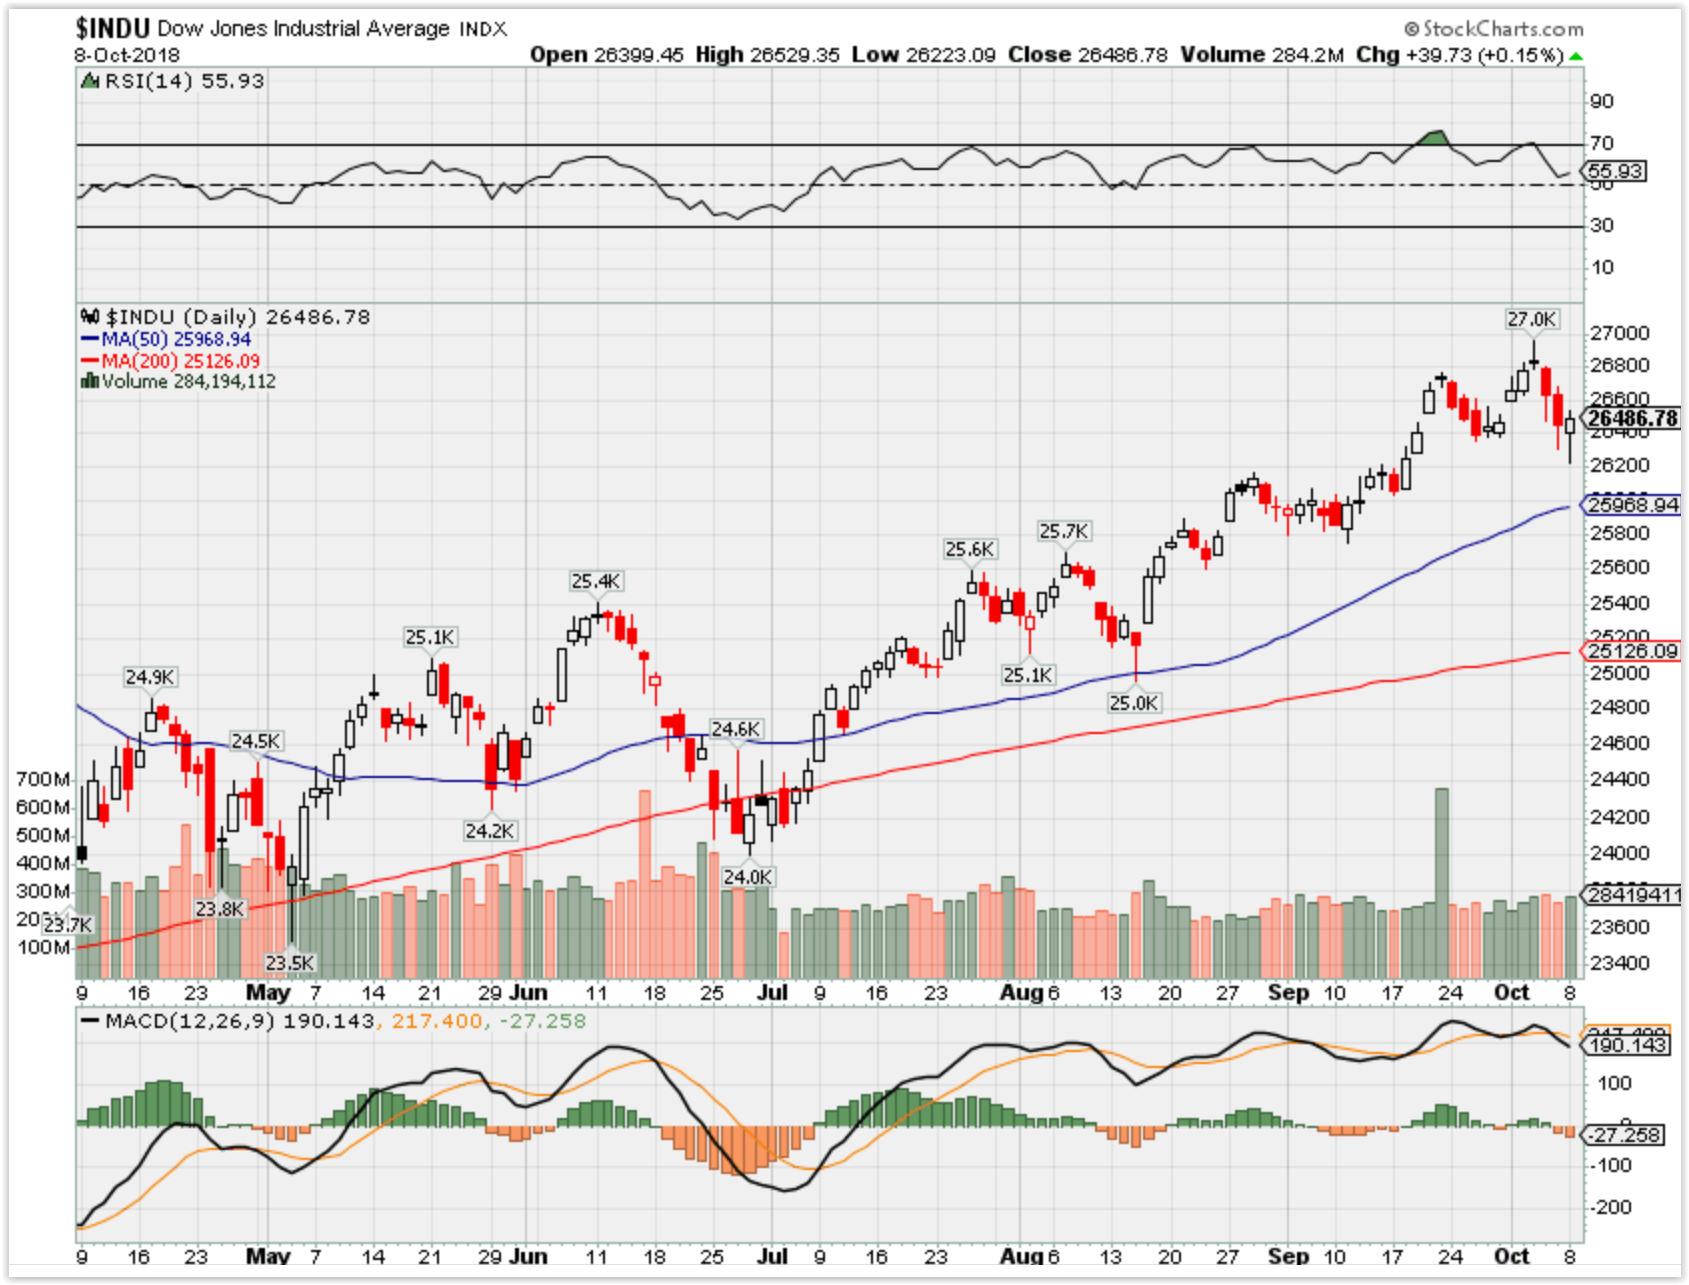
SPX – Bearish but we have support at the 50 SMA 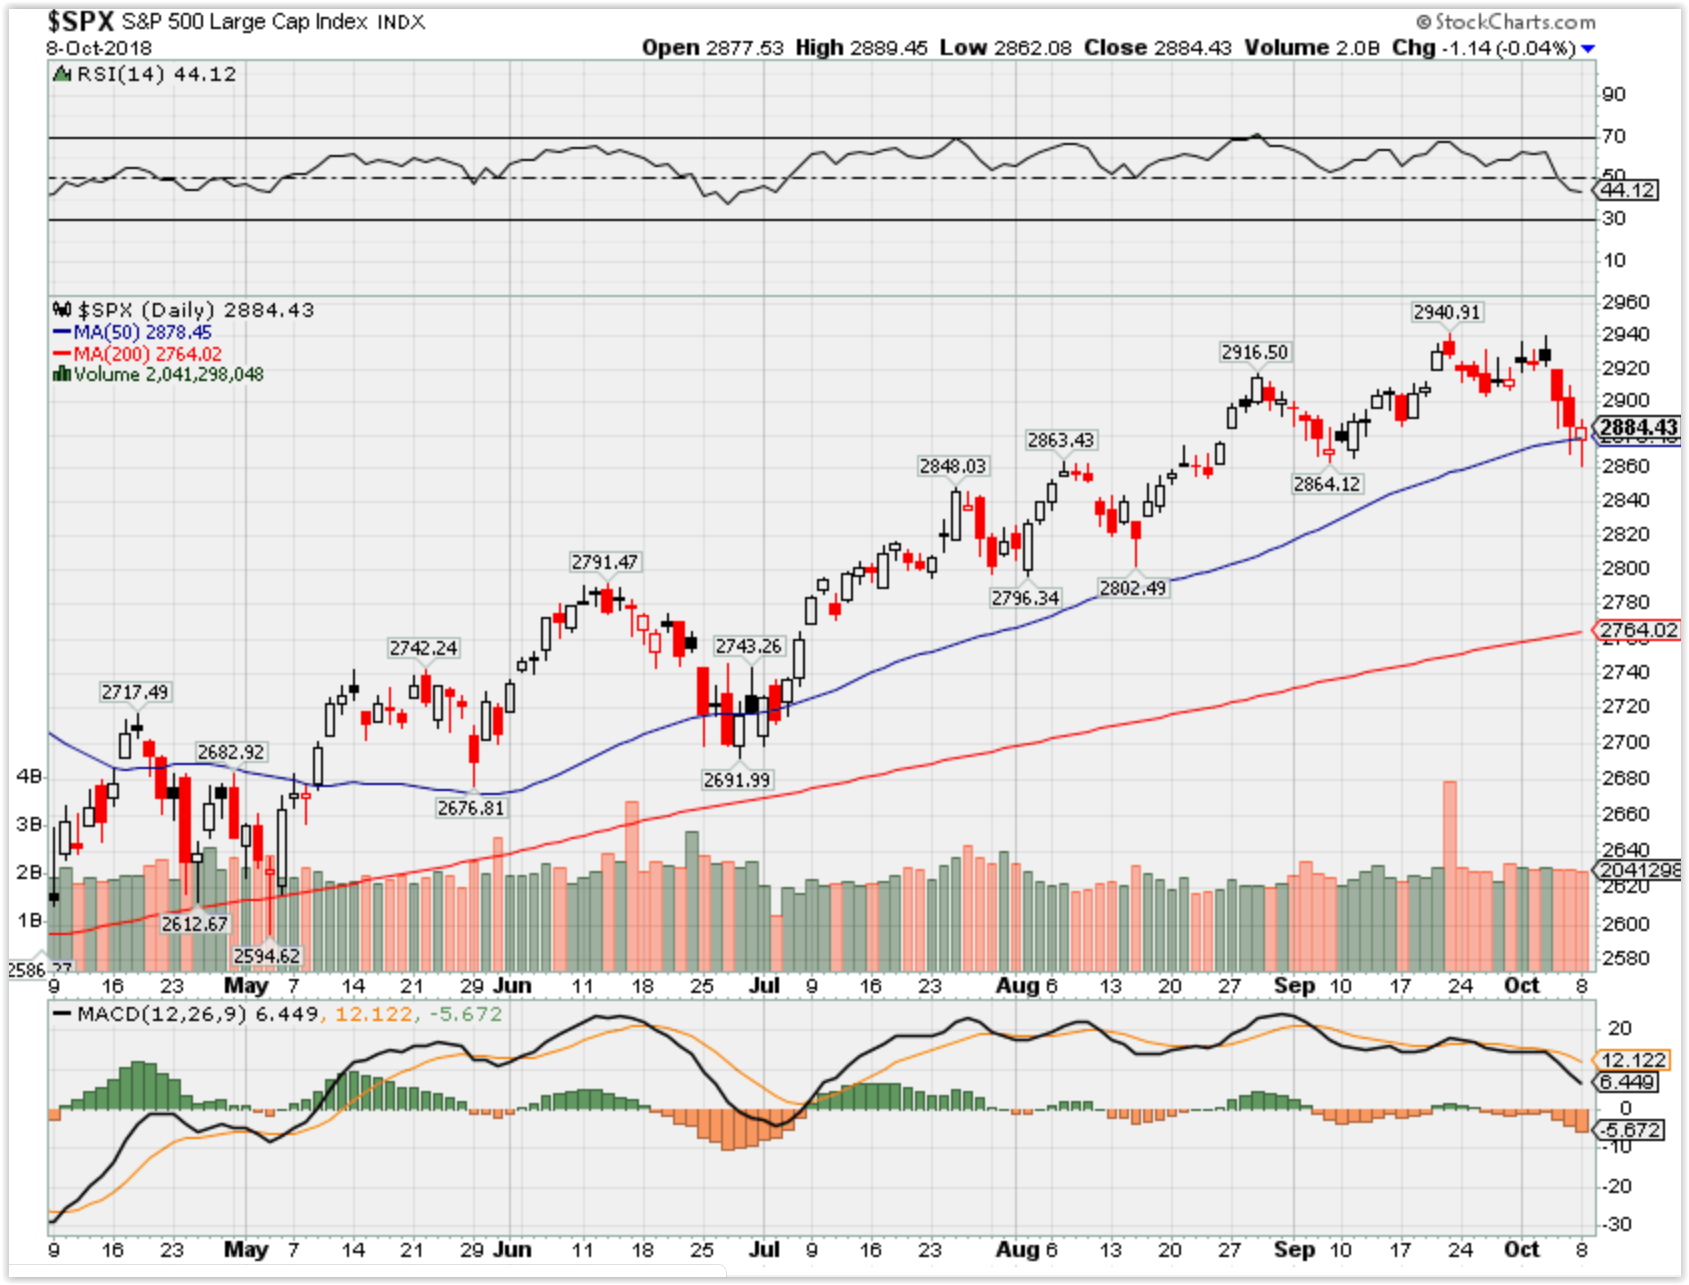
COMP – Bearish 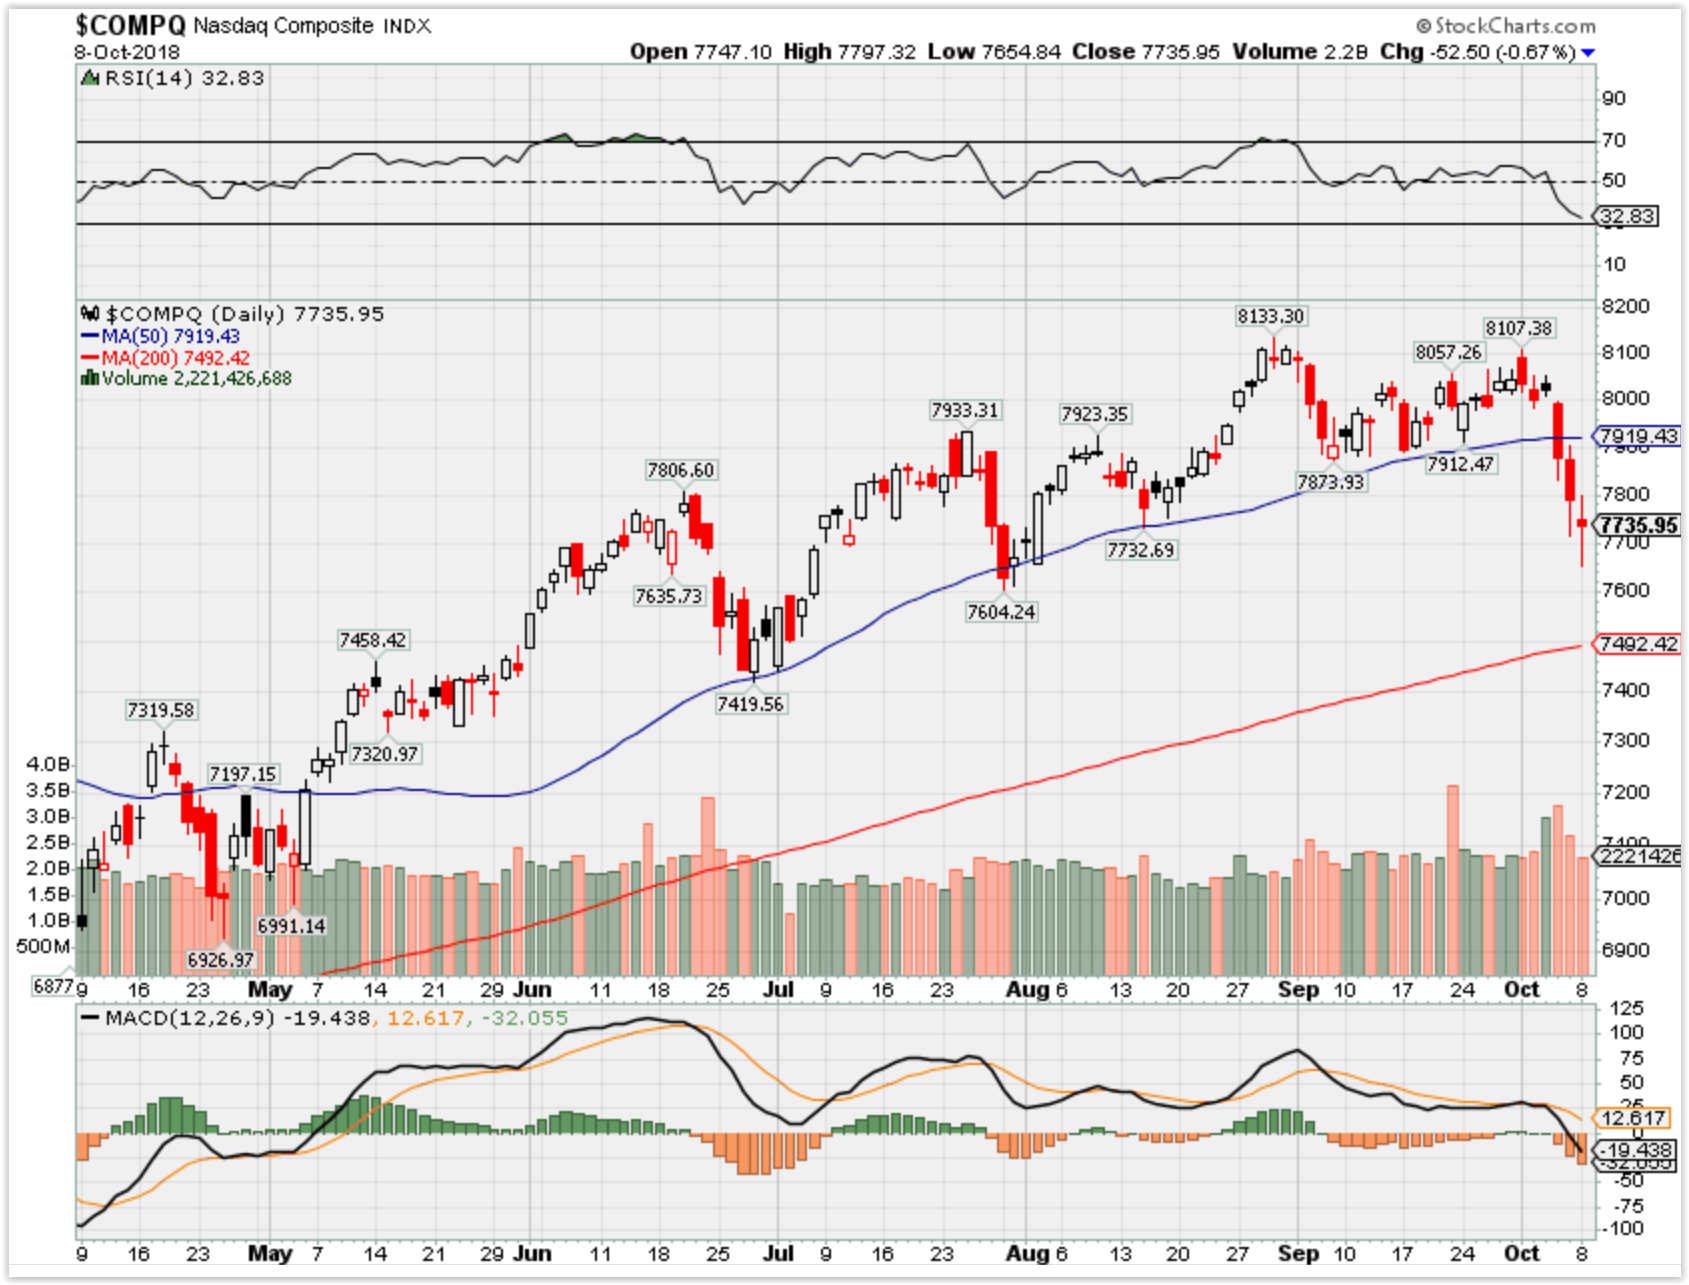
Where Will the SPX end October 2018?
10-09-2018 +1.5%
10-02-2018 +1.5%
Earnings:
Tues:
Wed:
Thur: DAL, WBA
Fri: JPM, WFC, C, PNC
Econ Reports:
Tues: NFIB Small Business Optimism
Wed: MBA, PPI, Core PPI, Wholesale Inventory
Thur: Initial, Continuing, CPI, Core CPI,
Fri: Import, Export, Michigan Sentiment
Int’l:
Tues –
Wed –
Thursday –
Friday-
Sunday –
How am I looking to trade?
So I got fearful and put long puts on everything starting last Wednesday for this coming earnings
www.myhurleyinvestment.com = Blogsite
customerservice@hurleyinvestments.com = Email
Questions???
Look at EWZ strangle/straddle
https://seekingalpha.com/article/4205172-2018s-dogs-world-stock-market-wrap
2018’s ‘Dogs Of The World’ (Stock Market Wrap)
Sep. 10, 2018 3:10 AM ET
During 2018, up until May, the world’s major stock markets had similar performance. Since then, the US has pushed higher, whereas most other markets have sunk lower. That performance gap widened considerably during August and early September. Today, I give a snapshot of what’s happened and why it could lead to big opportunities.
First, here’s a chart that compares the price moves of some major MSCI Indices since the start of the year: the USA, Europe and Emerging Markets.
It clearly shows, at the macro level, how performance has diverged since May, especially when measured in US dollars. There have been a lot of headlines about dramatic falls in certain emerging markets, but it’s clear that other places have underperformed as well. As you’ll see below, performance is very mixed, depending on which country we look at.
I’ve had a look at the performances of regional and country MSCI indices for the year to date, up until 5th September. This next chart compares 2018’s dollar price moves for the US, Europe and Emerging Markets.
A lot of that fall in Europe can be put down to currency moves. The dollar strengthened against most currencies during 2018. For example, the euro lost 3.1% against the dollar and the British pound is down 4%. That said, the Swiss franc and Japanese yen have held their ground, up 0.2% and 0.9% respectively.
Digging in one more level, below is a chart of selected developed market performances so far this year.
Apart from the US, it’s red ink across the board (although, remember that these figures are price moves only and exclude dividends received).
The smallest falls have been in places like Switzerland, Japan and Canada. In the case of Canada, most of the fall can be attributed to the Canadian dollar, which is down 5% against its US cousin.
Bigger developed market falls have occurred in Singapore, Spain, Germany, Belgium and Austria. European markets have taken hits from things such as trade tensions with the US, the currency crisis in nearby Turkey and continued fears over bank solvency in Italy.
What’s driven Singapore’s fall is less clear. The Singapore dollar has lost 3% against the US dollar, despite Singapore’s rock-solid finances (and the USA’s escalating budget deficits). At the end of August, the MSCI Singapore index had a price-to-earnings ratio of just 13 and a dividend yield of 4.2%. I intend to take a closer look. It could be a good hunting ground for bargains at this level.
Let’s move on to the Emerging Markets. Here’s another chart of selected index price performances so far this year (again, all in US dollars for comparability).
You can see right away that it’s a very mixed bag. Countries such as Colombia, Malaysia, Thailand and Mexico have so far escaped the carnage. Argentina and Turkey have completely collapsed and been cut in half. Many countries are down over 20%, including Brazil, Indonesia, Greece and South Africa.
Argentina is technically a frontier market. But MSCI, the index provider, has already announced it will be upgraded to an emerging market from May 2019.
The Argentine stock market collapse is no mystery: the country has had a currency crisis, and the peso has been cut in half. Even with the big fall, I still think Argentine stocks are overpriced for the high-inflation environment, expected to come in around 40% this year (for more, see here).
Turkey also had a currency collapse. Problems have built up for years, both financially and politically. But the final straw was US sanctions imposed due to the ongoing detention of an American priest who is accused of taking part in a 2016 coup attempt against President Erdogan. It’s also next door to Syria, where there’s ongoing risk of confrontation between US and Russian armed forces (whether by design or accident).
South Africa has entered the limelight due to government plans to confiscate farmland from professional farmers and redistribute it to the populace. Zimbabwe did this a number of years back, leading to a collapse in agricultural production and a currency crisis that ended in hyperinflation.
Greece is still shackled to the euro and drowning in government debt (179% of GDP). A decade after the global financial crisis, the economy is still a quarter smaller than previously. The Greek depression continues.
Indonesia’s currency, the rupiah, has 9% against the US dollar this year. Despite a fall of 24%, Indonesian stocks can hardly be described as a bargain. At the end of August, the index had a trailing P/E of 16.6, which isn’t exactly cheap. That said, in dollar terms the market has now gone sideways since the start of 2011. I plan to take a closer look.
Brazil has plenty to concern investors. Although inflation is relatively low (4.2%), the political situation remains highly uncertain. Presidential elections happen in October.
The leading candidate in the polls, Luiz Inacio Lula da Silva (“Lula”), is in jail for corruption and so far banned from running (subject to a final appeal). The unjailed poll leader is Jair Bolsonaro, a populist that the media usually describes as “far right”. He was stabbed in the guts this week during an election rally. Brazil looks like a powder keg of social tensions right now, and I still recommend staying away.
Now, some comments on a couple of other notable markets that have actually held up pretty well.
Russian stocks are dirt cheap (P/E of 6 or 7, dividend yield of 5.5%). That was already the case at the beginning of the year, which probably explains why they’ve only fallen 6.6%.
On a valuation basis, Russian stocks are a steal. However, significant risks remain of further sanctions from the US or EU, or a confrontation with US forces in Syria. I continue to recommend staying away until there are clear signs of better relations between the US and Russian governments.
India has also held up well, with stocks down just 4.7% in dollar terms. This is a surprise to me, given all that’s gone on in the markets. At the end of August, the MSCI India index had a trailing P/E of 25 and a dividend yield of just 1.2%. Indian stocks remain expensive and tend to be pretty volatile, so I think this could be the next big shoe to drop. Again, I recommend investors stay away for now.
What to expect and potential opportunities
September is often a tricky time of year for global stock markets. Professional traders and fund managers in the dominant financial markets of the northern hemisphere seem to come back from summer holidays in a different mood.
Plus, the US has midterm elections coming up in November, so the volume of political jockeying is likely to get turned up to 11 over the next couple of months. US trade tensions with the EU and China continue as well.
Also, US consumer price inflation remains above target and wage inflation is picking up too, indicating that further rate rises are likely. This will tend to keep the dollar on an upwards trend, weighing on stock prices in other countries (in dollar terms).
However, going into next year there could be some great opportunities.
Emerging market index funds (at least those based on MSCI indices) will include Argentine stocks from the middle of next year. If Argentine stocks fall another 20% from current levels, the currency stabilises and the political situation calms down, front-running the country’s elevation to emerging market status could be a great opportunity.
Certain other emerging markets could present bargain basement entry points as well, but it will be on a case-by-case basis. In the meantime, on the developed market side, there are more and more bargains to be found across Europe.
Just like the US – in fact, perhaps more so – Europe is full of companies with big, global businesses (including in the US itself). In many cases, the prices no longer reflect that. When index investors in passive funds pull out of the market, the selling is indiscriminate. A lot of stuff gets cheap. Opportunities then abound.
I’ve recently shown that US stocks are much cheaper than the headline valuation ratios indicate. Once you strip out expensive tech and big bubble stocks like Amazon Inc. (NASDAQ:AMZN), the rest of the S&P 500 is trading around its historical median level (see here for more).
Price falls mean new opportunities for profit. Europe, Argentina, Singapore and Indonesia are just some of the potential hunting grounds. Not to mention a lot of areas of the US market.
There’s no question that so far 2018 has been a tough year for many of the world’s stock markets. But big price falls are the prelude to big price gains. I’ll certainly be looking out for new opportunities in coming months.
Disclosure: Of Wealth expressly prohibits its writers from having a financial interest in any individual securities they recommend to their readers, other than collective investments such as exchange traded funds.
https://www.cnbc.com/2018/10/05/ron-paul-us-barreling-towards-a-recession-and-theres-no-escape.html
Ron Paul: US is barreling toward a stock market drop of 50% or more, and there’s no way to prevent it
Stephanie Landsman | @stephlandsman
Published 5:00 PM ET Sun, 7 Oct 2018 Updated 14 Hours AgoCNBC.com
Ron Paul believes the bond trading pits are giving investors a dire message about the state of the nation’s economy.
According to the former Republican congressman from Texas, the recent jump in Treasury bond yields suggest the U.S. is barreling toward a potential recession and market meltdown at a faster and faster pace.
And, he sees no way to prevent it.
“We’re getting awfully close. I’d be surprised if you don’t have everybody agreeing with what I’m saying next year some time,” he said Thursday on CNBC’s “Futures Now.”
His remarks came as the benchmark 10-Year Treasury yield, which moves inversely to its price, rallied to seven year highs, intensifying fears over rising inflation. It may be beneficial for personal savings accounts, but it could deliver irrevocable damage to those in adjustable mortgages, or for auto buyers looking to finance a new vehicle.
“It can be pretty well validated by looking at monetary history that when you inflate the currency, distort interest rates and live beyond your means and spend too much, there has to be an adjustment,” he said. “We have the biggest bubble in the history of mankind.”
Paul is a vocal libertarian known for an ardent grassroots fan base that propelled him to multiple presidential runs, as well as his grim warnings about the economy. Yet he has been warning investors for years that an epic drop of 50 percent or more will eventually hit the stock market. He predicted the February correction, but not in size and scope.
By spring, the correction was over, and the S&P 500 and Dow were hitting all-time highs again by August and September, respectively. The Dow registered its latest all-time high of 26,951.81 last Wednesday.
Paul acknowledges his prior calls for a downturn haven’t come to fruition. Yet, he points out it’s just a matter of time, based on the looseness of U.S. monetary policy since the 2008 financial crisis.
“I know it’s going to happen,” Paul said. “It will come, and the bubble is bigger than ever before.”
https://www.cnbc.com/2018/10/05/why-wall-street-cares-so-much-about-10-year-treasury-rates.html
Here’s the number everyone in the financial markets is obsessing about and why
- The 10-year note’s yield is perhaps the most widely tracked rate across the financial universe.
- Its yield is used as a benchmark for other types of debt, including corporate and agency bonds, such as Fannie Mae and Freddie Mac.
- The rate is also a barometer for 30-year fixed mortgagerates, auto loans, student loans and credit card annual percentage rates.
Published 12:09 PM ET Fri, 5 Oct 2018 Updated 15 Hours AgoCNBC.com
Last week, Wall Street was abuzz over a surge in the yield for the benchmark 10-year Treasury note, which has repeatedly topped levels not seen since 2011.
These days, when rates rise, stocks fall. That’s because rising rates ripple throughout the economy, raising costs for companies that want to issue debt, raising mortgage rates for homeowners and buoying credit card bills for the typical consumer.
The yield rose to as high as 3.24 percent on Friday. Bond traders are also impressed by the pace of the increase. The yield on the 10-year note has climbed about 15 basis points this week alone after trading in an innocuous range around 2.8 percent for much of summer 2018.
But why should investors care?
While short-term interest rates are most sensitive to the activity of the Federal Reserve — which hiked the federal funds rate a third time for the year in September — the market dictates long-term rates.
It is used as a benchmark for many other types of debt, including corporate and agency bonds, such as Fannie Mae and Freddie Mac. Movements in the 10-year government rate can also have a direct impact on consumers.
The rate is a barometer for 30-year fixed mortgage rates, auto loans, student loans and credit card annual percentage rates.
The long-term chart of these rates shows how they all move in tandem with the 10-year yield.
10-year Treasury rate vs. mortgages, auto loans and corporate debt (click to enlarge)
Source: Board of Governors of the Federal Reserve, Freddie Mac. Retrieved from FRED.
The average 30-year fixed-rate mortgage rate decreased 1 basis point to 4.71 percent last week, just off the highest level in seven years, according to Freddie Mac.
Here is a list of the financial instruments the 10-year Treasury yield impacts:
- Corporate bond rates
- 30-year fixed-rate mortgage rates
- Credit card annual percentage rates
- Auto loans
- Student loan rates
- Personal loan rates
- Savings interest rates
These ETFs are the biggest winners when interest rates are climbing
- CNBC used analytics tool Kensho to determine the best-performing ETFs when ratesare rising.
- The VanEck Vectors Oil Services ETF is the best performing exchange-traded fund in the month of a rising rate
- Strong economic data and comments on U.S. monetary policy from the top Federal Reserve official have been a boon for interest rates.
Michael Sheetz | @thesheetztweetz
Interest rates are on the rise, spooking investors who fear the trend will make the economy sluggish and increase costs for companies. But several exchange-traded funds thrive when interest rates rise, giving investors an option in this tougher market environment, if history is any indication.
CNBC used analytics tool Kensho to determine the best-performing ETFs when the 10-year Treasury note yield rises 25 basis points or more over a span of 30 days. There have been 18 instances of such a rate move happening since 2008. Last week alone, the 10-year yield rose about 18 basis points to above 3.2 percent.
Shares in the VanEck Vectors Oil Services ETF saw a 6.5 percent boost over the month when rates jumped, while shares of the United States Oil Fund ETF ran up 4.5 percent, according to Kensho. The SPDR S&P Regional Banking ETF is also a top-performer, surging 4.9 percent.
Here were the best ETFs:
Strong economic data and comments on U.S. monetary policy from the chairman of the Federal Reserve were a boon to interest rates last week. The 10-year U.S. note yield jumped as unemployment continues to drop, the U.S. services sector is expanding rapidly and Fed Chairman Jerome Powell said the central bank is “a long way” from getting interest rates to neutral.
Combined, all these factors led the benchmark 10-year U.S. note yield to jump near its highest levels in more than seven years.
But not all ETFs see the same historical success in a rising interest rate environment. The United States Natural Gas Fund falls 5.4 percent on average during 30-day periods of rising rates, according to Kensho. Two gold-focused ETFs – VanEck Vectors Junior Gold Miners and VanEck Vectors Gold Miners – also underperform for the following 30 days, each down 4.9 percent on average.
These were the worst ETFs:
– CNBC’s Fred Imbert contributed to this report.
These are the areas of the stock market where investors should be when interest rates are rising
Published 12 Hours Ago Updated 5 Hours AgoCNBC.com
When interest rates are rising, sectors like financials and energy tend to beat the rest of the stock market, historical analysis shows.
CNBC used analytics tool Kensho to determine the best-performing sectors in the S&P 500 when the 10-year Treasury note yieldincreased 25 basis points or more over a span of 30 days. There have been 18 instances of such a move happening since 2008.
The 10-year yield surged about 18 basis points last week alone to 3.23 percent and investors are scrambling to play the impact as these higher rates ripple through the economy. The U.S. Treasury market is closed Monday in honor of the Columbus Day holiday.
The Financial Select Sector SPDR fund (XLF) returned an average of 3.1 percent over a one-month span when rates were rising sharply, according to Kensho. The Energy Selector Sector SPDR fund (XLE)averaged a gain of 2.8 percent in such instances.
Banks turn a profit by charging borrowers higher, longer-term interest rates compared with the lower, short-term interest rates they dole out to savers. Bank of America is up 7.8 percent in the last three months; J.P. Morgan Chase is up 10.1 percent; and Citigroupis up 7.8 percent. The Financial Select Sector ETF is up 5 percent over the period.
WTI crude futures, meanwhile, closed up 1.5 percent for the week last Friday, their fourth straight positive week for the first time since January.
Other winning sectors when rates rise include consumer discretionary and technology stocks, which return 2.3 percent and 2 percent, respectively, in such instances.
Recent economic data — such as historically low unemployment and expanding corporate profits — have helped buoy interest rates in the past few weeks.
On Friday, the government said the unemployment rate dropped to 3.7 percent, a level not seen in nearly 50 years. Average hourly earnings, meanwhile, rose 8 cents — or 0.3 percent — over the month, matching August’s gain and hinting at burgeoning inflation.
The positive economic data has also helped the Federal Reservejustify its third quarter-point increase in the federal funds rate in September. The central bank also upped its anticipation for economic growth this year to 3.1 percent, citing manageable inflation and an unemployment rate of 3.9 percent. For his part, Fed Chair Jerome Powell said Wednesday that the central bank is “a long way” from a neutral level of interest rates, implying more rate hikes to come.
Worst performers
The quick rise appeared to catch stock investors unprepared, with the S&P 500 clinching its first back-to-back weekly decline since late June by Friday’s close.
Lagging sectors include bond-proxy utilities stocks as well as health care.
CNBC again used analytics tool Kensho to determine the worst-performing sectors in the S&P 500 when the 10-year Treasury note yield increased 25 basis points or more over a span of 30 days.
The Utilities Select Sector SPDR ETF is up only 1.2 percent in the past three months, underperforming the S&P 500’s 4.5 percent gain.
Atlanta-based Southern Co., a gas and electric utility holding company, is down more than 8 percent in the past three months, while NextEra, Duke Energy and Dominion have all underperformed the broader market.
These stocks usually pay high dividends, which become less attractive when interest rates rise.
FANG stocks have plummeted from their highs, but one may be near a bottom
Published 8:30 AM ET Fri, 5 Oct 2018 Updated 9:03 AM ET Fri, 5 Oct 2018CNBC.com
FANG got wrecked this week.
Facebook, Amazon, Netflix, and Google parent Alphabet plummeted on Thursday, compounding weakness that has plagued the broader tech space.
At least one of those names could have hit a bottom, according to Matt Maley, equity strategist at Miller Tabak.
“The stock that I think could be compelling down here is Facebook,” Maley said on CNBC’s “Trading Nation” on Thursday. “It’s not a crowded trade any more. It’s been washed out.”
Facebook is the only stock of the group negative for the year. It has dropped 10 percent in 2018, the bulk of those losses sustained after its notorious $120 billion drop in market cap in late July after its worrisome second-quarter earnings statement.
While Maley says the fundamentals in other FANG stocks might be more constructive, their steep run-up means they’re more vulnerable to a pullback than Facebook.
“If the market begins to roll over, you’re actually going to see the Googles and the Netflixes, some of that fast money, the momentum money, start to sell in a little bit of a panic move, but that money has already disappeared from Facebook,” said Maley.
Facebook’s relative strength index, a measure of momentum, tumbled from above 70 in July to below 40 in October. Its drop indicates the stock is approaching oversold conditions.
“One caveat, however, is the $150 level,” added Maley. “That’s the 2018 lows. You break below that level, that’s the line in the sand. That would give it an important lower low, and be very negative for the stock.”
Facebook fell below $150 at the year’s lows in late March. It is still a 5 percent decline from those levels. It finished Thursday’s trading day at $158.85.
Mark Tepper, president of Strategic Wealth Partners, is placing his bets with a tech pick outside of the FANG stocks.
“With Adobe we like them because we’re extremely bullish on the cloud space,” Tepper told “Trading Nation” on Thursday. “There’s just not enough storage space in the cloud compared to where we think it’s going to be five to 10 years down the road.”
Adobe’s document cloud business reached record sales of $249 million in its August quarter, 21 percent higher than a year earlier.
“Most of these cloud stocks are expected to maintain double-digit sales growth over the course of the next five years,” Tepper added. “Adobe is set to lead the way. They’re still the market leader in digital media.”
HI Financial Services Mid-Week 06-24-2014