
Next Monday is President’s day and the markets are closed. I would expect big money to be out by Wednesday
Earnings
BIDU 02/18 est
DG 03/12 est
F 02/10 AMC
MU 03/18 est
NVDA 02/25 AMC
O 02/24 est
WMT 02/19 BMO
https://www.briefing.com/the-big-picture
The Big Picture
Last Updated: 06-Feb-26 14:26 ET | Archive
Things were bad this week, but not for the broader market
Briefing.com Summary:
*Sharp declines in tech stocks masked a healthy market rotation, with most sectors, small caps, and equal-weighted indexes posting solid gains.
*Despite volatility and AI disruption fears, rising earnings estimates and broader participation signaled a bull market rotation, not a market retreat.
*The week highlighted growing investor willingness to look beyond former leaders as earnings trends and rate expectations stayed supportive.
The information technology sector fell as much as 5.2% this week; the consumer discretionary sector declined as much as 7.2%, and the communication services sector dropped as much as 5.4%.
NVIDIA (NVDA), Microsoft (MSFT), Alphabet (GOOG/GOOGL), Meta Platforms (META), Tesla (TSLA), and Amazon.com (AMZN) all lost ground this week.
Corporate layoffs hit their highest January level since 2009, and job openings in December (6.542 million) were nearly a million less than the same period a year ago, hitting their lowest level since 2020.
Bitcoin prices plunged as much as 25%.
And you know what? It was a really good week for the stock market.
A Rotation, Not a Retreat
Things felt bad this week, and there is no denying that things were bad for a number of stocks, namely the software stocks that got pummeled by AI disruption fears and many of the over-owned mega-cap stocks. To be sure, there wasn’t any unhedged owner of a passively managed S&P 500 Index fund that went unharmed.
Nevertheless, it was a good week, and here is why as of this writing:
- There were seven S&P 500 sectors that traded higher, and four—consumer staples, energy, industrials, and materials—gained at least 3.3%.
- The equal-weighted S&P 500 increased 1.8%.
- The S&P MidCap 400 Index surged 4.5%.
- The Russell 2000 advanced 1.9% (the S&P SmallCap 600 jumped 3.7%).
- The Russell 3000 Value Index gained 2.1%.
This week may have been accented by a retreat from many of the market’s former leaders, but it wasn’t a retreat from the stock market. It was a rotation within the stock market. That is bull market behavior, albeit with a keener eye for risk exposure.
Relatedly, there was some renewed appreciation for the idea that a weaker labor market is a risk to the U.S. growth outlook. That came to light with the Challenger layoff report, the JOLTS – Job Openings report, and a higher-than-expected increase in weekly initial jobless claims.
Those were nuggets of bad news, but where they became good news for the stock market is in the notion that they are data points that skew in favor of the Fed continuing to cut rates. Expectations for at least two more rate cuts before the end of the year firmed up in the fed funds futures market, and Treasury yields across the curve took a dip in response.
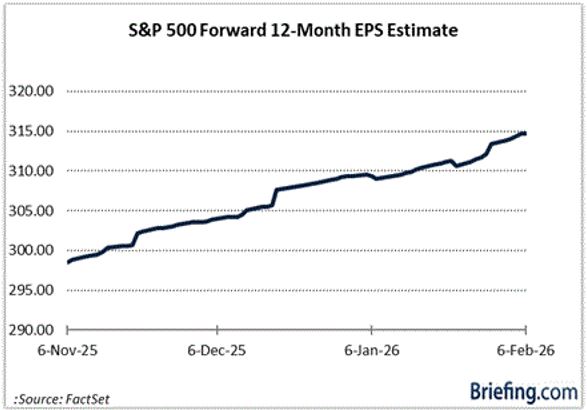
What didn’t take a dip this week were earnings estimates.
Some of the reactions to good earnings results and guidance might have been off-putting, but the estimate trend remained the market’s friend, as seen in the chart below. This is the stuff that buy-the-dip conviction is made of when interest rates remain well-behaved.
Sure enough, the load of a bad-feeling week was lightened on Friday with a robust rally that took shape without Amazon.com (AMZN), Alphabet (GOOG/GOOGL), and Meta Platforms (META) participating. And that was okay. It was a microcosm of a market that has learned in recent months to look beyond a handful of stocks to find good fortune elsewhere.
Briefing.com Analyst Insight
We don’t typically use this column to provide a weekly perspective, but it was necessary and relevant to the big picture. What transpired this week was a wake-up call for concentration risk and a warning shot with respect to the opportunities and disruption AI can create for U.S. businesses.
At the same time, it was a good week for the broader market, which took the shots of a flailing tech sector and remained standing, finding balance in rising earnings estimates, trickle-down optimism from massive AI investment plans, the ISM reports of expansion in the manufacturing and services sectors, and the tantalizing prospect of additional rate cuts.
It wasn’t all good, but in the big picture it was a good week for the broader market.
Market rotation: Investors are selling 21st century ‘innovators’ to buy 19th century businesses
Whether it’s truly better to be lucky than good, it’s undeniably best to be both whenever possible.
The S&P 500′s bumpy path to a 1.3% gain in the year’s first five weeks surely shows impressive resilience among risk-seeking capital staying engaged in the equity market — while also reflecting plenty of good fortune.
A bit lucky that the collective mini-panic over the downside of AI-driven disruption has struck in one of the seasonally strongest parts of the year with unusually massive net investor inflows, following three strong annual gains.
It’s likewise fortunate that the fiscal taps are wide open everywhere, supporting high nominal global growth, while in the U.S. last year’s tax revamp should goose real GDP by almost a percentage point.
And is it also a convenient break – for the markets, not for workers – that while most economic indicators have begun heating up, the labor market alone appears stalled, leaving the Federal Reserve more dovish than it otherwise would be given the overall pace of growth?
This entire blend of fitness and fortune has propelled an aggressive, high-velocity rotation within the market that has (so far) successfully broadened the leadership and awakened long-dormant sectors, while leaving the headline S&P 500 supported but stuck just under the 7000 threshold since late October.
The catchphrase of this rotation has been “out with the new, in with the old.” The year-to-date performance in the major indexes runs in chronological order of their invention: The Dow Jones Industrial Average up 4.3%, the S&P 500 up 1.3% and the Nasdaq Composite down 0.9%.
Investors are selling 21st century “innovators” to buy 19th century businesses. They’re rushing away from technology, where a company’s entire competitive advantage is lines of code that could fit on a thumb drive and embracing asset-heavy producers of scarce physical necessities.
Caterpillar over Microsoft
The Dow’s path to its first close above 50,000 on Friday illustrates this story nicely. The venerable but notoriously quirky price-weighted index has added 2,052 points so far this year.
Caterpillar, maker of enormous machines including the generators needed for AI data centers, has kicked in 985 points to the Dow by itself. That’s almost as many points as the declines in software stalwarts Microsoft (529) and Salesforce (472) have together cost the Dow this year.
Energy is the best S&P 500 sector in 2026, as John D. Rockefeller cheers from the beyond. Railroads as a group have jumped 13% in the past two weeks. The agricultural-products subsector of the S&P 500 basic-materials sector consists of Bunge Ltd. (founded in 1818) and Archer-Daniels-Midland (started in 1902 by two guys born in the 1850s), and it has gained 19.8% since Dec. 31.
This all comes off as quite wholesome and healthy and refreshing to the large group of investors who spent the past three years bemoaning the increasing concentration of market value in a small cluster of AI-chasing tech platform giants. And, all else being equal, it’s a plus to see the index fitfully rebalancing itself as money shifts toward a reflationary cyclical theme.
The concerns, such as they are, surround just how much growth and valuation support Old Economy sectors will be able to provide from here. A related but separate issue is the internal market extremes in positioning and volatility that are being generated by the mad stampede into and out of various sectors and investment factors (such as momentum, value, beta and earnings revisions).
Let’s observe, first, that large-cap value stocks do not look cheap. The forward price-to-earnings multiple of the S&P 500 Value ETF (IVE) is now above 19 for the first time in memory – possibly the first time ever outside of recessions where profits have collapsed.
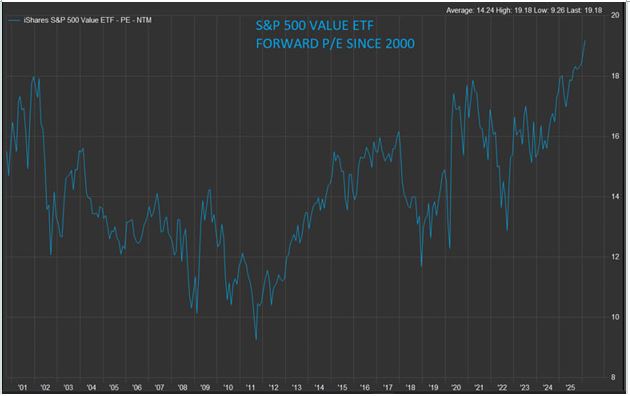
FactSet
Granted, valuation expansion is the market’s way of anticipating earnings acceleration, perhaps beyond what analysts have forecast. So as long as the earnings continue to outpace estimates there may not be much payback in the near term. But if nothing else it means value-over-growth is hardly an undiscovered opportunity.
Zooming in a bit closer, as of about two weeks ago, the S&P industrials sector now carries a higher valuation than technology, something that has only happened a few times for brief periods in recent decades.

FactSet
Again, this is the market’s way of migrating from sectors with too much capacity facing a glut (software creation can become cheap and infinite with AI) to those with multi-year production constraints (gas turbines, jet engines, electrical gear).
Deutsche Bank strategists on Friday flagged the headlong stampede of investor cash into non-tech sector funds to capture this long-promised, now-underway rotation: “Sector funds excluding tech have seen a record $62 billion in inflows in the first five weeks of the year. To put that in context, that’s more than they saw in all of 2025 (just over $50bn). Relative to the normal pace historically, the inflows year to date are running almost 4 standard deviations above average.”
Meantime, outflows both from both software and crypto (an asset class most correlated with unprofitable tech stocks) grew excessive until the savage software/bitcoin selloff hit an extreme Thursday, when money came sloshing in to catch the falling knives.
Software washout
Software was uniquely vulnerable to any perceived threat from AI given the entrenched assumptions of the sector’s investor base. Software-as-a-service was built to Wall Street specifications as a subscription business embedded in crucial business and consumer processes whose annual recurring revenue streams would stretch decades into the future.
Oh, and if SAAS firms falter a bit, they were seen as ideally suited to be taken private by buyout firms who love those long-lived cash-flow streams to service debt. Now private-capital stocks have been smashed due to software exposure (right or wrong it surely reduces the “LBO bid” cushion).
Many of the big software platforms – Salesforce, now under a 15 P/E or ServiceNow, with a record-high 5% free-cash-flow yield – have a decent counter-argument to the bears.
But as Goldman Sachs head of hedge-fund coverage Tony Pasquariello notes in a weekend market dispatch, “The question is whether this cohort can convince investors that it’s not as fundamentally challenged as the recent de-rating would suggest it is… Once the market makes its mind up that something has structurally changed, it becomes increasingly hard to fight the tape and break that perception (witness legacy media or brick-and-mortar retail).”
The setup involving massively oversold parts of tech, a buying panic in some non-tech areas (Walmart has raced to a 43x forward P/E) gets to the extremes that have been developing across asset markets. These include never-before-seen outperformance of semiconductors over software, the U.S. dollar near a four-year low and multi-decade highs in silver-over-gold prices.
Over the ten days preceding Friday’s bounce, Barclays tactical equity strategy desk says the internal whipsaw action of the market – measured as the realized volatility among major investment factors – reached an extreme only seen near last year’s Liberation Day panic, the peak of the 2022 rate-hike/recession scare and during the Covid crash.
And yet the S&P 500 itself suffered less than a 3% pullback and the CBOE S&P 500 Volatility Index (VIX) made only a brief pop toward 23 before receding late in the week.
“The point being,” Barclays said, “that the market effectively ‘crashed’ without the typically symptomatic correlation one drawdown.”
Sounds like a lucky break.
Can investors stay lucky?
Assuming the urgent momentum-reversal action of last week is through, that is. Whenever these urgent hedge-fund risk-reduction events occurs, brokerage houses try to handicap how much more repositioning might be necessary to bring their posture back toward a neutral footing, like different hurricane models trying to forecast a storm’s path.
Last year, a similar episode triggered by the potential DeepSeek threat to U.S. AI companies sent the iShares Momentum ETF collapsing relative to the S&P 500 Low-Volatility basket. This drop was quickly recovered within a week, went on to further new highs, before in mid-February another momentum positioning shock struck.

FactSet
This is all to provide some context around any confident predictions that current rotational trends can proceed harmlessly from here. February need not be a tough month, but notable tactical peaks in the high-momentum parts of the market occurred after strong preceding years in 2018, 2020, 2021 and 2024.
The S&P 500 has been thwarted on any attempts to surmount those late-October highs, and the Vanguard Total Stock Market Fund is flat the past two months, when seasonal factors have been supportive and earnings continuing to rise.
Still, those earnings gains mean the broad market’s valuation has ebbed since October. The rest of the world is a big help, too: FactSet says that in the fourth quarter, S&P 500 companies with more than half their revenue coming from overseas have posted an average of 17.7% growth, compared to 10% for firms with more than 50% domestic sales.
It’s tough for the economy to get into too much trouble with a capital-spending boom raging, record corporate margins and a Federal deficit running near 6% of GDP. So far, too, Treasury yields are tame and public corporate debt spreads unperturbed.
Plenty of good things going on, for sure, but worth asking how many have been priced in and how long the market can keep avoiding unlucky breaks.
Where will our markets end this week?
Higher
DJIA – Bullish
SPX – Bullish
COMP – Bullish
Where Will the SPX end Feb 2026?
02-09-2026 +1.5%
02-02-2026 +1.5%
Earnings:
Mon: CLF, GT
Tues: KO, DUK, DD, HOG, SPOT, LYFT, MAT, F
Wed: CVS, HLT, KHC, MCD, NTES, TMUS, CSCO, HUBS,
Thur: CROX, H, ABNB, DKNG, ROKU, TWLO, WYNN
Fri: WEN
Econ Reports:
Mon:
Tue Employment Cost Index, Retail Sales, Retail ex-auto, Factory orders,
Wed: MBA, Treasury Budget, Average Workweek, Non-Farm Payrolls, Private Payrolls, Unemployment Rate, Hourly Earnings,
Thur: Initial Claims, Continuing Claims, Existing Home Sales
Fri: CPI, Core CPI
How am I looking to trade?
Protected for earnings
www.myhurleyinvestment.com = Blogsite
info@hurleyinvestments.com = Email
Questions???
Will Palantir (PLTR) Stock Hit $200 in 2026?
David Moadel
Wed, February 4, 2026 at 6:48 AM MST 5 min read
- Palantir (PLTR) reported Q4 revenue of $4.475B up 56% year over year. U.S. commercial revenue surged 109%.
- Palantir guides 2026 revenue growth to 61%. This requires accelerating from Q4’s 56% growth rate.
- Palantir posted Q4 earnings of $0.25 per share beating consensus estimates of $0.23.
- Investors rethink ‘hands off’ investing and decide to start making real money
Is the market for artificial intelligence (AI) services past its expiration date? The jury is still out on that topic, but recently reported results from Palantir Technologies (NASDAQ:PLTR) suggest that the AI frenzy is far from over.
Lately, PLTR stock has been considered one of the best AI stocks to own now. On the other hand, as we’ll discuss in a moment, the stock’s price action during the past six months has been frustrating and confusing.
Yet, the bears and pessimists got a major wake-up call on Tuesday when Palantir stock shot higher. This occurred even though the NASDAQ 100 technology stock index was deep in the red. Clearly, something unusual is going on — and just maybe, Palantir stock is destined to break through $200 before the year is finished.
The Start of a Revival?
Although PLTR stock is up by 85% over the past 12 months, don’t get the wrong idea. The stock has spent the past half-year in an aimless range-bound pattern, much to the chagrin of some Palantir investors.
Something occurred on Tuesday that could jump-start a revival in PLTR stock, though. Bear in mind that $200 isn’t out of the question for 2026 since the stock already hit that level in 2025.
Also, as I alluded to earlier, Palantir stock was in rally mode on a day when NASDAQ 100 were sinking fast. That’s a great sign for Palantir and its shareholders since it indicates practically unstoppable momentum and resilience.
There is a serious concern, though. If PLTR is up substantially over the past year, are there valuation-related red flags with Palantir?
Traditional valuation metrics would suggest that the answer is yes. For one thing, Palantir has a trailing 12-month (TTM) price-to-earnings (P/E) ratio of 197.01x, which is a whopping 721.19% above the sector average.
We’re getting into some dangerous valuation territory here, it would seem. In addition, Palantir has a trailing 12-month (TTM) price-to-sales (P/S) ratio of 88.63x, which is a mind-blowing 2,435.15% above the sector average.
Yes, It Was a “Blowout” Quarter
The debate surrounding Palantir’s lofty valuation was front and center on Tuesday, and the key phrase for the bulls was “blowout quarter.” This phrase referred to Palantir Technologies’ highly impressive results from the company’s fourth-quarter 2025 financial report.
In the quarterly press release, Palantir CEO Alex Carp declared that his company is “alone” in focusing exclusively on “scaling the operational leverage made possible by the rapid advancements of AI models.” It’s a bold statement and, possibly, an attempt to position Palantir Technologies as a trailblazer in AI technology advancement.
Still, Karp’s boasting is supported by Palantir’s “blowout” Q4 2025 results. It was a quarter in which Palantir closed 180 deals of at least $1 million and raked in $4.475 billion worth of revenue, up 56% year over year.
Of particular note was Palantir’s U.S. commercial revenue, which grew 109% to $1.465 billion. It’s also eye-opening, though, that the company’s U.S. government revenue increased 55% to $1.855 billion.
Turning to the bottom-line results, Palantir reported earnings of $0.25 per share, well above $0.14 per share in the year-earlier period. Moreover, this result beat Wall Street’s consensus estimate of $0.23 per share. So yes, the quarter was a “blowout” by any reasonable standard.
A Tough Act to Follow
Looking at the current year, Karp announced a “2026 revenue growth guide of 61% year-over-year.” Is this a realistic objective, though?
To reiterate, Palantir’s Q4 2025 revenue grew 56% year over year. Sure, the company’s U.S. commercial revenue surged 109%, but that’s just part of the overall picture.
In other words, it won’t be sufficient for Palantir Technologies to maintain the total revenue growth momentum from Q4 2025. To achieve Karp’s goal, the company would have to raise the average revenue growth rate to 61% in 2026.
This would just be a continuation of strong revenues; it would require “growth of growth,” or an acceleration of Palantir’s already high revenue growth rate. It’s a tall order, to say the least, but evidently the market likes to hear Karp’s optimistic projections.
For the time being, it’s plausible that Palantir’s recent financial results can justify the company’s high valuation. Plus, Tuesday’s share price action showed that sentiment is riding high for PLTR stock.
Therefore, it’s entirely possible for Palantir stock to break out of its long-standing trading range and bust through the key $200 level this year. Nevertheless, any positing sizing ought to be small as it will difficult — albeit not impossible — for Palantir Technologies to meet Karp’s stated goal for 2026 revenue growth.
It’s Time To Rethink Passive Investing
For more than a decade, the investing advice aimed at everyday Americans followed a familiar script: automate everything, keep costs low, and don’t touch a thing. And increasingly, investors are realizing that being completely hands-off also means being completely disengaged.
That realization hits like a lightning bolt when you realize not just how much better your returns could be, but that there are amazing offers like one app where new self-directed investing accounts funded with as little as $50 can receive stock worth up to $1,000.