HI Financial Services Mid-Week 03-17-2015
We had a booming stock market in 1929 and then went into the world’s greatest depression. We have a booming stock market in 1999. Will the bubble somehow burst, and then we enter depression? Well, some things are not different. – Jeffrey Sachs
What have we done to ward off a “great depression” – Made a lot (Printed) of money at low interest to be made available?
Dropped interest rates
Printed more money than ever – 4.1 T in the Fed balance sheet right now
Congress or Government is in debt 19T with a deficit this year again !!!!!
What’s happening this week and why?
Poor Economic data:
Empire 6.9 vs est 8.8
Industrial Production .1 vs est .3
Cap Utilization 78.9 vs est 79.5
NAHB housing Index 53 vs est 56
Housing Starts 897 vs est 1040
Good news Building permits 1092 vs est 1070
Is it the weather? YES
It has been unusually warm in the west !!!
Coldest Feb on record and most snow fall for the east
Volatility 9 days in March out of 12 that had 100 point closing movements or more 4 Bullish 5 bearish
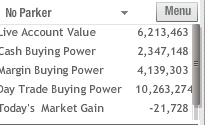
on a triple digit down day I was off – 0.003%
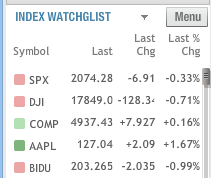
Where will our market end this week?
????? 100% dependent on Yellen’s Statement / Q&A
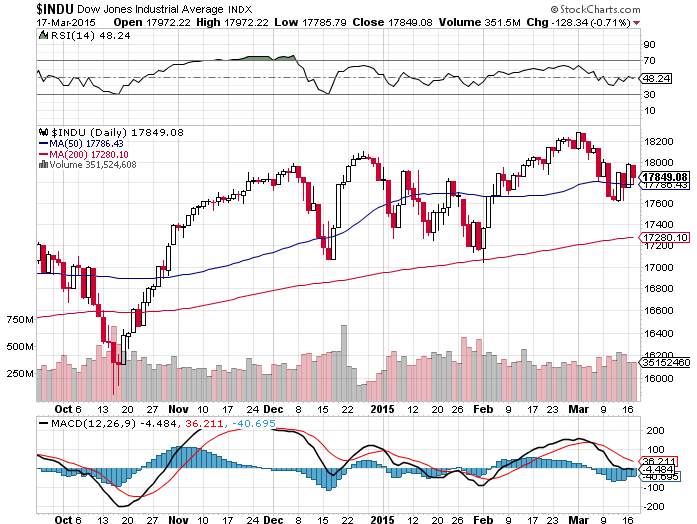
DJIA – Bearish but look to be making a turn
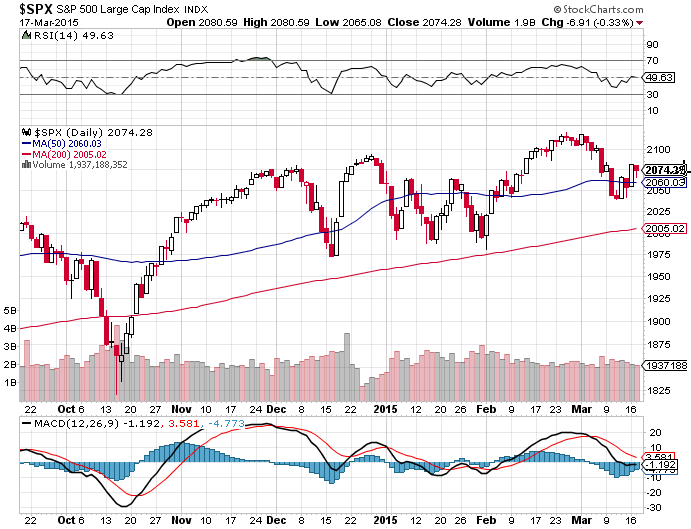
SPX – Bearish
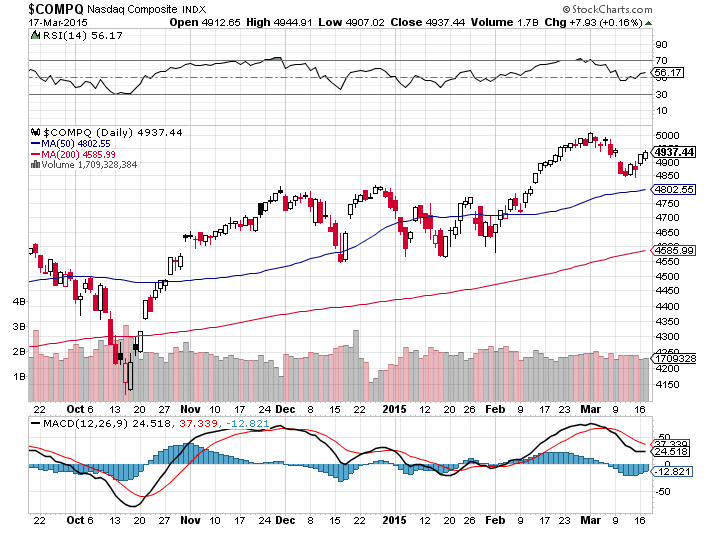
COMP – Looking to turn bullish with two bullish indicators
Where Will the SPX end March 2015?
03-10-2015 March will finish flat with a 3.5% move down and back up
03-10-2015 March will finish flat with a 3.5% move down and back up
03-03-2015 March will finish flat with a 3.5% move down and back up
02-25-2015 March will finish flat with a 3.5% move down and back up
What is on tap for the rest of the week?=
Earnings:
Tues: ADBE, BURL, CTRP, DRCL, SKYS, ORCL
Wed: CTAS, FDX, GIS, RENN
Thur: NKE, LEN
Fri: DRI, KBH, TIF
Econ Reports:
Tues: Housing Starts, Building Permits
Wed: MBA, Crude, FOMC Rate Decision
Thur: Initial Claims, Continuing Claims, Current Account Balance, Phil Fed, Leading Indicators
Fri: Options Expiration – Will people need to cover short positions
Int’l:
Tues – JP: Merchandise Trade
Wed – JP: All Industry Index, GB: BOE Minutes, Labour MKT Report
Thurs – JP: BOJ Minutes
Friday –
Sunday –
How I am looking to trade? Let me Show you what I changed and why?
Most of my stocks are thru earnings:
I have some stock only positions – DIS, NVDA, F, SBUX, D,
I have Protective puts on LNCO, ZION, AAPL
Still IN collars for – BIDU, FB,
Covered Calls on – VZ, WBA, SNDK, P
Bull Puts – DIS, NVDA
Bear Puts – LNCO
Naked Puts –V ( 8 naked at 272.50 Mar 15)
BABA I have 80 % of the share covered (400) with long puts and all shares covered with a bear put spread 80/70
AAPL Bear put calendar with long puts
1st I am creating my earnings list so I don’t miss an earnings for a company I trade
WBA – 03/24
PCLN – 02/19
NKE – 3/19
RHT – 3/26
MU- 4/2
Questions???
Collar trade BUT I use earnings as the catalyst – Being in cash is probably a good thing right now !!
Buying opportunity knowing past performance NEVER guarantees future performance
Jan 2014 6.5%, April 4%, July/Aug 4%, October 7%, Dec 5%
ANYTHING you make on the way down is a profit in collar trading as the stocks come back
What is Protection and what is NOT protection

My stock lost $2.03
My covered call only lost $0.625 and covered calls are NOT PROTECTION
Why? Stock trading at $203 with a credit left of $8.29 = $195 ish at RISK
My long puts made up another $0.925
Net loss today because I was collared = 2.03 – 0.925 – .0625 = $0.48

www.myhurleyinvestment.com = Blogsite
customerservice@hurleyinvestments.com = Email
Article Links can be followed by being a Twitter follower @kevinmhurley


