HI Financial Services Mid-Week 02-24-2015
The reality is that business and investment spending are the true leading indicators of the economy and the stock market. If you want to know where the stock market is headed, forget about consumer spending and retail sales figures. Look to business spending, price inflation, interest rates, and productivity gains. – Mark Skousen
ECONOMIC
Last Update: 05-Feb-15 09:18 ET
Productivity-Prel
Highlights
- Nonfarm labor productivity declined 1.8% in the fourth quarter after increasing an upwardly revised 3.7% (from 2.3%) in Q3 2014. The Briefing.com Consensus expected nonfarm labor productivity to increase 0.2%.
Key Factors
- The decline in productivity was a result of labor hours increasing at a faster rate than output. Output in the fourth quarter increased 3.2% after increasing 6.3% in the third quarter. Meanwhile, hours increased 5.1%, which was the largest increase since Q4 1998, after increasing 2.5% in the previous two quarters.
- Hours growth is likely to decelerate considerably next quarter, which could mean softer monthly payroll gains in 2015.
- Unit labor costs increased 2.7% in the fourth quarter after declining in both the second and third quarters. The increase in unit costs was a result of a 0.9% increase in hourly compensation coupled with the lower output gain.
Big Picture
- Productivity gains help keep cost-push inflation pressures from rising wages in check. Over the long term, it is productivity gains that provide the increase in output that have led to the consistent gains in living standards in free market economies.
| Category | Q4 | Q3 | Q2 | Q1 | Q4 |
| Nonfarm Business Sector | |||||
| Productivity Q/Q | -1.8% | 3.7% | 2.9% | -4.5% | 3.3% |
| Unit Labor Costs Q/Q | 2.7% | -2.3% | -3.7% | 11.6% | -1.3% |
| Productivity Y/Y | 0.0% | 1.3% | 1.3% | 0.7% | 2.0% |
| Unit Labor Costs Y/Y | 1.9% | 0.9% | 0.7% | 2.5% | -2.1% |
Read more: http://briefing.com/Investor/Calendars/Economic/Releases/prod.htm#ixzz3Si8guyK2
Just some comments: Bullish market over the last this year, especially over the last three weeks, and pretty easy to trade with ….COLLARS
Let’s go over anything you want to today?
I protected for earnings two to three weeks earlier than I normally would. I was also taking profits from the collars and restructuring a week before earnings.
What is the unlimited risk of naked puts or calls.
Naked calls have UNLIMITED RISK AND you NEVER EVER EVER NEVER EVER trade them!!!! Why? You are obligated to sell the stock at maybe $81 a share and the stock overnight could go to $250. SO you buy at $250 to sell at $81
Naked Puts the risk is buying the stock and having it go to ZERO = Defined risk and If I can cover the obligation of the short put it is OK to trade
Stocks I’m looking at buy or buying more: AAPL, V, P, LNCO, SNDK, BABA, BIDU,
Got called out of MS, WBA, MU, and would/can get in a lower prices today
I would like to move some out of tech (AAPL, BIDU, BABA) and move to oil and financials
You are taking too much risk right now, Kevin? Risk tolerance is different for each and every person. I’m only 66% vested at this time and have money to put to work in a bullish market.
Defined risk of $50 is too much. DON’T wait until the stock loses $50. Collar it up if and when you get scared
Would I buy any oil stocks? YES I’m in LNCO or LINE, CVX, WOM, COP,
Is high risk taking not like poor risk management? Depends, I’m playing with the houses money year to date, big blue chip stocks AAPL. BIDU, DIS, V, F, trend is my friend, beat on earnings, have stock ownership in case I am wrong and have to wait “forever” for it to come back, not overleveraged where if one went out of business that I would lose more than 20% for the portfolio,
What’s happening this week and why?
Existing Home sales 4.82M vs estimated 4.95M
Case-Shiller 4.5 vs est 4.3
Consumer Confidence 96.4 vs est 99.3
Yellen gave a very dovish testimony today
Where will our market end this week?
Up higher based on GDP on Friday and Yellen Comments today
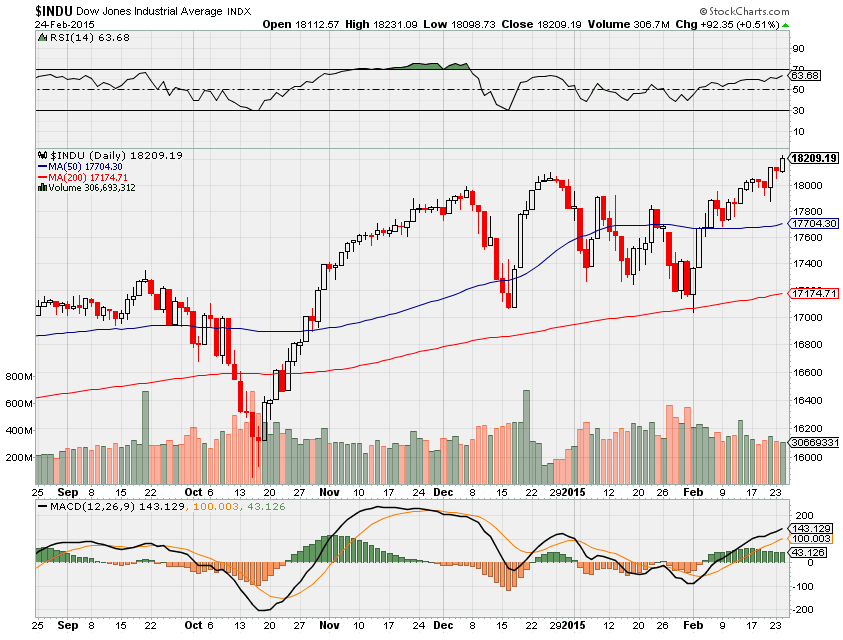
DJIA – Bullish

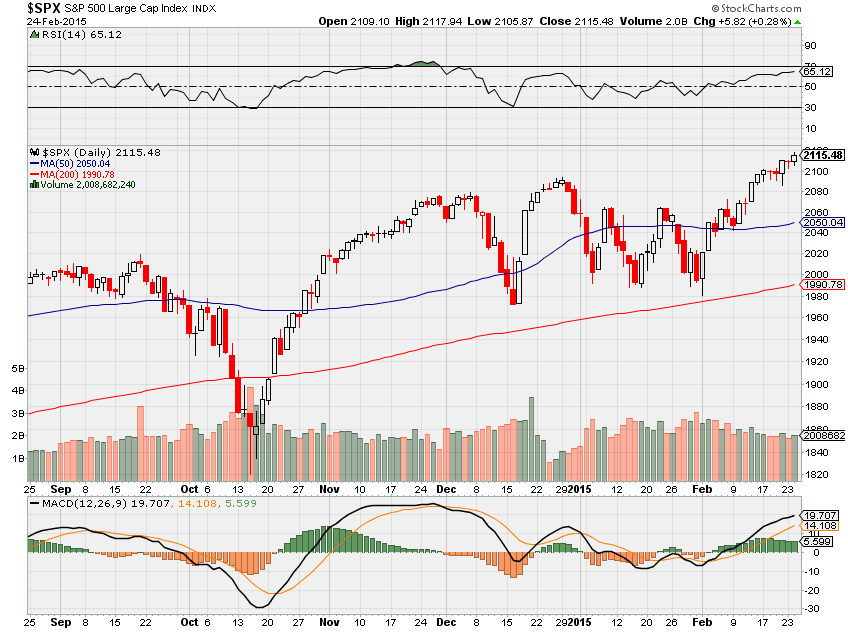
SPX – Bullish

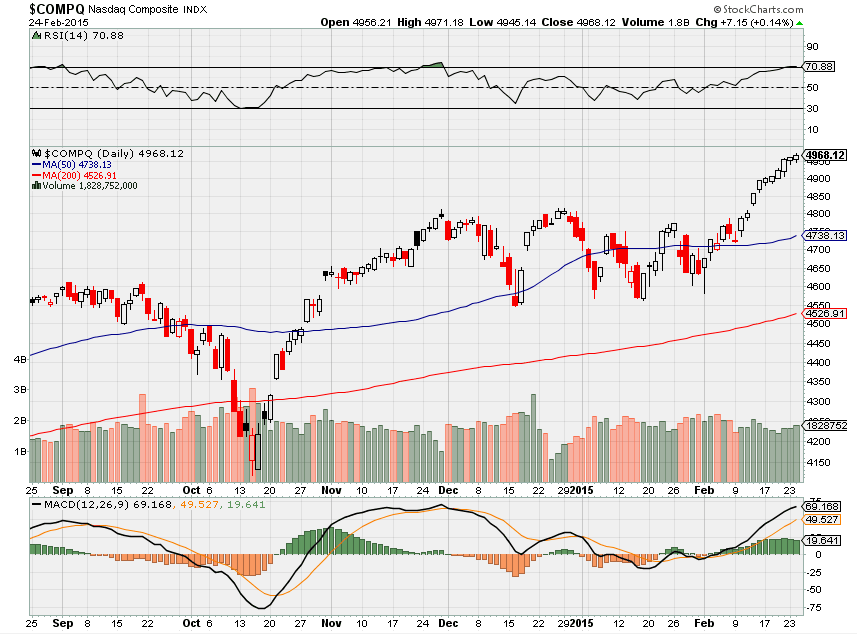
COMP – Bullish

Where Will the SPX end March 2015?
02-25-2015 March will finish flat with a 3.5% move down and back up
02-17-2015 Feb will finish at new market highs
02-10-2015 Feb will finish at new market highs
02-03-2015 Feb will finish at new market highs
What is on tap for the rest of the week?=
Earnings:
Tues: BGFY, CLDX, DPZ, ECL, FSLR, HPQ, HD, M, ODP, TOL
Wed: CPB, CHK, DLTR, LB, LOW, SODA, TGT, RIG, WEN
Thur: DDD, CHS, CROC, GPS, HLF, KSS, ROST, SWX
Fri: ISIS, KBR, VLCCF
Econ Reports:
Tues: Case Shiller, Consumer Confidence,
Wed: MBA, Crude, New Home sales
Thur: Initial Claims, CPI, Core CPI, Durable Goods, Durable ex-trans, FHFA Housing Price Index
Fri: GDP, GDP Deflator, Chicago PMI, Michigan Sentiment, Pending Homes Sales
Int’l:
Tues – DE: GDP, FR: Business Climate, EMU:HICP, CN: PMI Flash Manufacturing Index
Wed –
Thurs – EMU: EC Economic Sentiment
Friday – GB: GDP
Sunday – CN: CFLP Manufacturing PMI, PMI Manu Index JP: PMI Manu Index
How I am looking to trade?
Most of my stocks are thru earnings:
I have some stock only positions – DIS, AAPL, F, MS, SBUX, D, SNDK, P
I have Protective puts on LNCO, ZION, NVDA
Still IN collars for – BABA, BIDU, FB,
Covered Calls on – VZ, WBA, BAC, C,
Bull Puts – AAPL, DIS, NVDA
Bear Puts – LNCO
Naked Puts – AAPL, V
1st I am creating my earnings list so I don’t miss an earnings for a company I trade
WBA – 03/24
PCLN – 02/19
NKE – 3/19
RHT – 3/26
MU- 4/2
Questions???
www.myhurleyinvestment.com = Blogsite
customerservice@hurleyinvestments.com = Email
Article Links can be followed by being a Twitter follower @kevinmhurley
