
HI Market View Commentary 09-30-2024
Tell me about Social Security in regards to when you should take it?
“At the age that is recommended on the piece of paper they send you.” NEVER
“Take Social Security Late (until 70) for the max amount.”
You can start to take your benefits at age 62 through 70
62 – $1464, 67 – $1768, 70 – $2144
2035 no more payments can come from the trust fund as it will be at ZERO
Waiting 8 years = $1,464 * 12 Months * 8 years = $140,544 that you have to make up
140,544 / 680 = 206.6 months to make that up
You have to live 17.2 years past 70 to break even for taking the money later
Is the Bullish market run over for 2024? Probably not over
We are just waiting for certainty = Election, More rate cuts
This is why the Buffett style of investing is so important = Do the work to find the winners, and protect when the market doesn’t realize it
Earnings dates:
AAPL 10/31 AMC
BA 10/23 est
BABA 11/21 BMO
BAC 10/15 BMO
BIDU 11/26 est
DG 12/05 est
DIS 11/06 est
F 10/28 AMC
GM 10/22 BMO
GOOGL 10/22 AMC
JCI 11/06 AMC
JPM 10/11 AMC
KO 10/23 BMO
LMT 10/22 BMO
META 10/30 AMC
MU 12/28 est
O 11/04 AMC
SQ 11/07 AMC
TGT 11/20 BMO
UAA 11/11 est
V 10/22 AMC
VZ 10/22 BMO
ZION 10/21 AMC
https://www.briefing.com/the-big-picture
The Big Picture
Last Updated: 20-Sep-24 15:31 ET | Archive
Market needs companies to earn their keep
The S&P 500 hit a new record high, energized by the Fed’s aggressive move to cut the target range for the fed funds rate by 50 basis points to 4.75-5.00%. There were cogent arguments that the Fed needed to be aggressive because the policy rate is still too high relative to the inflation rate.
The inference is that the Fed risks inviting tough economic times by keeping real rates too high for too long.
There were also arguments that suggested the Fed should not cut rates — or certainly not by 50 basis points with the first move — since the PCE inflation rate of 2.5% is still above the Fed’s 2.0% target, weekly initial jobless claims are nowhere near recession levels, and stock prices are at record highs.
The inference is that the Fed could reignite inflation by easing policy too much, too soon.
We aren’t here to litigate either case today. The market will do that on its own, but early returns suggest the market has literally bought into the argument that the Fed needs to be aggressive, and pro-active, to ensure the labor market doesn’t weaken further and jeopardize the soft-landing outcome.
That buy-in has driven multiple expansion, which is to say stock prices have gone up at a faster pace than earnings estimates. That isn’t an offside reaction with market rates falling and the Fed itself projecting another 150 basis points worth of easing between now and the end of 2025.
The key to it all, however, is that earnings estimates stay onside.
A Welcome Sight
So far, analysts continue to model generally good things for the earnings outlook.
The forward 12-month estimate is $266.63, up from $259.79 at the end of June, according to FactSet. Calendar-year 2025 earnings, meanwhile, are projected to be $276.84. That is 15.1% higher than the calendar-year 2024 estimate of $240.55. The calendar-year 2026 estimate sits at $311.38, up 12.5% from the current calendar-year 2025 estimate.
Double-digit earnings growth is always a welcome sight, but it is admittedly difficult to be “farsighted” into 2026 right now knowing the 2017 tax cuts expire at the end of 2025, leaving tax policy up in the air in front of the November election.
Corporate tax rates, individual tax rates, and capital gains tax rates are all subject to change based on the election outcome, and any changes will change the calculus for 2026 estimates.
For now, the 2026 estimate is a nice placeholder.
Multiple Expansion
The prevailing estimate in the market is the forward 12-month EPS estimate, which has been losing pace in recent weeks. Since the low on September 6, the S&P 500 has increased 5.6% while the forward 12-month EPS estimate has risen 1.5%.
It is encouraging to see the EPS estimate still rising, but the corresponding earnings multiple is as well. In the same period, the forward 12-month P/E ratio has gone from 20.4 to 21.5. The latter is a 34% premium to the 20-year average and a 19% premium to the 10-year average, according to FactSet.
As discussed in last week’s column, that is a rich P/E multiple for the market-cap weighted S&P 500 but, to be fair, the price-to-earnings growth ratio of 1.43 (P/E divided by earnings growth rate) is a modest discount to the 10-year average of 1.49.
What It All Means
Earnings growth is a very important denominator, and why the earnings estimate trend will be a market driver. In turn, that is why economic growth is held dear by the market because earnings prospects ride on economic growth prospects.
Hence, the market has been cheered by the Fed taking an aggressive line with its rate cut, seeing it as a down payment on the house call that the economy will not suffer a hard landing.
Nobody wants that, because the harder the economy falls, the harder earnings estimates fall, and richly valued stocks follow suit.
The market has made great strides on its charge to record territory, but companies need to earn their keep if the market is going to keep on keeping on at rich valuations that are easier to discount when earnings growth estimates are rising.
—Patrick J. O’Hare, Briefing.com
(Editor’s Note: the next installment of The Big Picture will be published the week of September 30)
Where will our markets end this week?
Higher
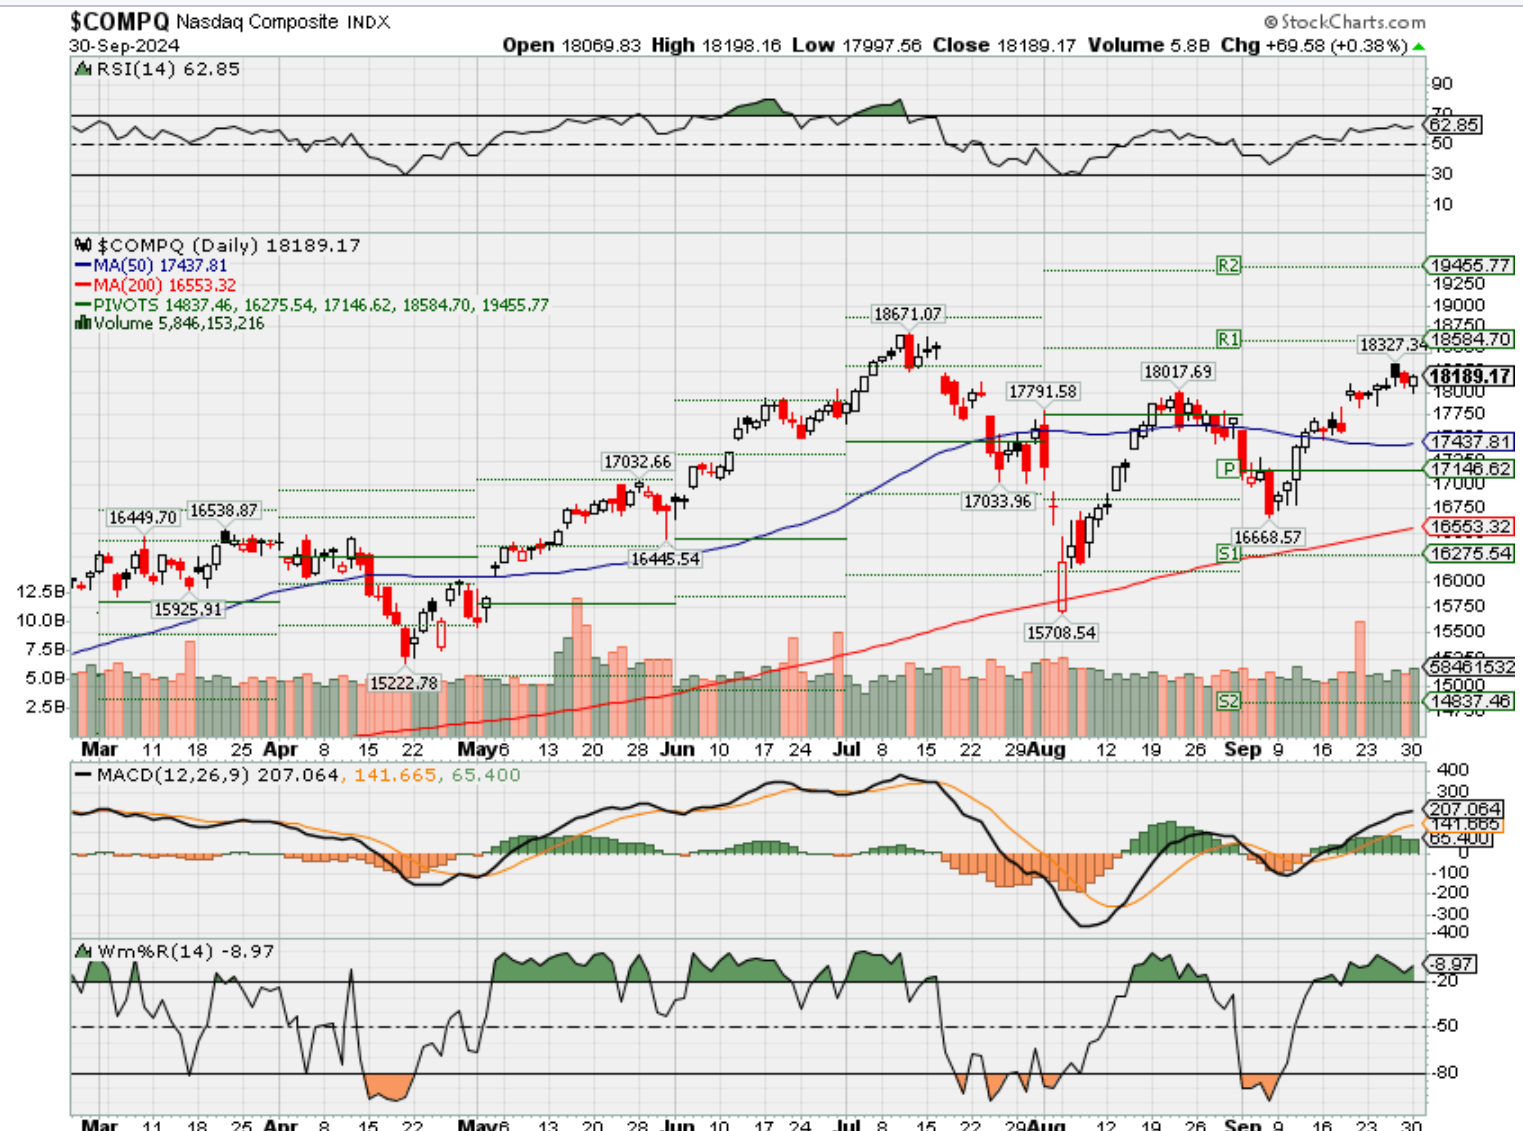
DJIA – Bullish
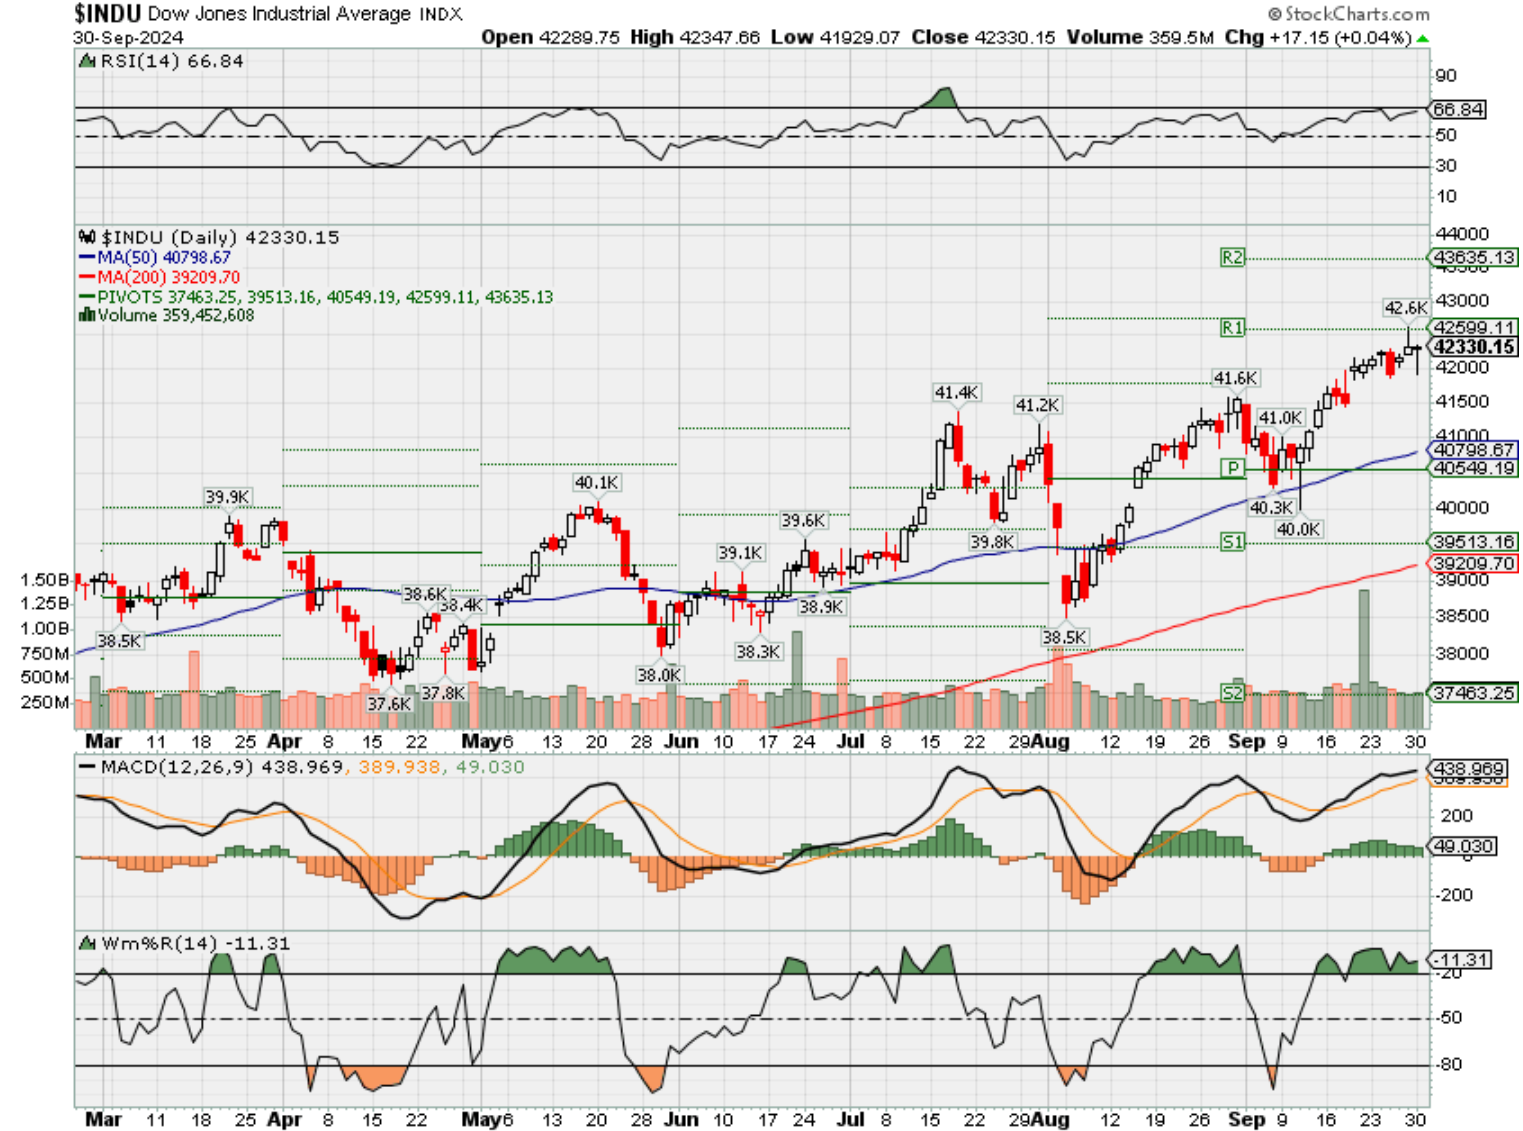
SPX – Bullish
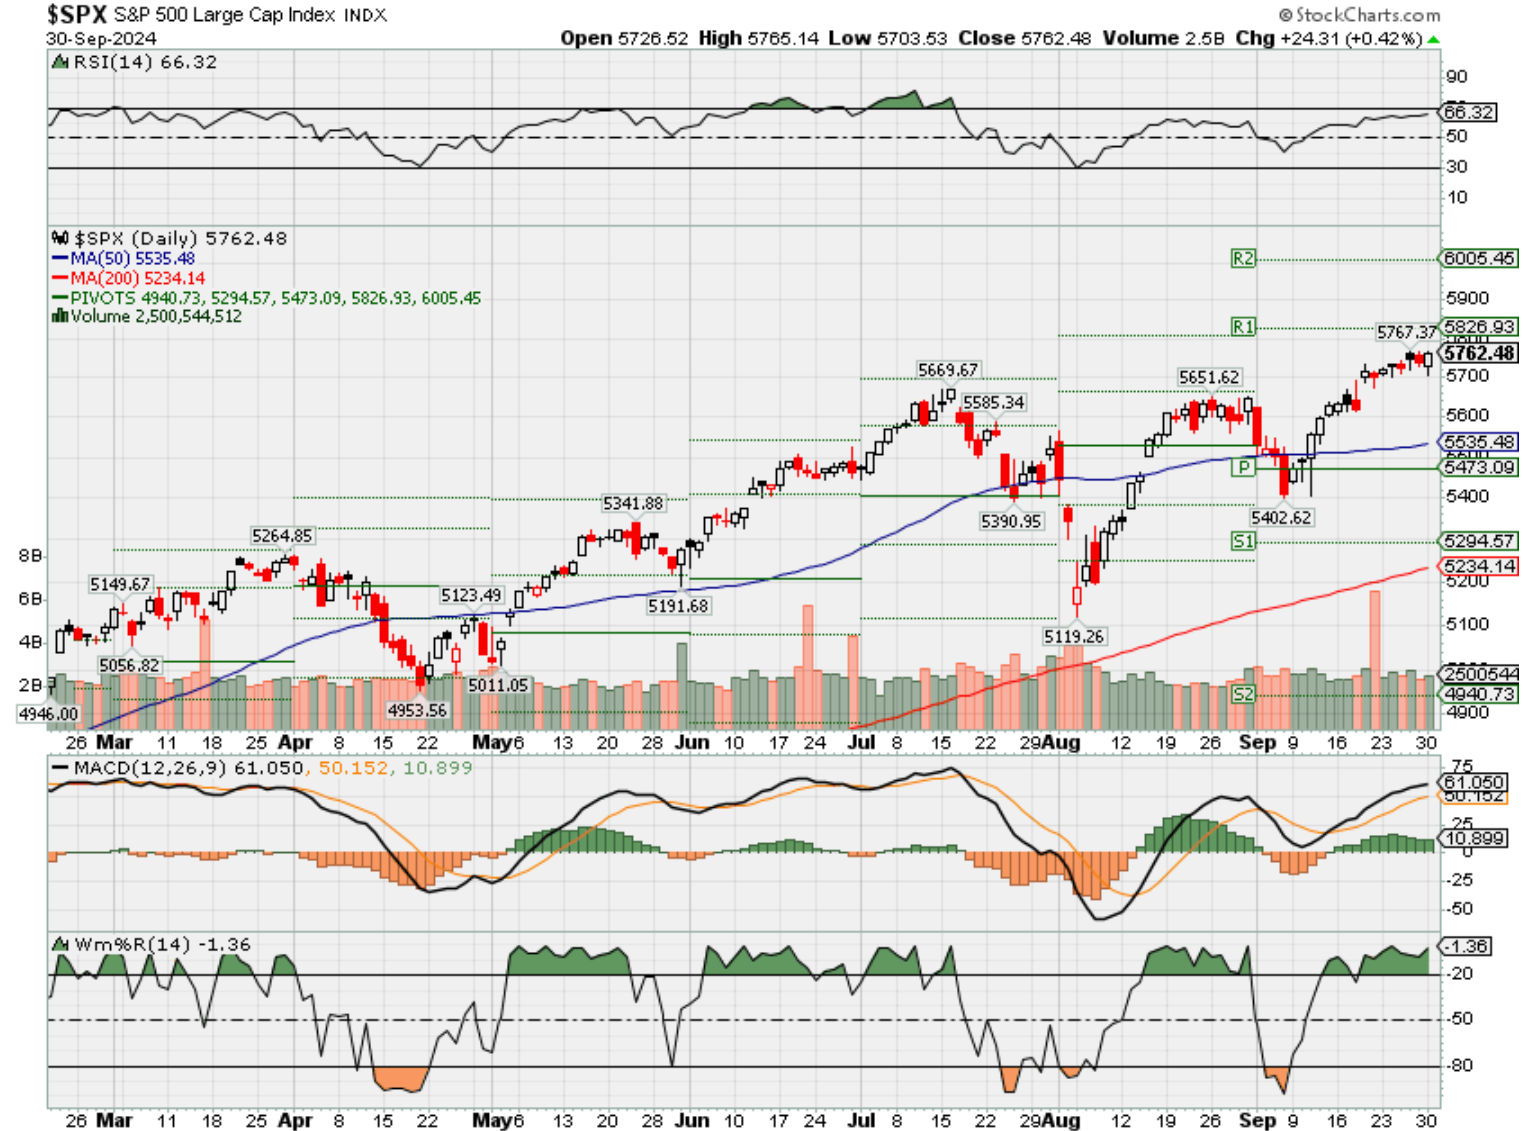
COMP – Bullish NEW support level @ 17, 496-17,480
Where Will the SPX end October 2024?
09-30-2024 -2.50%
09-23-2024 -2.50%
Earnings:
Mon:
Tues: NKE
Wed: LEVI, CAG
Thur: STZ
Fri:
Econ Reports:
Mon: Chicago PMI,
Tue Construction Spending, ISM Manufacturing
Wed: MBA, ADP Employment,
Thur: Initial Claims, Continuing Claims, Factory Orders, ISM Services,
Fri: Average Workweek, Non-Farm Payroll, Private Payroll, Hourly Earnings, Unemployment Rate
How am I looking to trade?
www.myhurleyinvestment.com = Blogsite
info@hurleyinvestments.com = Email
Questions???
https://www.ksl.com/article/51143324/when-is-the-best-age-to-file-for-social-security
When is the best age to file for Social Security?
By B.O.S.S. Retirement Solutions and Advisors | Posted – Sept. 29, 2024 at 11:30 a.m.
This story is sponsored by B.O.S.S. Retirement Solutions.
It’s more important than ever to make the right decision about when to file for Social Security.
You only get one shot to get it right. And once you file, you’re locked in – you can’t change your mind later. And your filing decision has recently become even more complicated. Especially if you hope to collect Social Security through 2035 and beyond.
Experts Tyson Thacker and Ryan Thacker from B.O.S.S. Retirement Solutions recently explained what’s changed with filing for Social Security as well as how Utah residents could get the most income when they file for Social Security today.
Tyson Thacker and Ryan Thacker are the CEO and president of B.O.S.S. Retirement Solutions, with six offices located throughout the Wasatch Front. They are published authors of the book, “The B.O.S.S. Retirement Blueprint” and they’ve helped thousands of area families get the most out of their Social Security benefits.
What’s the big change with Social Security?
“We’re rapidly approaching the edge of the cliff,” explains Tyson Thacker. “The Social Security Trust Fund recently confirmed it’s projected to run out of money in less than 10 years.”
If you’re retiring today, your retirement could last for 20- or 30-plus years. That means Social Security could be reduced in the middle of your retirement. And you could be looking at a 17% or bigger cut in your monthly income.
“This could be devastating,” adds Ryan Thacker. “Especially for retirees living on a fixed income and relying on Social Security to pay for their retirement expenses. This is a big part of why we’re telling our clients there’s an old way and a new way to file for benefits. It’s like the rules have completely changed.”
Filing for your benefits is complicated
Filing for your benefits was already complicated enough. A lot more complicated than most people realize.
According to a Forbes article, there are 2,728 rules in the Social Security handbook. And there are thousands of rules about those rules. Even worse, these rules are written in geek-speak – a language nobody can understand.
That makes your decision about the best age to file complicated enough. But if you’re filing today, you now have to consider the potential reduction in benefits. If benefits could get cut in less than 10 years, how could that impact your best age to file?
“Too many people are flying blind when it comes to making this critical decision,” says Tyson Thacker. “If you want to know your best age to file, you might want help. It could pay off big to reach out to a professional who understands the situation, and can consider your total picture.”
There’s a lot of money at stake
Filing for Social Security could be one of the most important financial decisions of your life.
If you made an average income, your benefits could add up to several hundred thousand dollars in lifetime income. And if you made an above-average income, they could be worth more than $1 million.
Depending on when you file, it could easily make a six-figure difference in your lifetime income. And that’s why this decision can’t be taken lightly.
“Research has shown that 96% of Americans miss out on an average of $111,000 in total benefits,” says Ryan Thacker. “It comes down to filing mistakes, including filing at the wrong time. Unfortunately, this money is rightfully yours. And $111,000 could go a long way in retirement”
Conventional wisdom for filing for Social Security is dead
The old rules no longer apply. Choosing your best age to file for Social Security is now more complicated.
“In the past, the goal was to maximize your monthly check,” explains Tyson Thacker. “But what people don’t realize is that everything is connected. When you file for Social Security, it could impact the taxes you pay on your benefits. It could also impact the taxes on your IRA and 401K withdrawals, and other investment income. And finally, it could impact your spousal benefits, and double your Medicare premiums,” he continues.
So, filing for Social Security isn’t just about the amount of your benefits checks. Because everything is connected. You have to consider how all the pieces work together. Otherwise you could end up with less net income from Social Security.
There are even some cases where you could yield more net income from Social Security by filing for your benefits early. And this could be even more true if benefits get cut during your retirement, due to the Social Security Trust Fund running out of money.
There is no one-size-fits-all strategy
It’s natural to speak to friends and family members when making your Social Security decision. It might seem helpful to hear when they filed for their Social Security benefits. But this can lead you to the wrong answer for you. There are just too many factors to consider. These can include your health and expected life span, income sources, retirement expenses, taxes, spousal benefits, inflation, Medicare premiums, the state of the Social Security Trust Fund, and more.
So, you can’t rely on some one-size-fits-all strategy. Because your situation is totally unique to you.
Ultimately, if you want to find your best age to file for your Social Security benefits, it’s smart to get help. There are professionals who specialize in this decision. They can help you make a decision that accounts for all the complex factors that can impact your net benefits.
To help you navigate this complex process, the Thackers and their team at B.O.S.S. Retirement Solutions are offering a free, customized Social Security Analysis.
This analysis simplifies the entire process for you by pinpointing the exact time to maximize your benefits – while considering any impacts on your taxes, IRA and 401K withdrawals; investment income, spousal benefits and Medicare premiums.
Some advisors charge hundreds of dollars for a customized analysis. But B.O.S.S. Retirement Solutions offers this for free – even if you’re not a client.
The strategies used are best-suited for families who have saved more than $200,000 for retirement and have not filed for Social Security.
To schedule your free analysis that could unlock the full potential of your Social Security benefits, call 801-990-5055 or request your free Social Security Analysis online.
Tyson Thacker and Ryan Thacker are the CEO and President of B.O.S.S. Retirement Solutions. They are a five-time winner of Utah’s Best of State Award and have six offices located throughout the Wasatch Front.
Advisory services offered through B.O.S.S. Retirement Advisors, an SEC-Registered Investment Advisory firm. Insurance products and services offered through B.O.S.S. Retirement Solutions. Information contained in this material is given for informational purposes only, and no statement contained herein shall constitute tax, legal or investment advice. The information is not intended to be used as the sole basis for financial decisions, nor should it be construed as advice designed to meet the particular needs of any individual. You should seek advice on legal and tax questions from an independent attorney or tax advisor. B.O.S.S. is not affiliated with the U.S. government or any government agency. Marketing materials provided by Infinity Marketing Services. B.O.S.S. submitted applications and paid fees to be considered for the Utah Best of Utah awards. Results were independently determined by the awarding organization (https://www.bestofstate.org/about.html) and the information B.O.S.S. provided. B.O.S.S. received the Utah Best of State award in 2019, 2020, 2021, 2022, and 2023.
Appaloosa’s David Tepper explains why he’s not buying Nvidia on the dip here
Published Thu, Sep 26 20249:04 AM EDT
Watch CNBC’s full interview with Appaloosa Management founder and president David Tepper
Appaloosa Management’s David Tepper said he is hesitant in buying more shares of the red-hot chipmaker Nvidia even though the stock looks attractive to him.
“We sold a lot of our Nvidia. We thought [the stock] was too high at the time and would come down. Unfortunately, we didn’t buy it when it came back down,” Tepper said on CNBC’s “Squawk Box” Thursday. “Those stocks like Nvidia is a question. Do you have enough power for the growth? Do you have the next generation models that can take their chip?”
The hedge fund manager dumped more than 80% of his Nvidia holding in the second quarter, cutting his stake to about $85 million at the end of June. The billionaire investor said there could still be some upside to artificial intelligence beneficiaries like Nvidia, but he’s uncertain about the long-term prospect of AI demand and if it can be a meaningful contributor to the economy.
Tepper said he does kind of like the stock at these levels, but investors have to believe in a long-term growth story to be big buyers here.
“As you go out years, different things that have to happen to make the growth projections happen,” he said. “I’m not saying it won’t happen. I’m just not smart enough to know if they will.”
Chip stocks have been rising on optimism that the AI boom will require companies to buy more semiconductors and memory to keep up with rising computational requirements for AI applications.
Nvidia emerged as the biggest AI winner by far. After skyrocketing 238% in 2023, the stock has gained another 150%, topping a $3 trillion market cap. Although the stock remains 12% off its all-time high reached in June.
Tepper said he can’t effectively estimate where Nvidia’s earnings will be in 2026 and beyond because the AI story is too fluid and that’s causing him some hesitation.
“You have these multiples out there and how it can go, and the variation of where that earnings can be…. is too much. So it’s not my preferred vehicle versus other things that I have more confidence in,” Tepper said.
Investors are underweight Nvidia compared to the S&P 500, and it’s costing them
Published Wed, Sep 25 202412:00 PM EDTUpdated Wed, Sep 25 202412:25 PM EDT
Institutional portfolios will continue to underperform due to a lack of adequate exposure to Nvidia and other winning technology names, UBS warned.
Strategist Patrick Palfrey told clients that large-cap managers have 4.4% exposure to Nvidia, despite the artificial intelligence darling accounting for 6.6% of the S&P 500. That is the biggest underweight position ever in Nvidia, according to Palfrey.
Jensen Huang’s AI chipmaker is one of a handful of big tech names — including Microsoft, Amazon and Apple — that have smaller positions in these managers’ portfolios than they have in the S&P 500. Google parent Alphabet is a notable exception to this trend.
Institutional investors 10 largest holdings vs S&P 500
| Ticker | Stock | Weight in managers’ portfolios (%) | Weight in S&P 500 (%) |
| MSFT | Microsoft | 6.5 | 7.2 |
| GOOGL | Alphabet | 4.7 | 4.3 |
| NVDA | Nvidia | 4.4 | 6.6 |
| AAPL | Apple | 4.2 | 6.6 |
| AMZN | Amazon | 3.4 | 3.9 |
| META | Meta | 1.9 | 2.4 |
| JPM | JPMorgan | 1.4 | 1.3 |
| V | Visa | 1.3 | 0.9 |
| BRK.B | Berkshire Hathaway | 1.3 | 1.6 |
| LLY | Eli Lilly | 1.2 | 1.6 |
Source: UBS, using data from Standard & Poor’s and FactSet
That is costing investors, Palfrey said. In fact, the disproportionately small holding in Nvidia alone, on a relative basis, has already reduced the average institution’s performance by 1.3 percentage points so far in 2024, he said.
What’s worse, there may be more pain to come as a result of underweighting Nvidia and other major tech stocks, the strategist said.
Looking ahead, expectations for modest economic growth and sliding interest rates bode well for technology and other secular growth areas of the market. Earnings per share growth for megacap tech stocks should be stronger than other parts of the market in future quarters, he said.
As a result, “a continued TECH+ underweight is likely to remain a headwind for many portfolios,” Palfrey wrote to clients.
Concerns about how much further AI plays can run have weighed on Nvidia in recent months, with the chipmaker falling about 12% from its all-time high in June and little changed in the third quarter. But the first half was so strong for Nvidia that it is still ahead almost 150% in 2024.
Nvidia has been a key driver of the broader market’s strength this year. The latest evidence came Tuesday as the S&P 500 hit a record high, boosted by a 4% rally in Nvidia as CEO Huang finished selling shares for the time being under a preset trading plan.
Levels to watch on the Nvidia chart from Katie Stockton after a poor third quarter for AI leader
Published Mon, Sep 30 20241:11 PM EDT
Nvidia (NVDA) is the third largest constituent of the S&P 500, and it has an exceptionally strong influence on investor sentiment. The company is at the heart of the artificial intelligence “trade” which has been a bullish theme for the market over the past two years.
After a booming start to the year, Nvidia is going to finish the third-quarter in the red for the period. With the stock having stalled within its steep long-term uptrend, investors are reasonably wondering if NVDA is signaling an end to the AI trade.
Looking at NVDA from a long-term technical perspective, there are indeed some indications that the consolidation phase that began in July will keep hold.
NVDA – Monthly Bar Chart + 12-month MA + TD Sequential® Model + Stochastic Oscillator + MACD Histogram
CQG
For one, the DeMARK Indicators logged a counter-trend signal in July denoted by the red arrow on the monthly bar chart. The monthly stochastic oscillator has since fallen below 80%, a long-term overbought indication, and the monthly MACD histogram has downticked. Taken together, these signals suggest that NVDA could remain range-bound for another several months.
NVDA’s consolidation phase has taken the shape of a triangle pattern, evident on the daily bar chart.
NVDA – Daily Bar Chart + 50- & 200-day MAs + Stochastic Oscillator
CQG
The boundaries of the triangle converge to capture lower highs and higher lows, reflecting a fickle period for the stock that often comes with indecisiveness. It is possible that investors are not convinced the AI trade warrants another big upmove from NVDA, which was up about 150% in the first half of the year. As we close out the month of September, the stock is down about 3% for the quarter.
The boundaries of the triangle on NVDA’s chart bear watching in the near term, with resistance at its upper boundary near $126, and support from its lower boundary near $107. There is a new downturn in the daily stochastics that supports a pullback from resistance, preserving the triangle formation. If support is broken, we would expect risk to increase to the downside, as is often the case with triangle breakdowns, noting secondary support is near $97. This warrants risk management below $107.
With NVDA’s big footprint in the S&P 500, it is an important stock to watch, even without a position. The sentiment would likely improve for NVDA, and therein the S&P 500, if it manages to lift out of its triangle formation despite indications to the contrary. We would always be respectful of breakouts (and breakdowns), and a triangle breakout would support a retest of NVDA’s all-time high near $141, possibly staving off the end of the AI trade.
—Katie Stockton with Will Tamplin
Access research from Fairlead Strategies for free here.
DISCLOSURES: (None)
All opinions expressed by the CNBC Pro contributors are solely their opinions and do not reflect the opinions of CNBC, NBC UNIVERSAL, their parent company or affiliates, and may have been previously disseminated by them on television, radio, internet or another medium.
THE ABOVE CONTENT IS SUBJECT TO OUR TERMS AND CONDITIONS AND PRIVACY POLICY. THIS CONTENT IS PROVIDED FOR INFORMATIONAL PURPOSES ONLY AND DOES NOT CONSITUTE FINANCIAL, INVESTMENT, TAX OR LEGAL ADVICE OR A RECOMMENDATION TO BUY ANY SECURITY OR OTHER FINANCIAL ASSET. THE CONTENT IS GENERAL IN NATURE AND DOES NOT REFLECT ANY INDIVIDUAL’S UNIQUE PERSONAL CIRCUMSTANCES. THE ABOVE CONTENT MIGHT NOT BE SUITABLE FOR YOUR PARTICULAR CIRCUMSTANCES. BEFORE MAKING ANY FINANCIAL DECISIONS, YOU SHOULD STRONGLY CONSIDER SEEKING ADVICE FROM YOUR OWN FINANCIAL OR INVESTMENT ADVISOR.
Click here for the full disclaimer.
Fairlead Strategies Disclaimer:
This communication has been prepared by Fairlead Strategies LLC (“Fairlead Strategies”) for informational purposes only. This material is for illustration and discussion purposes and not intended to be, nor construed as, financial, legal, tax or investment advice. You should consult appropriate advisors concerning such matters. This material presents information through the date indicated, reflecting the author’s current expectations, and is subject to revision by the author, though the author is under no obligation to do so. This material may contain commentary on broad-based indices, market conditions, different types of securities, and cryptocurrencies, using the discipline of technical analysis, which evaluates the demand and supply based on market pricing. The views expressed herein are solely those of the author. This material should not be construed as a recommendation, or advice or an offer or solicitation with respect to the purchase or sale of any investment. The information is not intended to provide a basis on which you could make an investment decision on any particular security or its issuer. This document is intended for CNBC Pro subscribers only and is not for distribution to the general public. Certain information has been provided by and/or is based on third party sources and, although such information is believed to be reliable, no representation is made with respect to the accuracy, completeness, or timeliness of such information. This information may be subject to change without notice. Fairlead Strategies undertakes no obligation to maintain or update this material based on subsequent information and events or to provide you with any additional or supplemental information or any update to or correction of the information contained herein. Fairlead Strategies, its officers, employees, affiliates and partners shall not be liable to any person in any way whatsoever for any losses, costs, or claims for your reliance on this material. Nothing herein is, or shall be relied on as, a promise or representation as to future performance. PAST PERFORMANCE IS NOT INDICATIVE OF FUTURE RESULTS. Opinions expressed in this material may differ or be contrary to opinions expressed, or actions taken, by Fairlead Strategies or its affiliates, or their respective officers, directors, or employees. In addition, any opinions and assumptions expressed herein are made as of the date of this communication and are subject to change and/or withdrawal without notice. Fairlead Strategies or its affiliates may have positions in financial instruments mentioned, may have acquired such positions at prices no longer available, and may have interests different from or adverse to your interests or inconsistent with the advice herein. Any investments made are made under the same terms as nonaffiliated investors and do not constitute a controlling interest. No liability is accepted by Fairlead Strategies, its officers, employees, affiliates, or partners for any losses that may arise from any use of the information contained herein. Any financial instruments mentioned herein are speculative in nature and may involve risk to principal and interest. Any prices or levels shown are either historical or purely indicative. This material does not take into account the particular investment objectives or financial circumstances, objectives or needs of any specific investor, and are not intended as recommendations of particular securities, investment products, or other financial products or strategies to particular clients. Securities, investment products, other financial products or strategies discussed herein may not be suitable for all investors. The recipient of this information must make its own independent decisions regarding any securities, investment products or other financial products mentioned herein. The material should not be provided to any person in a jurisdiction where its provision or use would be contrary to local laws, rules, or regulations. This material is not to be reproduced or redistributed absent the written consent of Fairlead Strategies.
How your tech stock holdings will be affected by the election
Published Wed, Sep 25 20242:02 PM EDTUpdated Wed, Sep 25 20244:27 PM EDT
The outcome of November’s presidential election could have major implications for some popular technology stocks.
Ahead of the high-stakes race, Raymond James laid out a list of some key technology, media and telecommunications stocks that could benefit in a variety of different outcomes. In 2020, the firm’s picks outperformed the S&P 500 by 1% between the election and inauguration — and 7.7% in the year that followed.
Broadly speaking, Raymond James views a Donald Trump reelection as a potential boon for the industry and artificial intelligence — with heightened export controls in the semiconductor industry. It could also lead to increased tensions with China and the obstruction of mergers and acquisitions activity across borders.
“The deregulatory focus of a second Trump administration would likely see less federal oversight and the potential rollback of reporting requirements for AI firms developing frontier models, while also supporting data center development through nuclear energy permitting,” wrote Ed Mills, the firm’s Washington policy analyst.
Meanwhile, a victory by Vice President Kamala Harris may lead to tighter AI regulations focused on safety, ethics and protecting consumers, he said. Mills also anticipates more focus on supporting domestic semiconductor production.
Democratic sweep
Winners in a Democrat sweep
| Ticker | Name | YTD % change |
| VEEV | Veeva Systems | 8 |
| VISA | Visa | 4.8 |
| JBL | Jabil | -11.4 |
| FLEX | Flex | 45 |
| CMCSA | Comcast | -5.7 |
Source: Raymond James, FactSet
A Harris presidency and a Democrat-led Congress could be a boon for companies with exposure to climate regulation and “high margin vertical” software companies with less cyclical exposure, the firm said. That includes cloud solutions provider Veeva Systems.
Jabil and Flex should also benefit in this scenario, the firm said, with analyst Melissa Fairbanks noting that a Harris win would incentivize solar and renewable energy. Shares of Jabil have slumped about 10% this year, while Flex has outperformed the market and gained more than 44%.
Visa is another potential winner in a Democratic sweep, poised to benefit from the likelihood of a higher corporate tax rate, according to analyst John Davis.
“A Democratic sweep would likely enhance regulatory scrutiny across banks and large cap technology, which historically has results in outperformance by large cap fintech as these stocks tend to be hiding places for both tech and financial portfolio managers,” he wrote.
https://www.thegatewaypundit.com/2024/09/nancy-pelosis-husband-dumps-500k-visa-stock-weeks/
Nancy Pelosi’s Husband Dumps Over $500K in Visa Stock Weeks Before DOJ’s Antitrust Lawsuit
Nancy Pelosi’s husband, Paul Pelosi, dumped over $500,000 worth of Visa stock just weeks before the Department of Justice slapped the financial giant with an antitrust lawsuit, according to the New York Post.
The timing couldn’t be more suspect. Visa, one of the most dominant players in the debit card market, is now facing charges of monopolizing the industry.
The DOJ’s antitrust unit claims Visa has abused its market power, forcing financial tech companies to work with them while penalizing those who try to go with competitors.
According to the complaint, more than 60% of debit transactions in the United States run on Visa’s debit network, allowing it to charge over $7 billion in fees each year for processing those transactions.
The complaint further alleges that Visa illegally maintains its monopoly power by insulating itself from competition.
For example, Visa wields its dominance, enormous scale, and centrality to the debit ecosystem to impose a web of exclusionary agreements on merchants and banks. These agreements penalize Visa’s customers who route transactions to a different debit network or alternative payment system.
In so doing, the complaint alleges, Visa locks up debit volume, insulates itself from competition, and smothers smaller, lower-priced competitors.
Visa also induces would-be competitors to become partners instead of entering the market as competitors by offering generous monetary incentives and threatening punitive additional fees.
As the complaint alleges, Visa coopted the competition because it feared losing share, revenues, or being displaced by another debit network altogether.
And what was Paul Pelosi doing while the DOJ built its case? Selling off massive chunks of Visa stock.
On July 3, a disclosure showed that the former Speaker of the House’s spouse unloaded 2,000 shares of Visa, valued somewhere between $500,000 and $1 million. All this, just three months before the federal hammer dropped.
Nancy Pelosi’s office, of course, was quick to deny any wrongdoing. Her spokesperson claimed that Pelosi has no involvement in any stock transactions.
“Speaker Pelosi does not own any stocks, and she has no prior knowledge or subsequent involvement in any transactions,” the congresswoman’s spokesperson told The Post.
Visa shares plummeted by 5.5% after the news of the lawsuit hit the markets. And yet, the Pelosis dodged that bullet by a matter of weeks. Coincidence? Skeptics are right to ask: How much did Nancy Pelosi know? Did her perch as a top Democratic power player give her insider knowledge that her husband conveniently acted upon?
Public records and filings don’t lie. Even though Paul Pelosi’s stock dump didn’t occur at the height of the market fallout, the timing of the sale—mere weeks before a bombshell antitrust lawsuit—raises a cloud of suspicion.
Last year, Paul Pelosi dumped 20,000 shares of Google stock in December – a month before the Department of Justice and Merrick Garland filed their antitrust lawsuit.
In 2022, Paul Pelosi exercised $1 million to $5 million Alphabet call options before Democrats proposed a congressional stock trading ban. In the same year, Paul Pelosi sold all of his NVIDIA stock just one day before Congress was set to vote on a bill that would boost domestic production of semiconductors.
https://tradethatswing.com/seasonal-patterns-of-the-stock-market/
Best and Worst Months for the Stock Market – Seasonal Patterns
September 27, 2024 Posted by Cory Mitchell, CMT Investing, Swing Trading Stocks Info 5 Comments
Learn the seasonal patterns of the stock market, including which months perform best and worst, whether to buy before or after holidays, and other patterns. See the best and worth months for stocks over the last 10 and 20 years.
October has historically been a decent month for stocks. The average return in October has been positive over the last 10 and 20 years and more often than the price rises over the course of the month.
Stock market seasonal patterns are the directional tendencies of stock indices based on the time of the year. Certain times of the year tend to be more bullish (go up) for stocks, while other times during the year are more bearish (go down).
Seasonality is essentially an average, based on history, of how the stock market tends to perform throughout the year. Averages are a guide, a tool, but don’t forecast with accuracy what will happen this year. That said, some investors and traders may use seasonal tendencies to build strategies or enhance existing ones.
For example, if we know September tends to be a poor month for stocks, a trader who primarily takes long positions may opt to take this month off, or exit their positions quicker than usual if they start to decline during September. A trader could buy stock index ETFs (such as SPY or IVV) during seasonally strong months if the ETFs start rising. An investor may buy in and then sell out at certain times of the year (if feasible to do so with commissions). Buy-and-hold investors may wish to invest during seasonally weak months to take advantage of lower prices.
Seasonality can be used in many ways. Individual stocks, commodities, and currencies also tend to have seasonal tendencies.
So let’s jump into the seasonal patterns of the stock market.
Seasonal Patterns – Best and Worst Months for the Stock Market, Summary Table (20-year averages)
| Up Months | Weak Months | Best 3 Months | Worst Months | |
| NYSE Composite | March, April, July, October, November, December | January, February, May, June, August, September | April, July, November | June, August, September |
| S&P 500 | February March, April, May, July, August, October, November, December | January, June, September | April, July, November | June, September |
| Nasdaq 100 | January, March, April, May, July, August, October, November, December | February, June, September | April, July, October/November | February, June, September |
A full breakdown with monthly average gains and the percentage of time the month has moved higher is provided below.
Prefer video? The following video goes through all the data on the best and worst months for the stock market based on three different indices.
Stock Market Seasonal Patterns
This is how the stock market has performed in each of the months over the last 10 and 20 years.
The number at the top of the column is the percentage of time the stock index has risen. If it says 70, that means the stock index went up in that month 14 years out of 20 (70%).
The number at the bottom of the column is the average percentage gain or loss in that month over the 10 or 20 years.
To give you a better idea of the best and worst months of the year, we will look at three major stock indices, the NYSE Composite, the S&P 500, and Nasdaq 100.
The NYSE Composite is all the stocks listed on the New York Stock Exchange so it’s a very diverse stock index. The S&P 500 includes only the largest companies in the US, and the Nasdaq 100 includes large companies that are primarily technology-based.
The Passive Stock Investing Using ETFs eBook shows how to invest using a buy-and-hold strategy to compound money in the background—in good market conditions and bad—with little effort, even while swing trading and day trading.
NYSE Composite Seasonal Patterns
Here is a summary of the NYSE Composite’s best and worst months over the last 20 years (2004-2023)
- Best Months: April, July, October, November, and December
- Worst Months: January, February, June, August, September
Seasonal charts courtesy of StockCharts.com.
The above chart looks at 20 years of data. If we only look at the last 10 years (below), things change a little bit.
NYSE Composite best and worst months over the last 10 years (2014-2023)
- Best Months: April, June, July, October, November, and December
- Worst Months: January, February, March, August, and September are weaker periods.
S&P 500 Seasonal Patterns
Here is how the S&P 500 index has done. The SPDR S&P 500 ETF (SPY) was used to generate the seasonality figures.
S&P 500 best and worst months over the last 20 years (2004-2023)
- Best Months: March, April, May, July, October, November, and December
- Worst Months: January, June, and September
Over the 10 years, not much changed except that the market is pretty much strong from February through to the end of August. September is weaker, and then the end of the year tends to be strong.
S&P 500 best and worst months over the last 10 years (2014-2023)
- Best Months: March, April, May, June, July, August, October, November, December
- Worst Months: January, September
For a different look, and to see how some actual years have played out, here are the yearly charts of the S&P 500 (SPY) from 2014 to 2023. They are overlaid on top of each other for each viewing.
Nasdaq 100 Seasonal Patterns
Here is how the Nasdaq 100 index has done. The Invesco QQQ Trust (QQQ) was used to generate the seasonality figures.
Nasdaq 100 best and worst months over the last 20 years (2004-2023)
- Best Months: January, March, April, May, July, August, October, November, and December
- Worst Months: February, June, and September
Below is what it looks like over the last 10 years. Not much changes except December has been weaker.
Most months are pretty good.
Nasdaq 100 best and worst months over the last 10 years (2014-2023)
- Best Months: January, March, April, May, June, July, August, October, November
- Worst Months: February, September, December
For a complete swing trading method, including scanning, stock selection, placing trades, and taking profitable exits, see the Complete Method Stock Swing Trading Course.
Stock Market Seasonality Considerations
Think of seasonality as a tool, not a crystal ball. It shows historical tendencies, not what will happen this year.
If the market tends to rise 80% of the time in April, that means it went up in April 16 years of out the last 20, but it may not go up this year.
The average monthly return numbers can also be skewed by an extremely large fall or rise in a particular year. So a 1% average return could be the result of a couple big drops of 10% in certain years and big rallies of 10% in others. The average is near zero, but investors should be aware that the average doesn’t tell the whole story.
Even during months that have a high probability of rising, stop losses and risk control should be used, because if the price drops, we don’t know how far it will drop.
The US stock market has an overall upward bias over the long term.
The S&P 500 has produced 10.6% yearly returns over the last 100 years.
The Nasdaq 100 has produced returns of 14.7% per year over the last 20 years.
The Russell 2000 has produced an average yearly return of 8.4%.
Therefore, investors may consider using the weak months as entry points if looking to take long-term positions.
Additional Stock Market Seasonal Patterns
There are a number of specific seasonal patterns in stocks that people have noticed and tested. These tend to be shorter-term patterns.
Pre-Holiday Rally Pattern
It’s been noted that there’s a positive expectancy for buying stocks one to two days before a long weekend/holiday and then selling one to two days after. Trading volume tends to be lower heading into long weekends which may help explain prices drifting up (there’s a long-term upward bias to the stock market). Or possibly people are feeling good about a long weekend and buy some stock.
Short-term traders would buy one or two days prior to the holiday, and then sell one to two days after the holiday. Longer-term traders can also take advantage and use the one or two days prior to a holiday to pick up some stocks they were eyeing.
Actual testing reveals that most holidays don’t produce a big pop in stocks, but a few are more reliable and tend to produce positive returns over time according to QuantifiedStrategies:
- July 4th
- Thanksgiving
- Christmas (discussed more below)
At least according to history, these are better holidays than others for deploying the pre-holiday rally strategy.
Post-Holiday Rally Pattern
Buying on the close the day after the holiday and then selling on the next close has also shown a steadily rising equity curve (according to QuantifiedStrategies).
Santa Claus Rally Pattern
This one is highly documented and generally quite profitable, yielding an average of about 1.1% per trade in an index like the S&P 500. The strategy requires holding for the last 4 to 5 days of the year and then selling two to three days into the new year. The exact number of days can vary based on weekends and market closures. So utilize the closest number of days you can.
According to Quantified Strategies, buying on the third Friday of December (before options expiration) and selling on the close of the third trading day of January bumped the average return up to 1.79% per trade.
Intraday Patterns
There are also intraday repeating patterns that play out, which are useful for short-term traders and day traders.
Stock Market Seasonal Patterns Conclusion
Seasonal patterns can be useful, but they can also be traps if we blindly follow them. Risk management must always be used to control losses, yet that may also mean getting out of some trades that would have otherwise been profitable if the favorable seasonal statistics played out.
Most season patterns are not statistically significant, meaning they are not based on enough data or haven’t accounted for other factors. They are essentially ideas with some evidence.
Before putting your capital to work based on seasonal patterns you may wish to do more thorough research.
Learn how to day trade stocks, capitalizing on patterns that repeat over and over each day. Requires only 30 mins of trading each day. Trade longer if you wish.
See the Price Action Stock Day Trading Course.
By Cory Mitchell, CMT
Disclaimer: Nothing in this article is personal investment advice, or advice to buy or sell anything. Trading is risky and can result in substantial losses, even more than deposited if using leverage.
HI Financial Services Mid-Week 06-24-2014