
HI Market View Commentary 09-23-2024
What are the expectations for the market now that we know we have a 1.00% drop/decreased in the FOMC rate path and another 1.00% drop next year as well?
Reasoning on what this all means
Better earnings for small caps, or any variable rate fixed cost companies,
Cheaper to borrow money=Housing, credit card rates, materials
IF somehow the fed is NOT going to diminish liquidity strange effects might happen
What is the most important event effecting the stock market?=ELECTION
Democrate = Higher Taxes,
Republicans = Tariffs=Higher Prices, Lower Taxes
Yes we are facing uncertainties but that’s why the protective put is so important
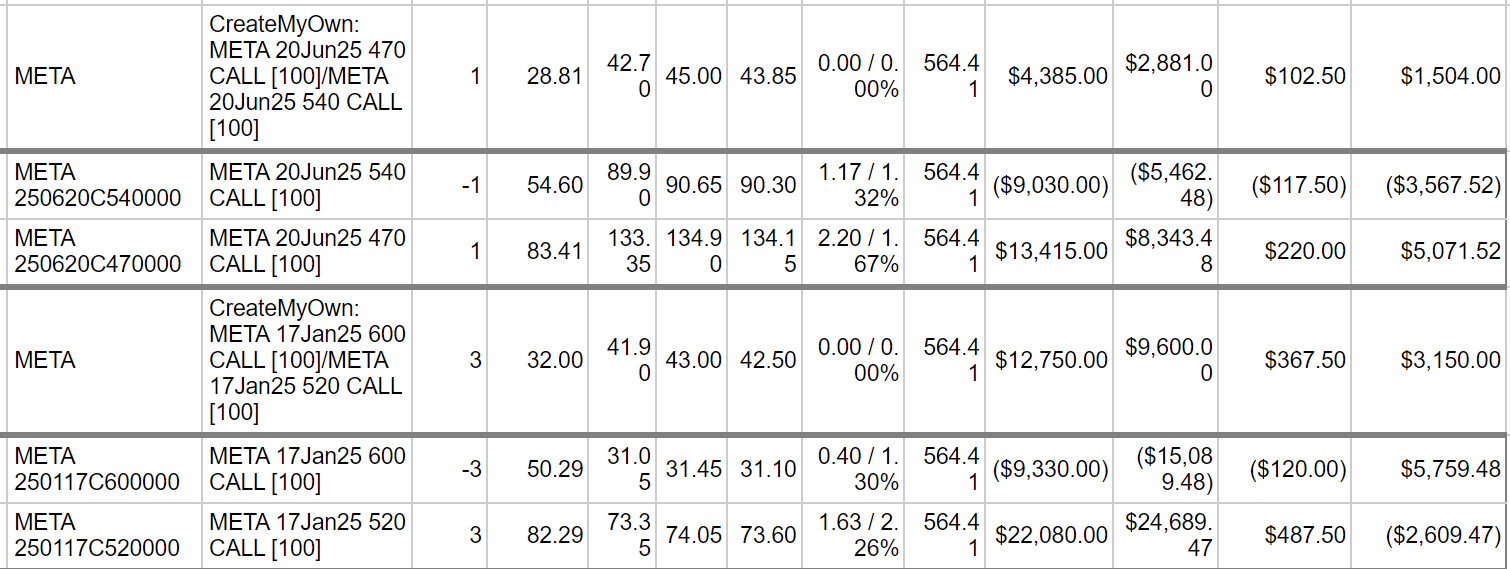
Kevin I DON’T Understand the stock replacement strategies
![]()
https://www.briefing.com/the-big-picture
The Big Picture
Last Updated: 20-Sep-24 15:31 ET | Archive
Market needs companies to earn their keep
The S&P 500 hit a new record high, energized by the Fed’s aggressive move to cut the target range for the fed funds rate by 50 basis points to 4.75-5.00%. There were cogent arguments that the Fed needed to be aggressive because the policy rate is still too high relative to the inflation rate.
The inference is that the Fed risks inviting tough economic times by keeping real rates too high for too long.
There were also arguments that suggested the Fed should not cut rates — or certainly not by 50 basis points with the first move — since the PCE inflation rate of 2.5% is still above the Fed’s 2.0% target, weekly initial jobless claims are nowhere near recession levels, and stock prices are at record highs.
The inference is that the Fed could reignite inflation by easing policy too much, too soon.
We aren’t here to litigate either case today. The market will do that on its own, but early returns suggest the market has literally bought into the argument that the Fed needs to be aggressive, and pro-active, to ensure the labor market doesn’t weaken further and jeopardize the soft-landing outcome.
That buy-in has driven multiple expansion, which is to say stock prices have gone up at a faster pace than earnings estimates. That isn’t an offside reaction with market rates falling and the Fed itself projecting another 150 basis points worth of easing between now and the end of 2025.
The key to it all, however, is that earnings estimates stay onside.
A Welcome Sight
So far, analysts continue to model generally good things for the earnings outlook.
The forward 12-month estimate is $266.63, up from $259.79 at the end of June, according to FactSet. Calendar-year 2025 earnings, meanwhile, are projected to be $276.84. That is 15.1% higher than the calendar-year 2024 estimate of $240.55. The calendar-year 2026 estimate sits at $311.38, up 12.5% from the current calendar-year 2025 estimate.
Double-digit earnings growth is always a welcome sight, but it is admittedly difficult to be “farsighted” into 2026 right now knowing the 2017 tax cuts expire at the end of 2025, leaving tax policy up in the air in front of the November election.
Corporate tax rates, individual tax rates, and capital gains tax rates are all subject to change based on the election outcome, and any changes will change the calculus for 2026 estimates.
For now, the 2026 estimate is a nice placeholder.
Multiple Expansion
The prevailing estimate in the market is the forward 12-month EPS estimate, which has been losing pace in recent weeks. Since the low on September 6, the S&P 500 has increased 5.6% while the forward 12-month EPS estimate has risen 1.5%.
It is encouraging to see the EPS estimate still rising, but the corresponding earnings multiple is as well. In the same period, the forward 12-month P/E ratio has gone from 20.4 to 21.5. The latter is a 34% premium to the 20-year average and a 19% premium to the 10-year average, according to FactSet.
As discussed in last week’s column, that is a rich P/E multiple for the market-cap weighted S&P 500 but, to be fair, the price-to-earnings growth ratio of 1.43 (P/E divided by earnings growth rate) is a modest discount to the 10-year average of 1.49.
What It All Means
Earnings growth is a very important denominator, and why the earnings estimate trend will be a market driver. In turn, that is why economic growth is held dear by the market because earnings prospects ride on economic growth prospects.
Hence, the market has been cheered by the Fed taking an aggressive line with its rate cut, seeing it as a down payment on the house call that the economy will not suffer a hard landing.
Nobody wants that, because the harder the economy falls, the harder earnings estimates fall, and richly valued stocks follow suit.
The market has made great strides on its charge to record territory, but companies need to earn their keep if the market is going to keep on keeping on at rich valuations that are easier to discount when earnings growth estimates are rising.
—Patrick J. O’Hare, Briefing.com
(Editor’s Note: the next installment of The Big Picture will be published the week of September 30)
MU 09/25 AMC
Where will our markets end this week?
Higher
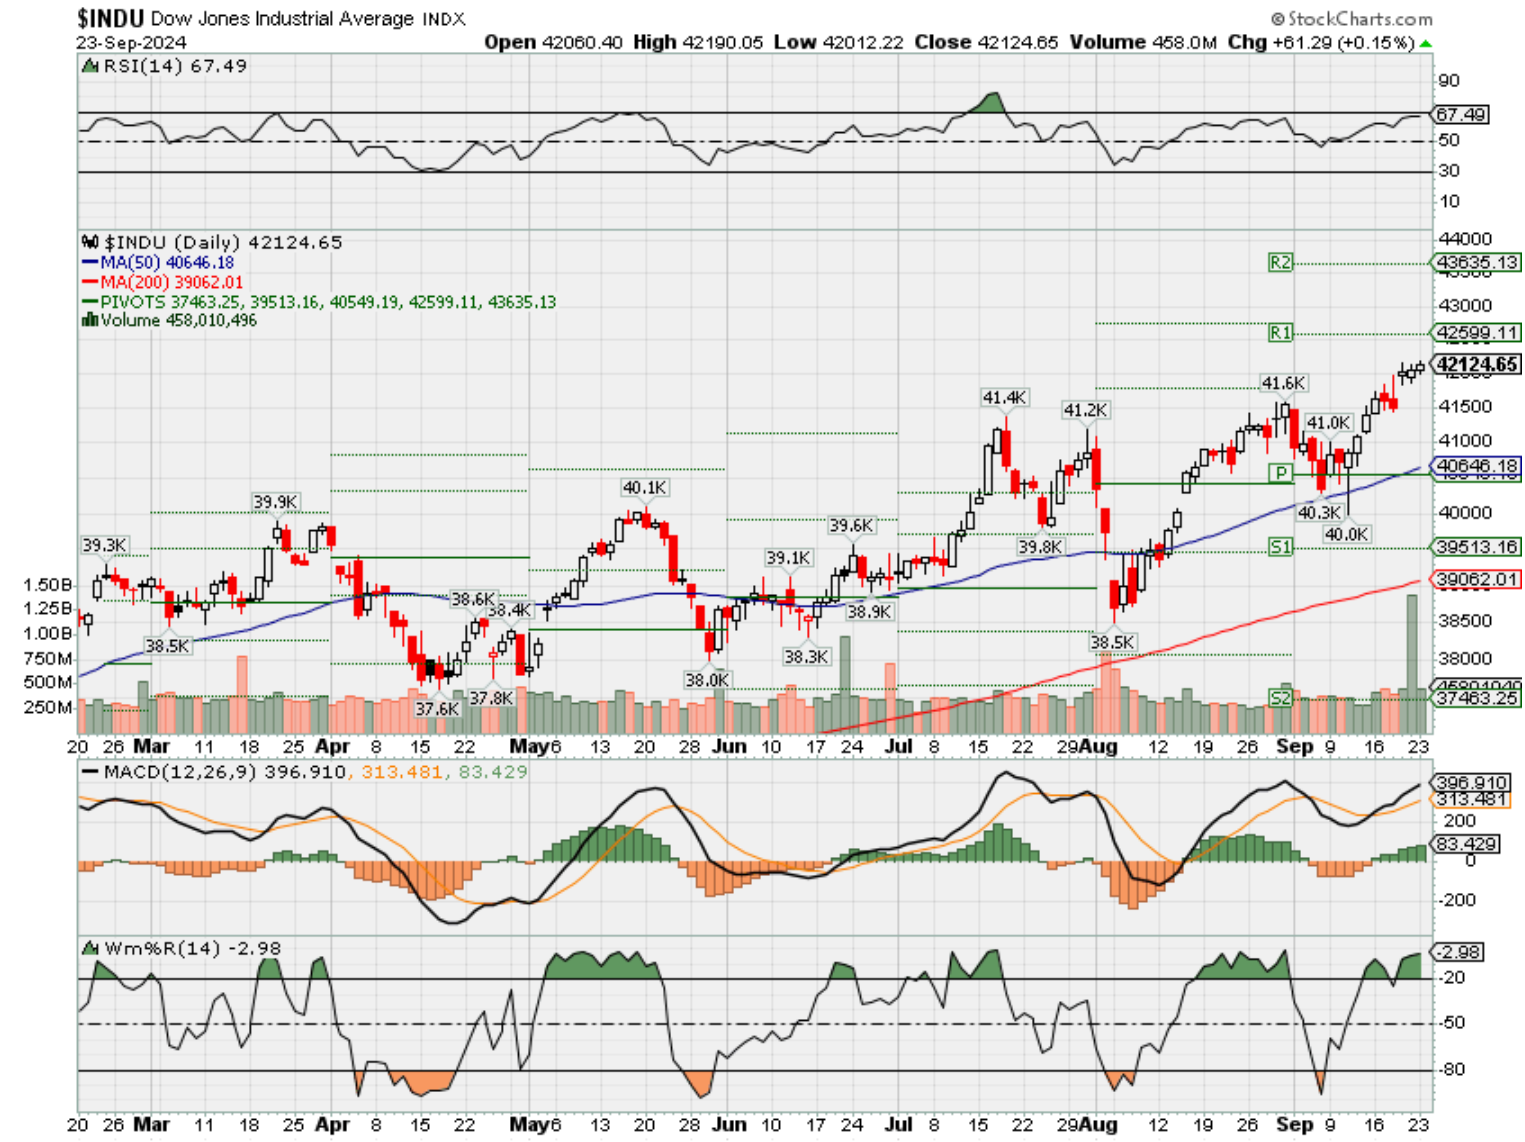
DJIA – Bullish
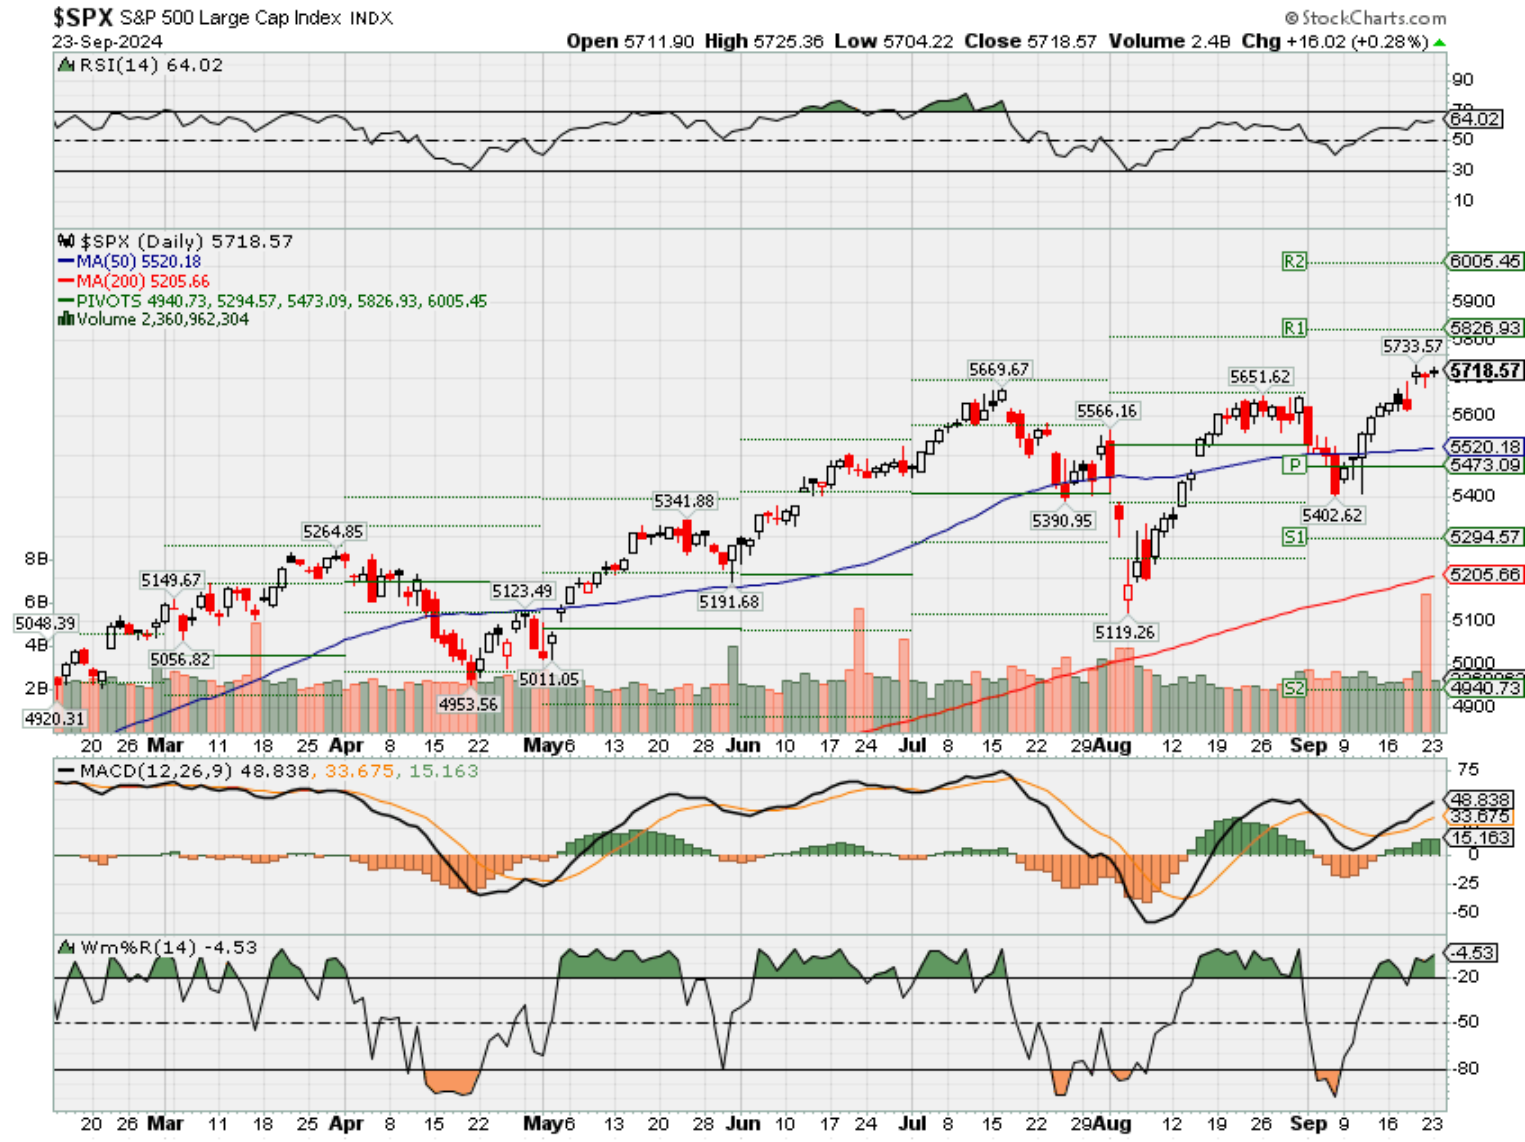
SPX – Bullish
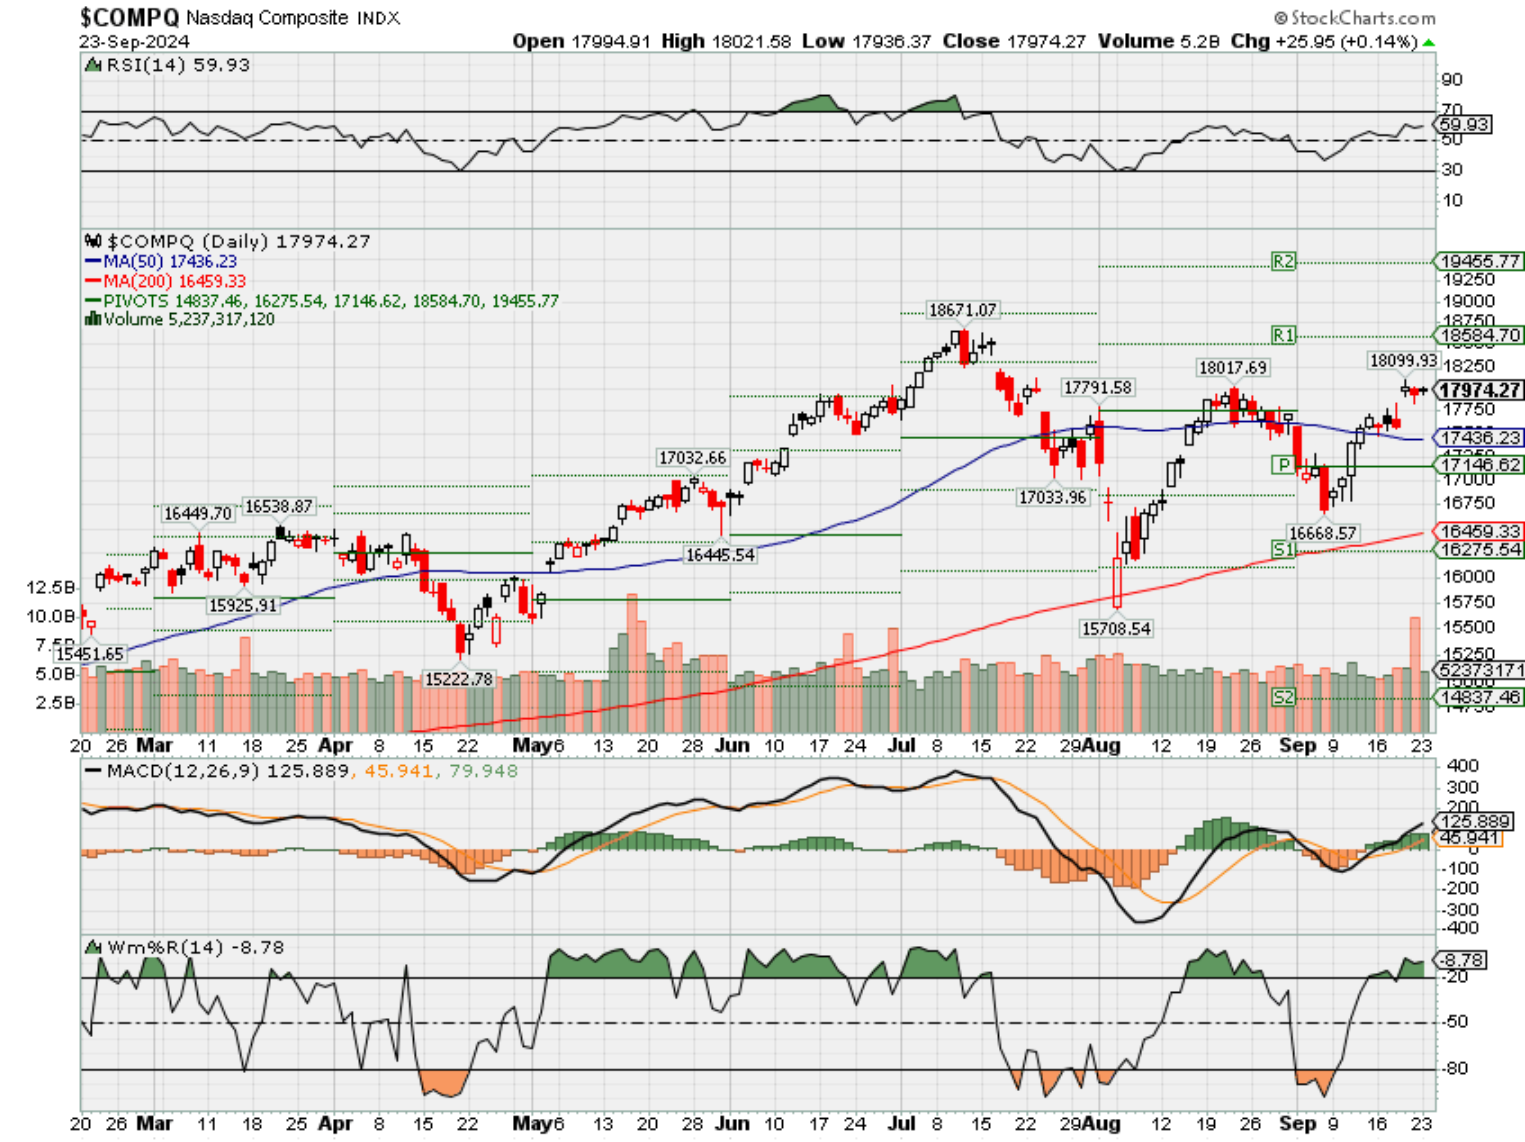
COMP – Bullish NEW support level @ 17, 496-17,480
Where Will the SPX end October 2024?
09-23-2024 -2.50%
Earnings:
Mon:
Tues: AZO, KBH,
Wed: FUL, MU,
Thur: KMX, JBL, BB, MTN, COST
Fri:
Econ Reports:
Mon:
Tue Housing Price Index, S&P Case Shiller Index, Consumer Confidence
Wed: MBA, New Homes Sales,
Thur: Initial Claims, Continuing Claims, Durable Goods, Durable Goods ex-trans, GDP, GDP Deflator, Pending Home Sales,
Fri: PCE Prices, PCE Core, Michigan Sentiment, Personal Income, Personal Spending
How am I looking to trade?
We Started taking protection off based on Technical Analysis
www.myhurleyinvestment.com = Blogsite
info@hurleyinvestments.com = Email
Questions???
The big post-Fed rally could get tested in week ahead: ‘A lot holds in the balance’ of the next few days
Published Fri, Sep 20 20243:45 PM EDTUpdated Fri, Sep 20 20244:49 PM EDT
Next week could be critical in determining whether stocks at all-time highs can sustain their momentum, at least for a little while longer.
The Dow Jones Industrial Average topped 42,000 this week for the first time ever, while the S&P 500 breached the 5,700 milestone, after the Federal Reserve cut interest rates by a half-percentage point.
But the next several trading sessions could determine whether the big post-Fed rally can continue, especially as investors brace for October — a historically weak period for equities that could be even more volatile than usual because of the approaching U.S. presidential election.
“A lot holds in the balance of the next couple or few days,” said Katie Stockton, founder at Fairlead Strategies.
On Friday, the 30-stock Dow, the S&P 500 and the Nasdaq Composite each closed higher by more than 1% for the week.
‘Pending confirmation’
Now that the S&P 500 has made it past resistance at 5,670, Fairlead Strategies’ Stockton said she is carefully monitoring that level over the next few days to see whether the breakout can continue — though some signs of exhaustion are giving her pause.
The breakout is ”‘pending confirmation,’” Stockton said. “And the confirmation is important to us, because there’s usually nothing worse than a non-confirmed or false breakout.”
For the S&P 500, a confirmation would be a “bullish short-term development” indicating the broader index could rise to 5,935 over the next three to eight weeks, she said. That’s a roughly 4% rise from current levels.
The technician, who anticipates a seasonal correction in October, expects a confirmation would also minimize any pullback next month, while a breakdown could signify a deeper one.
“If we did see the breakout confirmed, that would probably minimize the corrective phase that we’re expecting,” Stockton said. “It wouldn’t mean that we can’t see a pullback, but the correction into sort of that 5000 range would be made less likely by a breakout, in my opinion.”
Overall, Stockton expects that the longer-term setup for the S&P 500 is “a bit overdone.” She expects stocks will be in a trading range environment for the next nine months.
The broader index was last hovering around the 5,700 threshold.
Softer economic readings, vanquished inflation?
At least in terms of the calendar, it appears that stocks will have plenty to test its advance in the coming week, as a raft of economic reports are anticipated to show softer readings than they had previously.
Consumer confidence in September is expected to have weakened, to 102.9 from 103.3, according to FactSet. Durable orders, a measure of new orders for manufactured goods, are expected to have slid 2.9% in August, compared to a 9.8% increase a month earlier.
“A bulk of the economic reports should show weakness over strength,” said Sam Stovall, chief investment strategist at CFRA Research. “Thereby, I guess, maybe causing some to say, ‘Gee, maybe that’s the reason why we cut rates, is because things are looking a little weaker.’”
Investors can continue to expect good news on the inflation front. The August personal consumption expenditure price index that’s due out Friday is expected to show pricing pressures continuing to pull back from their highs.
For investors, that could confirm that the Fed is right to shift its focus to the employment side of its mandate — with Fed Governor Christopher Waller on Friday saying the stronger trend lower was behind his support of a half percentage point rate cut in the last meeting.
Notably, Fed Chair Jerome Powell in his press conference Wednesday that central bank economists anticipate PCE will be up 2.2%. It was at 2.5% the previous month.
“I think the PCE will be icing on the cake,” Stovall said.
Week ahead calendar
All times ET.
Monday, Sept. 23
8:30 a.m. Chicago Fed National Activity Index (August)
9:45 a.m. PMI Composite preliminary (September)
9:45 a.m. Markit PMI Manufacturing preliminary (September)
9:45 a.m. Markit PMI Services preliminary (September)
Tuesday, Sept. 24
9 a.m. FHFA Home Price Index (July)
9 a.m. S&P/Case-Shiller comp.20 HPI (July)
10 a.m. Consumer Confidence (September)
10 a.m. Richmond Fed Index (September)
Earnings: AutoZone
Wednesday, Sept. 25
10 a.m. New Home Sales (August)
Earnings: Micron Technology
Thursday, Sept. 26
8:30 a.m. Continuing Jobless Claims (9/14)
8:30 a.m. Durable Orders ex-Transportation (August)
8:30 a.m. GDP (Q2)
8:30 a.m. Initial Claims (9/21)
10 a.m. Pending Home Sales Index (August)
11 a.m. Kansas City Fed Manufacturing Index (September)
Earnings: Costco Wholesale, CarMax
Friday, Sept. 27
8:30 a.m. PCE Deflator (August)
8:30 a.m. Core PCE Deflator (August)
8:30 a.m. Personal Consumption Expenditure (August)
8:30 a.m. Personal Income (August)
8:30 a.m. Wholesale Inventories preliminary (August)
10 a.m. Michigan Sentiment final (September)
This trade can hedge against a spike in volatility as election nears, Goldman says
Published Mon, Sep 23 20244:03 PM EDTUpdated 3 Hours Ago
Jesse Pound@/in/jesse-pound@jesserpound
With the August sell-off fading from view and the U.S. presidential election still more than a month away, this may be the right time for investors to buy some protection against volatility, according to Goldman Sachs.
The CBOE Volatility Index, or VIX, fell below 16 on Monday and is now flirting with its lowest level since the July doldrums. The index, often called Wall Street’s “fear gauge,” is a measure of expected volatility over the next 30 days based on market pricing of S&P 500 options. Its current level is a stark retreat from the 65 mark the VIX hit on Aug. 5 during the global market sell-off.
The VIX has fallen well below its spike from Aug. 5.
Arun Prakash of Goldman’s derivatives research team said in a note to clients Friday that the pullback has likely gone too far, especially with the added uncertainty of the U.S. election ahead.
“Our historical study of volatility shows that the VIX averaged 22 points in October, 4 points above the current VIX level. We believe the low implied volatility, upcoming October earnings season and elections provide an attractive opportunity for investors to hedge a potential rise in volatility,” the note said.
The trade idea offered by Prakash involves buying call options on the VIX itself. The options would have a strike price of 18 and expire in November, serving as a bet that expectations of volatility will rise as the election nears.
“VIX has increased 6% from September to October historically, driven by seasonality. We believe SPX close to its all-time highs, VIX below its multi-year average, our model estimated upside to VIX and seasonal factors offer a compelling case for investors to own VIX calls to hedge potential rise in volatility,” the note said.
If the VIX fails to surpass the mark of 18 before expiration, the loss on the trade is equal to the premium paid for the option up front. There are no additional losses on the trade if the VIX actually declines instead.
The Fed finally cuts rates. What the stock market historically does from here
Published Tue, Sep 17 20241:59 PM EDTUpdated Wed, Sep 18 20243:09 PM EDT
The Federal Reserve cut interest rates for the first time in four years Wednesday. Let’s take a look at how stocks performed at the start of prior easing cycles.
How it will perform from here depends largely on the economy, historical data shows.
In total, across all cycles, the S&P 500′s performance in the aftermath of the first cut was largely positive but with some big misses when the economy turned down. Overall, the broader index was higher 70% of the time three and six months out, and 80% of the time one year later, according to Canaccord Genuity, which reviewed the last 10 easing cycles going back to 1970.
The S&P 500 averaged a 5.5% gain in the first three months after an initial cut, 10.6% six months later and 11.3% one year out.
But exclude the times when a recession followed and compute only using the soft-landing scenarios — which is the consensus this time — and the performance gets even better.
A recessionary scenario was defined by Canaccord as one in which the economy was already in a downturn or entered one within 12 months of the first cut.
In the years when the S&P 500 experienced no recession during or soon after the first reduction — such as in 1984, 1989, 1995 and 1998 — the benchmark was higher 100% of the time three, six and 12 months later.
On average, the broader index jumped 10.2% three months later, 14.7% six months out and 18.6% one year afterward.
Other investment banks have noted this discrepancy, with Bank of America Securities also highlighting the pattern in a recent note.
“An easing cycle itself isn’t necessarily positive. In fact, [the S&P 500] posted weaker returns after first rate cuts on average, but with distinct divergence based on the economy,” the firm’s Ohsung Kwon wrote Monday.
The S&P 500 “rose only 20% of the time in 100 trading days after first cuts when there was a recession within six months, but 100% of the time when there was no recession (+8% on avg.),” she said.
By sector, Canaccord Genuity noted the three sectors averaging the best returns one year later were communication services, information technology and health care. The worst-performing sectors 12 months after a rate cut were materials, utilities and consumer discretionary.
— CNBC’s Gabriel Cortes contributed to this report.
These are the stocks that do best immediately after the first Fed rate cut of a cycle
Published Wed, Sep 18 202411:51 AM EDTUpdated Wed, Sep 18 20243:12 PM EDT
The Federal Reserve just cut rates by a half point. CNBC Pro took a look at what stocks historically do best immediately after the start of an easing cycle.
The Fed’s decision to cut interest rates has the potential to bolster several individual names, if history is any indication.
CNBC Pro searched for the stocks set to gain the most following a Fed rate cut, using data from prior easing cycles going back to 1984. Here is what we used for criteria:
- S&P 500 member
- Highest median performance three months after an initial cut
These are the top 10 names we came up with.
FactSet
Apple is the only megacap tech stock to surface on this list. The tech behemoth is up more than 12% this year, and it has struggled recently following reports the company’s new iPhone 16 is experiencing weaker demand.
Historically, Apple is up about 16% on a median basis three months after an initial cut from the Fed. On average, it has gained nearly 9% during that period.
Technology names tended to do well immediately after a Fed rate cut, with digital storage company Western Digital the top-performing stock, and semiconductor equipment company Lam Research the second-best performing one.
Three months after a Fed rate cut, Western Digital gained more than 26% on a median basis, while Lam Research advanced more than 22%.
Supermarket chain Kroger came up on the list, surging about 16% in the three months after the Fed lowers interest rates. Big-box retailer Target also performed well, up roughly 14% during the period.
Nvidia vs. Alphabet: Fund manager reveals which to hold, and which to sell
Published Tue, Sep 17 20247:07 PM EDT
Amala Balakrishner@in/amala-balakrishner@_amalabk
Google-parent Alphabet has long been an investor favorite among tech stocks, but one portfolio manager says he’s now steering clear.
“We’ve been big fans of Alphabet’s Google now for many years. However, we think with the introduction of AI, SearchGPT has become a direct competitor to Google[’s] search business,” Jordan Cvetanovski, from Sydney-headquartered Pella Funds, said, adding that its advertising business is also under threat.
SearchGPT is a prototype developed by the Microsoft-backed OpenAI which combines traditional features of a search engine with generative AI.
Speaking to CNBC’s “Street Signs Asia” on Monday, Cvetanovski, Pella Funds’ founder, chief investment officer and portfolio manager, said that Alphabet had seemingly “dropped the ball on AI over the years.”
He foresees challenges for the company as many users access Google’s search engine through Apple devices, but OpenAI announced in June that it would be integrating ChatGPT into Apple products as part of a new partnership.
“We’re wondering how that kind of plays out as well, and even if [Google] were able to fend off some of these threats, we think the cost will go up. So then there’s question marks about the margins of the company going forward,” Cvetanovski added.
Another concern he has is a potential break-up of the company in the future — and what that would entail if it happens.
“There’s considerable question marks over Google. It’s done well over the last several years. The valuation is really not cheap to cover these risks at this stage for us … So, after many years, we’ve decided to exit this company,” Cvetanovski added.
His comments come even as Alphabet’s second-quarter results met Wall Street’s expectations with earnings per share coming in at $1.89 — compared to $1.84 expected — while revenue was $84.74 billion, vs. $84.19 billion penciled.
Shares in Alphabet are up around 13% year-to-date and trade around 20.6 times forward earnings, according to FactSet data.
Year-to-date shares in Alphabet
Unlike Cvetanovski, the majority of analysts remain bullish on the stock. According to FactSet data, of the 64 analysts covering the stock, 50 give it a buy or overweight rating, while just 14 have a hold rating. Analysts’ average price target is $203.13, giving it 28.5% potential upside.
‘Core investments’
Beyond Alphabet, Cvetanovski remains bullish on other tech stocks, naming Nvidia, Vertiv, ASML, Taiwan Semiconductor Manufacturing Co and Schneider Electric as his “core investments.”
Touching on Nvidia, the chief investment officer said the chipmaker will “continue to be at the forefront” of the industry, and benefit from an investment wave into hardware.
The artificial intelligence darling continues to make headlines, with the stock up over 135% over the year to date, despite falling around 10% over the last three months.
Year-to-date shares in Nvidia
There is “a lot of concentration” in the stock, Cvetanovski said, and flagged how markets are now reacting whenever there’s news pertaining to the chipmaker.
“There’s a lot kind of riding on how well Nvidia does … If Nvidia does slip up, it could bring trouble for markets in the short-term,” he added.
Still, Cvetanovski says the stock has some “very attractive opportunities.”
“If you look at the chart of Nvidia, [it] does make you concerned, but you really have to think about what’s underlying that kind of valuation,” he said. Nvidia is trading at over 41 times forward earnings, according to FactSet data.
Of the 63 analysts covering the stock, 59 give it a buy or overweight rating, while just four have a hold rating. Analysts’ average price target is $149.49, giving it 28% potential upside, FactSet data shows.
“Nvidia is one to watch, and that will drive flow, and it will drive the markets in the short term, but medium term, I think it’s looking okay,” Cvetanovski added.
— CNBC’s Jennifer Elias contributed to this report.
Deutsche Bank Says Buy These 2 High-Yield Dividend Stocks — Including One With 13.5% Yield
Michael MarcusSep 18, 2024, 03:23 PM
Despite flying under the radar, their role in the global economy is crucial. They transport the raw materials that drive key industries, and many of these companies also offer attractive dividends. For investors, this combination makes them strong candidates for long-term portfolio growth.
And, the dry bulk segment appears to be entering a cyclical upswing. A measure of charter rates for industry’s workhorse Capesize ships has more than tripled year-over-year, rising from $9,000 per day to $28,000 per day – and the companies are returning some of that lucre to shareholders, mainly in the form of high-yield dividends.
This action has caught the attention of Deutsche Bank analyst Chris Robertson, who has initiated coverage of two dry bulk shippers with particularly notable dividend yields – up to 13.5% in one case. Robertson focuses on these two strong dividend payers, and his comments, along with the general share data gathered on the TipRanks platform, are worth a closer look.
Star Bulk Carriers (SBLK)
The first stock we’ll look at here is Star Bulk Carriers, a global shipping company that moves both the ‘major bulks’ and the ‘minor bulks.’ The first category includes such items as iron ore, minerals, and grains, while the second category includes items that are still important but in less demand, such as fertilizers, steel products, and bauxite. Star Bulk has a market cap of $2.4 billion, and at the end of last year completed an acquisition transaction with a major competitor, Eagle Bulk. That transaction, conducted in stock and worth $2.1 billion, allowed Star Bulk to consolidate its business and to become the largest dry bulk shipper traded on the NASDAQ index.
The company’s size is clear – Star Bulk operates a fleet of 161 bulk carriers, ranging in size from the relatively small (~53,000 DWT) Supramax carriers to the giant (~210,000 DWT) Newcastlemax bulkers. These vessels have an average age of just over 11 years, and the company’s ship management operations cover both commercial and technical aspects of maintenance and ops on the global dry bulk carriage trade. In an interesting note, Star Bulk earlier this month announced the sale of its oldest ship, a Capesize carrier, for a gross price of $20 million. The company expects net proceeds from the sale of $13 million, and a net gain on the vessel of $7.7 million to be recorded during 3Q24.
On the financial side of its operations, Star Bulk reported 2Q24 revenues of $352.8 million. This was up an impressive 47.8% from the prior-year period, and beat the forecast by $82.88 million. The company’s earnings, reported as an EPS of $0.78 by non-GAAP measures, missed the forecast by a nickel – but it was up significantly from the 47-cent EPS reported in 2Q23.
The company also generated substantially more cash than it did in 2Q23. For 2Q24, Star Bulk’s net cash from operations came to $142.6 million, a marked improvement over the $96.9 million in the last quarter of 2023.
Star Bulk’s recent dividend history goes back to 2021, when the company resumed payments post-COVID. In that time, the company has adjusted the dividend as needed to keep it in line with earnings. The last declaration, in the 2Q24 report, was for a payment of 70 cents per common share that was paid out on September 6. At the annualized rate of $2.80 per common share, the dividend gives a forward yield of nearly 13.5%. We should note here that, since June of 2021, the company has paid out $1.25 billion in dividends to shareholders.
Looking at this dry bulk carrier, Deutsche Bank’s Chris Robertson is impressed by the firm’s cash generation and its strong dividend, as well as its ability to grow through acquisition. He writes, “Star Bulk has one of the strongest balance sheets of any public shipping company and its dividend policy is a sector-leading example of prudent capital management which rewards shareholders across the cycle in the form of quarterly cash dividends or via sustainable and accretive fleet growth… The Company has a long history of making transformative deals using its shares as currency and we expect Star Bulk will remain an active participant in the M&A market going forward as a market consolidator.”
To this end, Robertson gives SBLK shares a Buy rating to kick off his coverage, with a $26 price target that implies a one-year upside potential of 23.5%. Based on the current dividend yield and the expected price appreciation, the stock has ~37% potential total return profile. (To watch Robertson’s track record, click here)
Overall, SBLK has a Moderate Buy consensus rating from the Street, based on 3 reviews that include 2 to Buy and 1 to Hold. The shares are priced at $21.04 and their $27.67 average price target is slightly more bullish than the Jefferies view, suggesting a gain of 31.5% in the next 12 months. (See SBLK stock forecast)
Genco Shipping (GNK)
The second dividend stock on our list today is Genco, another of the major players in the dry bulk shipping sector. Genco takes what it calls a ‘barbell’ approach to fleet composition and has put together a shipping fleet of 42 vessels, including 16 of the big Capesize carriers (bulk carriers ranging in size from 175,000 to 181,000 DWT) with the rest being smaller Supramax and Ultramax carriers (vessels approximately one-third of the dry weight tonnage of the Capesize class).
This fleet composition allows the company to transport major bulk cargoes on the larger ships, while carrying minor cargoes on the smaller vessels. It’s a strategy built around maximum flexibility, allowing Genco to benefit from both the large fees of the Capesize ships and the steadier income stream from the smaller carriers – all while maintaining a worldwide presence in the global shipping lanes.
All of this makes Genco one of the industry’s most efficient dry bulk carriers. Its fleet is modern and fuel efficient, and the company has built a reputation for meeting the highest standards of operational safety. Genco, with a market cap of $737 million, is the largest US-headquartered dry bulk shipper, and brings nearly 20 years’ experience to the shipping business. The company’s vessels make over 1,000 port calls every year.
Genco’s operations brought solid performance in its last reported quarter, 2Q24. The company’s top line, the voyage revenues, came to $107 million and beat the forecast by over $32 million while growing more than 18% year-over-year. The bottom line earnings were reported as a non-GAAP EPS of 46 cents, which was 2 cents per share ahead of expectations.
Through the full first half of 2024, Genco generated $61.3 million in net cash from operating activities, a figure that was up more than 57% year-over-year. As of June 30 this year, the company had more than $42 million in cash and other liquid assets on hand.
Turning to the dividend, we should note that Genco, on September 10, announced a new dividend calculation formula that will allow the company to pay out a higher proportion of its available cash as dividends. This new formula will be applied going forward, starting with the third quarter of this year. In the meantime, the last dividend declared was paid out on August 26, at a rate of 34 cents per common share. The annualized payment of $1.36 per share gives a forward yield of 7.9%.
Analyst Chris Robertson, in his write-up of Genco for Deutsche Bank, likes the company’s balance sheet and its available liquidity, seeing both as favorable for the long term.
“The Company has one of the strongest balance sheets in the industry, with an estimated net-loan-to-value of ~5%. It ended the most recent quarter with $42.3 MM in cash on the balance sheet and has access to liquidity of another ~$330 MM under its revolving credit facility. To note, the Company has reduced its outstanding debt by 78% since implementing its new value strategy in 2021. We believe the Company will continue to pay down debt until it reaches net-debt-zero,” Robertson opined.
It’s no surprise that Robertson follows these comments with a Buy rating on GNK, and his $22 price target shows his confidence in a 24% gain in the year ahead.
Overall, Genco’s Strong Buy analyst consensus rating is unanimous, based on 3 recent positive reviews. The shares are currently trading for $17.72 and have an average price target of $25, a combination that implies the stock will appreciate by 41% on the one-year horizon. (See GNK stock forecast)
To find good ideas for dividend stocks trading at attractive valuations, visit TipRanks’ Best Stocks to Buy, a tool that unites all of TipRanks’ equity insights.
Disclaimer: The opinions expressed in this article are solely those of the featured analyst. The content is intended to be used for informational purposes only. It is very important to do your own analysis before making any investment.