HI Market View Commentary 06-07-2021
What is the most important “thing” in relation to successful investing or trading
My most important “thing” for successful investing = TIME
My Quote of the Day: Don’t let the fear of the time it will take to accomplish something stand in the way of your doing it. The time will pass anyway; we might just as well put that passing time to the best possible use. Earl Nightingale
Time is what we want most, but what we use worst. William Penn
What is the next pandemic or risk in our markets?= Inflation
What damage has this pandemic caused? Death, Fiscal Solvency, Social Dependency on the Government, Smart/Lazy people, Lack of a work ethic,= damaged self-confidence, victim mentality, ruins the skills you had, The most debt ever in a presidency that HAS to be paid off sometime in the future
https://go.ycharts.com/weekly-pulse
| WEEK OF MAY. 31 THROUGH JUN. 4, 2021 | |
| The S&P 500 index rose 0.6% last week as May employment data showed US nonfarm payrolls had a smaller-than-anticipated increase last month, boosting expectations for the Federal Reserve to keep its easy money policies in place. The market benchmark ended the first week of June at 4,229.89, up from last Friday’s closing level of 4,204.11. At its high of the day Friday, the S&P 500 was less than 5 points below its record intraday high. This week’s move came in just four sessions as the US stock market was closed Monday for the Memorial Day holiday. The S&P 500 is now up by nearly 13% for the year to date. The Labor Department on Friday reported nonfarm payrolls rose by 559,000 in May, below the 675,000 jobs increase expected in a survey compiled by Bloomberg, though April payrolls had a small upward revision to a 278,000 increase. The unemployment rate fell more than expected to 5.8% in May from 6.1% in April. The consensus estimate had been for a 5.9% rate. The labor force participation rate, however, fell to 61.6% from 61.7% and the size of the labor force declined, signs that workers remain reluctant. The S&P 500 had declined by about 0.3% over the first three sessions of the week as investors traded cautiously heading into Friday’s jobs data amid concerns that better-than-expected jobs data could prompt the Federal Reserve to start pulling back on its easy money policies sooner than previously anticipated. The report of a smaller-than-expected jobs increase for May was thus welcome news for the market and prompted the S&P 500 to gain 0.9% in Friday’s session, sending the index into the black for the week. The energy sector had the largest percentage gain of the week, up 6.7%, followed by a 3% rise in real estate and increases of 1.2% each in financials and technology. Only two sectors ended the week in the red versus last Friday: health care, which fell 1.2%, and consumer discretionary, down 1%. The energy sector’s climb came as crude oil futures rose amid a higher demand forecast from the Organization of Petroleum the Exporting Countries. Gainers included Occidental Petroleum (OXY), up 12%, which also received an investment rating upgrade this week to overweight from equalweight from Barclays. In real estate, shares of Iron Mountain (IRM) rose 4.9% as the storage and information management services company said it is building a new 27-megawatt data center in London that will be powered by 100% renewable energy. On the downside, the health care sector’s decliners included shares of Abbott Laboratories (ABT), which shed 6.3% as the pharmaceutical company lowered its guidance for 2021 due to recent and projected declines in demand for COVID-19 diagnostic testing. The company said it continues to see strong base business growth, which excludes COVID-19 tests. The market next week will receive April consumer credit data on Monday, followed by the April trade deficit and job openings on Tuesday and April wholesale inventories on Wednesday. Thursday’s economic reports will include the May consumer price index in addition to weekly jobless claims, followed by the preliminary June report on consumer sentiment. Provided by MT Newswires | |
https://www.investopedia.com/terms/q/quietperiod.asp
Quiet Period
By
Updated Jun 5, 2019
What Is a Quiet Period?
Prior to a company’s Initial Public Offering (IPO), the quiet period is an SEC-mandated embargo on promotional publicity. This prohibits management teams or their marketing agents from making forecasts or expressing any opinions about the value of their company.
For publicly-traded stocks, the four weeks before the close of a business quarter is also known as a quiet period. Here again, corporate insiders are forbidden to speak to the public about their business to avoid tipping certain analysts, journalists, investors, and portfolio managers to an unfair advantage – often to avoid the appearance of insider information, whether real or perceived.
KEY TAKEAWAYS
- A quiet period is a set amount of time in which a company’s management and marketing teams cannot share opinions or additional information about the firm.
- The purpose of the quiet period is to preserve objectivity and avoid the appearance of a company providing insider information to select investors.
- With an IPO, the quiet period stretches from the time a company files registration paperwork with U.S. regulators through the 40 days after the stock starts trading.
- With publicly-traded companies, the quiet period is a reference to the four weeks before the end of the business quarter.
Understanding the Quiet Period
After a company files registration for newly issued securities (stocks and bonds) with the SEC, their management team, investment bankers and lawyers go on a roadshow. During a series of presentations, potential institutional investors will ask questions about the company to gather investment research. Management teams must not offer any new information that is not already contained in the registration statement. But it still offers some level of informational gathering.
The quiet period begins when the registration statement is made effective and lasts for 40 days after the stock begins trading. Its purpose is to create a level playing field for all investors by ensuring that everyone has access to the same information at the same time.
It’s not uncommon for the SEC to delay an IPO if a quiet period has been violated; interested parties take the process seriously as there’s a lot of money on the line.
The term quiet period has two references in business, one relating to an initial public offering (IPO) and one to the end of the business quarter for a corporation.
Quiet Period Violation Example
Debating the objectives of quiet periods and the SEC’s enforcement are commonplace in financial markets. When quiet periods are seen as having been violated and ultimately to have benefitted select parties, legal action is usually taken.
In a recent example, shareholders alleged impropriety regarding the quiet period surrounding Facebook’s IPO in 2012, arguing that certain information that should have been kept quiet may have been shared selectively, unfairly benefitting certain parties. Facebook’s IPO prompted more than a dozen shareholder lawsuits accusing the social networking company and its underwriters of obscuring its weakened growth forecasts ahead of the listing. Small investors complained they were at an informational disadvantage after underwriters’ research analyst supposedly passed new and useful earnings estimates to large investors only.
Where will our markets end this week?
Lower
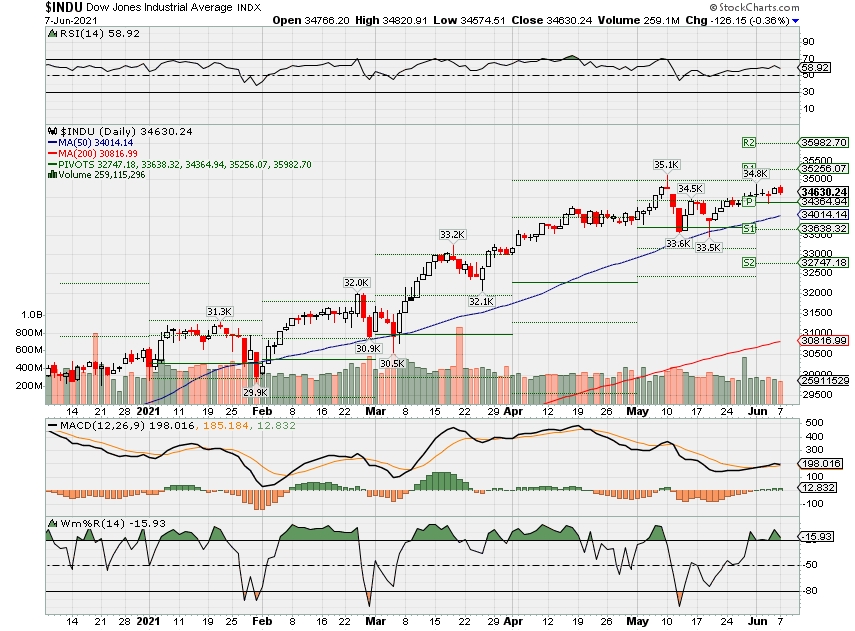
DJIA – Bullish
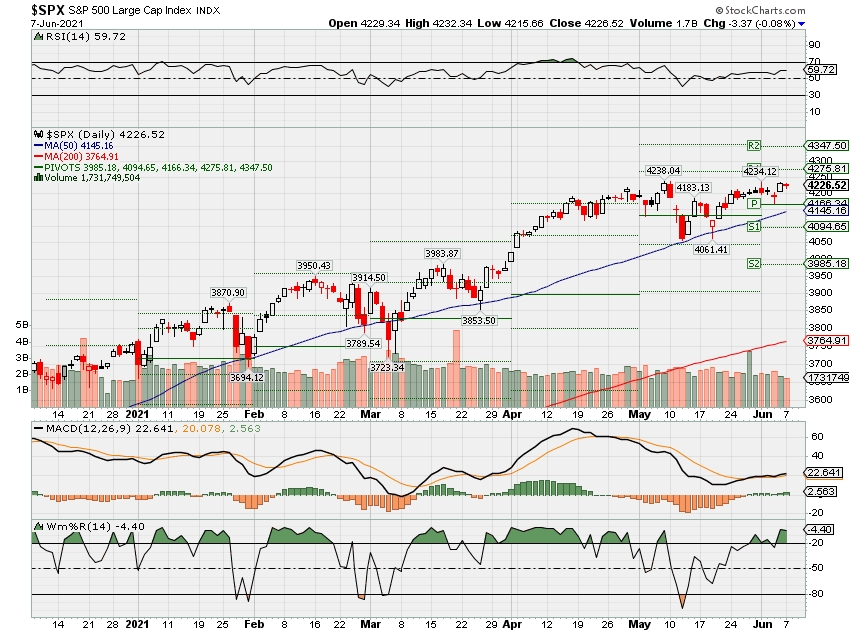
SPX – Bullish
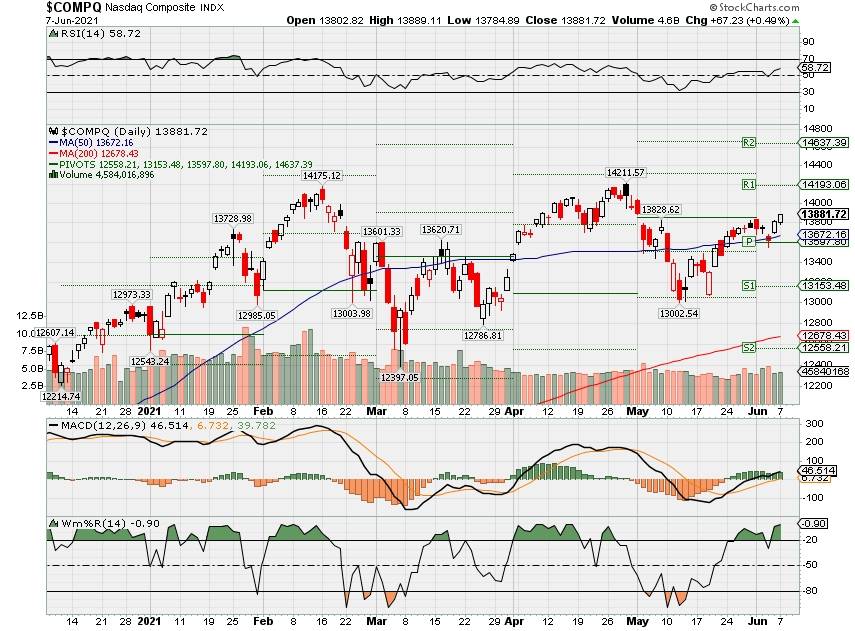
COMP – Bullish
Where Will the SPX end June 2021?
06-07-2021 1.0%
06-01-2021 1.0%
05-24-2021 4.0%
Earnings:
Mon: MRVL, MTN
Tues: NAV
Wed: CPB, GME
Thur: PLAY
Fri:
Econ Reports:
Mon: Consumer Credit
Tues: Trade Balance
Wed: MBA, Wholesale Inventories
Thur: Initial Claims, Continuing Claims, CPI, Core CPI, Treasury Budget
Fri: Michigan Sentiment ,
Int’l:
Mon –
Tues –
Wed –
Thursday –
Friday-
Sunday –
How am I looking to trade?
Looking to add monthly short calls where appropriate
www.myhurleyinvestment.com = Blogsite
customerservice@hurleyinvestments.com = Email
Questions???
Is the Fed Paying Banks Not to Lend?
The Federal Reserve has added $2.6 trillion to the US economy since the start of 2020. These actions, along with recent fiscal spending programs, have caused many economists to worry about the risks of price level inflation and overheating of the economy, potentially sowing the seeds of future economic collapse.
The Fed conducted a similar expansion after the 2008 financial crisis. From 2008 through 2015, the Fed increased the supply of base money by $3 trillion through its repeated quantitative easing (QE) programs. Yet despite this massive expansion, the rates of inflation and GDP growth consistently undershot the Fed’s target for more than a decade.
One potential reason for the lack of economic activity is that the Fed is preventing economic growth by paying banks not to lend. Since late 2008, the Fed has paid interest on the excess reserves that banks hold at the Fed. If the Fed pays a high enough rate of interest on excess reserves (IOER), then banks may choose to hold the newly-created money as excess reserves rather than lending it out into the economy.
Economists remain highly divided about the economic effects of IOER. I examined the evidence in a recent paper published in the Journal of Macroeconomics (available for free download until July 14th). I found that the Fed’s IOER policy accounts for the majority of the decline in bank lending in the decade following the financial crisis.
The Fed’s new operating system
At the peak of the financial crisis in late 2008, the Fed witnessed collapses in both the banking system and the broader economy. Despite access to emergency liquidity from the Fed, many banks stood on the brink of failure. Emergency lending had vastly increased the supply of money in the economy, as would the Fed’s upcoming large scale asset purchases. The Fed wanted a way to sterilize these monetary injections to minimize future inflation.
To address these problems, in October of 2008 the Fed started paying interest to banks on their excess reserves.
With this policy, the Fed saw a way to prevent bank failures and limit inflation, effectively killing two birds with one stone. First, the Fed was fortifying bank balance sheets by buying their risky mortgage-backed securities and replacing them with safe, liquid reserves. Second, paying IOER effectively sterilized the monetary injections from Fed’s emergency lending and QE programs. By paying banks to hold more reserves, the Fed could prevent the newly-created money from spreading to the rest of the economy and inflating the price level.
IOER and bank reserves
In some ways, the IOER policy worked as expected. Banks massively increased their reserve holdings. Figure 1 shows the total excess reserves held at the Fed, which increased from close to zero in early 2008 to more than $2.5 trillion by 2014. With each round of QE, the majority of funds were absorbed as excess reserves, effectively sterilizing these injections from affecting spending or inflation.
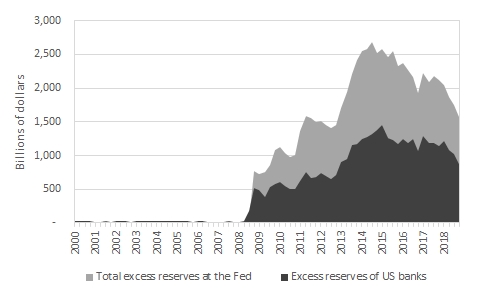
Figure 1. Excess reserves in the banking system
Some effects of IOER, however, were not as expected. The rate of IOER was expected to act as a floor or lower bound for the federal funds rate and other short-term, risk-free interest rates. But, as soon as IOER was introduced, the fed funds rate and other short-term rates fell through this supposed floor. Rather than cutting the IOER rate to match market interest rates, the Fed made this policy official by adopting a new target range for the fed funds rate with the rate of IOER being the upper bound of the range. In other words, the Fed began paying a rate of IOER that was higher, rather than equal to, short-term market interest rates.
Another effect that remains controversial is the relationship between excess reserves and bank loans. In theory, if the Fed pays a rate of IOER that is equal to short-term market interest rates, then banks should be indifferent between these assets. In this case, IOER would have no effect on bank balance sheet allocations. However, since the Fed was paying IOER that was higher than comparable market rates, banks used the new reserves as substitutes for other assets.
Some economists predicted that the banks would accumulate excess reserves in place of other short-term, liquid assets like fed funds or US Treasuries. But the high rate of IOER made excess reserves more attractive, even relative to other assets like bank loans. Figure 2 shows that the decline in loans as percentages of bank assets was almost fully offset by an increase in excess reserves.
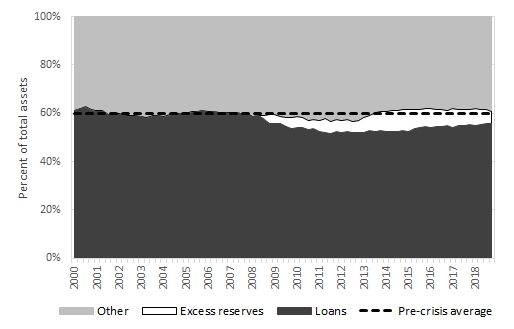
Figure 2. Loans and excess reserves as percentages of bank assets
IOER and bank lending
It seems clear from Figure 2 that bank loans and reserves were inversely related. As banks’ reserve holdings increased after 2008, their loan holdings went down. But how much of this shift was caused by the rate of IOER compared to other factors, like banks’ need for safe assets or the lack of loan demand?
My recent paper, “Bank lending and interest on excess reserves: An empirical investigation” seeks to address this question. I used data on US banks from 2000 through 2018 to test how lending responded to changes in the rate of IOER. Accounting for other factors, such as changes in regulation, loan demand, and economic activity, I found the higher rates of IOER have strong negative effects on banks’ loan allocations.
Using these results, I was able to estimate how much banks would have allocated to loans if the Fed had not paid high rates of IOER. If the rate of IOER had been left at zero, I estimate that lending would have declined slightly in 2009, but it would have recovered more quickly thereafter. In total, the results indicate that the Fed’s IOER policy accounts for 63.9 percent or more of the decline in bank lending after the financial crisis.
The evidence shows that banks treated excess reserves as a profitable alternative to loans. High rates of IOER caused them to increase reserve holdings and decrease their loan allocations. The Fed was indeed paying banks not to lend.
10 Things No One Tells You About Early Retirement
The reality of quitting work can be far different from the fantasy. Here’s what you need to know
by John Waggoner, AARP, June 1, 2021

Even if you love your job, there are times when you’d rather be alphabetizing the spice shelf than riding a packed train alongside hundreds of sniffling fellow commuters. And as you sway in the car next to a man who has biked four hours to the station, you might be thinking about early retirement.
Unfortunately, early retirement isn’t for everyone. In fact, it isn’t for most people. Just 11 percent of today’s workers plan to retire before age 60, according to an Employee Benefit Research Institute (EBRI) survey. For many of those who do take the plunge, the reality of early retirement can turn out to be far different than the fantasy. Here are a few things to consider before you decide to retire early.
1. Health care is expensive
Medicare, the federal program that provides health coverage for more than 61 million older Americans, doesn’t start until age 65. Until then, you’ll need an alternative — and it won’t come cheap.
“Private health insurance before Medicare kicks in costs an arm and a leg,” says Brian Schmehil, director of wealth management for the Mather Group in Chicago. Current law says your insurance costs can’t be more than 8.3 percent of your household income. For a person with a household income of $50,000, for example, a mid-level silver plan would be $346 a month, or $4,150 per year.
2. Tapping your nest egg early can be costly
If you retire before 59 1/2, you’ll usually pay a 10 percent early withdrawal penalty from most tax-deferred accounts, such as traditional IRAs and 401(k) plans. “There are some options for getting IRA money before 59 1/2, but it’s tricky and can cause major penalties if done incorrectly,” says Matt Stephens, founder of AdvicePoint in Wilmington, North Carolina.
And unless you have a Roth IRA, which is funded with after-tax contributions, you’ll owe income taxes on the amount you withdraw from traditional accounts funded with pretax contributions. If, for example, you withdraw $20,000 from an IRA before age 59 1/2 and are in the 15 percent federal tax bracket, you’ll pay $5,000 in taxes and penalties, leaving you with $15,000.
3. You sacrifice the power of compounding interest
Time is your friend when you are saving for retirement, but not when you are spending. If you sock away $250 a month — $3,000 a year — from age 25 to age 55, you’ll have about $237,000 when you retire, assuming you make no withdrawals and earn an average 6 percent annually on your investments. Seemingly not a bad return on your $90,000 in contributions.
But let’s say you work 10 more years and retire at 65. In that scenario, you’ll have about $464,000, nearly double. Why? The extra decade’s worth of contributions helps, but that only adds up to $30,000. The real growth comes from another 10 years’ worth of interest earned not only on all the principal you contributed but also the interest earned on the interest that has compounded for four decades.
4. You may have a long, long life ahead of you
A woman who retires at 55 will have to make her savings last for 28.6 years, on average, compared to 20.4 years if she retires at 65. A man who retires at 55 will have to stretch his savings for 25.1 years, rather than 17.8. And for couples who make it to 65, there’s a 25 percent change that the surviving spouse lives to 98, according to the Society of Actuaries.
“With improved health care, many people are living longer than the national averages,” says Angela Dorsey, a certified financial planner in Torrance, California.
5. You’ll spend more money than you think
A typical rule of thumb is that you’ll spend about 80 percent as much in retirement as you do when you work. After all, you won’t be shoveling money into your retirement account, commuting every day and, for that matter, paying Social Security payroll tax, assuming you have no more earned income. But at least in the early years of retirement, when you’re younger, healthier and newly freed from the constraints of work, you could very well spend as much as or more than you did before retirement. A J.P. Morgan Asset Management study found that there tends to be a “spending surge” by new retirees on travel, home renovations or relocation, and other retirement-related lifestyle changes that levels off after two or three years.
“Every day is Saturday,” says Sean Pearson, a certified financial planner in Conshohocken, Pennsylvania. “Once you don’t work, you wake up and look for things to do — basically, how we all feel on Saturday. Some things might be fun and social. Some things might be work around the house. Most things cost some money, which is why Saturday is often the most expensive day of your week.”
6. Housing expenses don’t retire when you do
Retiring without a mortgage is a common goal for would-be retirees, but it’s a goal that many fail to meet. According to an American Financing survey, 44 percent of retired homeowners between ages 60 and 70 still carry a mortgage.
Even if you have paid off your mortgage, other expenses don’t go away. “Home maintenance and increasing property taxes can take up a large chunk of your budget,” says Dorsey, the California financial planner. MarketWatch reports that the average homeowner paid $3,719 in property taxes in 2020, up 4.4 percent from 2019. As a rule of thumb, homeowners should set aside 1 percent of a home’s purchase price annually to cover repairs and replacement. That’s $3,500 per year on a $350,000 house.
7. Extra income can be hard to come by
Working in retirement might not be as simple as you think. While 74 percent of workers plan to work for pay in retirement, according to the EBRI study, just 27 percent of actual retirees reported working for pay. Even part-time work can be a challenge. “One thing early retirees don’t seem to realize is that if they are planning on doing traditional part-time work while retired, those jobs require a commitment to a schedule that sometimes is not very flexible,” says Leslie Beck, a certified financial planner in Rutherford, New Jersey. “This can cut into other retirement goals such as travel or visiting with family. I have had retirees surprised by the inflexibility of part-time work.”
If you figure you’ll instead fill the income void with Social Security, remember the earliest you can usually claim retirement benefits is age 62. Even then, you’ll only receive partial benefits. For anyone born in 1960 or later, the full retirement age, when you are entitled to 100 percent of your monthly benefit, is 67. By claiming early at 62, the benefit amount is reduced by 30 percent.
5 questions to ask (and answer) before retiring early
- Can I really afford to stop working?
- Do I need to get a part-time job to make ends meet?
- How will I get health insurance?
- What will I do to occupy my time?
- Are my plans in sync with my spouse/partner’s?
8. There’s a lot of time to kill
When you retire, you have a 40-hour gap in your week that you need to fill. “Are you sure you have enough activities to keep your body, mind and spirituality occupied for the many years you have ahead of you?” asks Catherine Valega, a certified financial planner in Winchester, Massachusetts.
How much time do you realistically see yourself spending going on long walks, lounging poolside or curling up on the couch with a good book, especially after the novelty wears off? Think hard and think long term before you retire. Do you want to volunteer? Go back to school? Pick up a new hobby or resume an old one? Come up with a plan in advance of retirement.
9. You may need to make new friends
If you retire in your 50s, you may find that your current friends aren’t around much — because they still have full-time jobs. While you have the luxury of catching a matinee or playing a round of golf midweek, those in your social circle who are working nine-to-five don’t.
If you find new friends, they are likely to be older, says Dennis Nolte, a certified financial planner in Oviedo, Florida: “Many of my pre-60-year-old retirees, especially those who are active, lament that their new peer group is significantly older than they are — and thus have a different set of expectations about diet, sleep schedule, even cultural references.”
10. Retirement can be tough on couples
“Retirement is a major life transition, and you have to be patient with yourself and your spouse,” says Patti Black, a certified financial planner in Birmingham, Alabama. “Most retired couples do not look like those pictured in ads and commercials.” You’ll have to decide how work around the house will change. Will you really share cooking, cleaning and yard work? And do you honestly want to be together 24-7, particularly if you downsize to a smaller home?
These decisions can have serious consequences for a marriage. “Gray divorce, or divorce after age 50, has doubled since 1990 while declining across all other age groups,” Black warns. “And it is most often the wife who asks for divorce after age 50.”
John Waggoner covers all things financial for AARP, from budgeting and taxes to retirement planning and Social Security. Previously he was a reporter for Kiplinger’s Personal Finance and USA Today and has written books on investing and the 2008 financial crisis. Waggoner’s USA Today investing column ran in dozens of newspapers for 25 years.
Wall Street should brace for ‘larger than normal price swings,’ PNC’s chief investment officer warns
Stephanie Landsman@STEPHLANDSMAN
A top investor expects volatility to dominate Wall Street for months.
Amanda Agati, PNC Financial’s chief investment officer, lists stretched market valuations, Federal Reserve taper chatter and the end of stimulus checks as troubling forces.
“You have to pick and choose your exposures very, very carefully,” Agati said on CNBC’s “Trading Nation” on Thursday. “This is not a scenario where we think there’s a rising tide that lifts all boats — certainly not at such elevated valuation levels for both equities and fixed income.”
A major portion of her forecast includes an “unusual” volatility dynamic affecting both stocks and bonds right now.
According to Agati, the CBOE Volatility Index, or VIX, which is considered the market’s fear gauge and reflects future volatility over a monthly time span, is back to its historical average. But she notes all contracts are still higher than January 2020, before the pandemic hit the United States.
Meanwhile, Agati is finding the bond market’s equivalent of the VIX, the Merrill Lynch MOVE Index, is sitting at spring 2020′s highs.
Agati warns the two trends spell bigger price swings ahead.
“We’re likely to see larger than normal price swings,” said Agati, who has $175 billion in assets under management.
She sees Federal Reserve policy as the biggest overall risk to the markets.
“I don’t really believe that inflation is the key risk in terms of the path forward for the markets,” Agati said. “We actually think it’s that five-letter word that we’ve started to hear some Fed governors utter more recently, and that is ‘taper.”’
A warning for Reddit traders
Agati expects that as stimulus checks cease, highly speculative trades driven by the Reddit rebellion, including those of AMC Entertainment and GameStop, will unwind by summer’s end.
“It’s a friendly reminder that the markets have been really propped up by a lot of policy accommodation and stimulus over the course of the pandemic,” said Agati. “We have a fiscal cliff coming in September, and so I think that will change the game pretty meaningfully for small cap value exposures at that time.”
For the most reliable gains, she’s advising investors to consider going abroad. Agati finds emerging markets attractive. She continues to own and add exposure to the area.
“It’s a nice hedge against an inflationary backdrop,” she said. “If you zoom out and look at the longer-term growth prospects, it’s the brightest star in the equity asset class universe, definitely growing — from an economic and earnings perspective — from a much higher base relative to the rest of the developed world.”
Agati’s volatility forecast may not include an official market correction warning, but it’s something that clearly concerns her.
“When you look at historical analysis and data, we’re long overdue for a meaningful correction, and last time we saw it on the S&P 500 was September of last year,” Agati said.
As of Thursday’s close, the S&P 500 and Dow are 1% and 1.5%, respectively, off their all-time highs. The tech-heavy Nasdaq is down 4% from its record high.
Robert Shiller: ‘Wild West’ mentality is gripping housing, stocks and crypto
Stephanie Landsman@STEPHLANDSMAN
Nobel prize-winning economist Robert Shiller is worried a bubble is forming in some of the market’s hottest trades.
He’s notably concerned about housing, stocks and cryptocurrencies, where he sees a “Wild West” mentality among investors.
“I haven’t done that in print. I’ve been saying that,” the Yale University professor told CNBC’s “Trading Nation” on Friday.
Even though the record run in stocks and cryptos has been taking a break over the past couple of weeks, Shiller is worried. He’s particularly uneasy about the latest housing boom.
“In real terms, the home prices have never been so high. My data goes back over 100 years, so this is something,” said Shiller, co-founder of the S&P CoreLogic Case-Shiller home price index. “I don’t think that the whole thing is explained by central bank policy. There is something about the sociology of markets that’s happening.”
Over the past three decades, Shiller finds home prices seem to be driving housing starts. He’s seeing the pattern emerge again, and highlights it in a special chart.
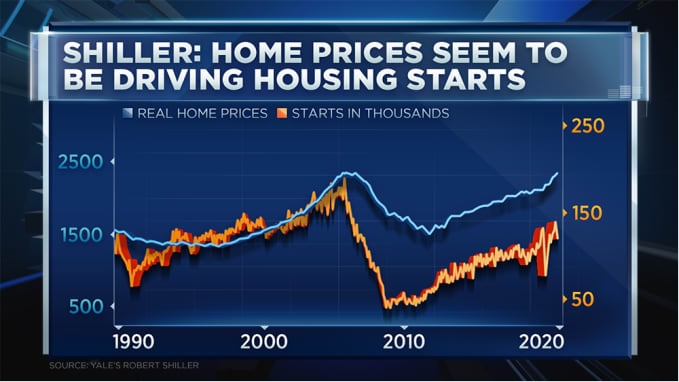
“We have a lot of upward momentum now. So, waiting a year probably won’t bring house prices down,” Shiller said.
According to Shiller, current home price action is also reminiscent of 2003, two years before the slide began. He notes the dip happened gradually and ultimately crashed around the 2008 financial crisis.
“If you go out three or five years, I could imagine they’d [prices] be substantially lower than they are now, and maybe that’s a good thing,” he added. “Not from the standpoint of a homeowner, but it’s from the standpoint of a prospective homeowner. It’s a good thing. If we have more houses, we’re better off.”
Shiller, an expert in how our emotions drive financial decisions and author of “Narrative Economics: How Stories Go Viral and Drive Major Economic Events,” also sees mass psychology playing a big role in the epic stock market rebound.
Since the March 2020 low, the S&P 500 and Dow are up almost 90% while the tech-heavy Nasdaq is up just over 100%.
Shiller, who viewed stocks as highly-priced going into the year, warns inflation fears could ultimately push long-term assets lower.
Crypto’s ‘ultimate source of value is so ambiguous’
The cryptocurrency market is putting Shiller on alert, too.
“That’s a very psychological market. It’s impressive technology,” Shiller said. “But the ultimate source of value is so ambiguous that it has a lot to do with our narratives rather than reality.”
Even Shiller has been tempted.
“I was thinking of buying them to experience the effect. A lot of people do that actually,” he said. “I never bought bitcoin. Maybe I should be active in that market.”
Based on bitcoin’s latest wild swings, some of the enthusiasm may be evaporating. As of Friday’s close, it’s down more than 30% over the past two weeks.
Here’s the average net worth of Americans ages 75 and up
Net worth tends to peak in retirement and decrease for people ages 75 and up.
The most recent Survey of Consumer Finances released by the Federal Reserve shows the median U.S. household net worth is $121,700. But for older Americans, it’s more than double that amount.
According to the Fed data, the median net worth peaks between ages 65 and 74 and then falls when retirees enter their late 70s and beyond. Americans ages 75 and up have a median net worth of $254,800. The average, which skews higher thanks to high net worth households, is $977,600.
Most people’s net worth starts to decrease during their non-working years. This decline is not surprising, given that most people live on a fixed income during retirement (usually a combination of social security and investment distributions). Retirees should therefore make sure they have enough resources to last through their golden years.
Even better is to get an early start by saving and investing as soon as you start making money. Earning potential tends to peak in the decades leading up to retirement, according to salary data insights company Payscale. Data shows that women reach their peak earnings at the age of 44, earning on average $66,700, and men reach their peak earnings at the age of 55, earning on average $101,200 (not accounting for other variables like race and education level).
Here’s a look at the average and median net worth by age in the U.S., according to the Fed.
Household net worth by age
| Age of head of family | Median net worth | Average net worth |
| Less than 35 | $13,900 | $76,300 |
| 35-44 | $91,300 | $436,200 |
| 45-54 | $168,600 | $833,200 |
| 55-64 | $212,500 | $1,175,900 |
| 65-74 | $266,400 | $1,217,700 |
| 75+ | $254,800 | $977,600 |
How net worth is calculated
Net worth refers to the total value of assets you own minus any liabilities or debts.
Net worth = assets – liabilities
In its study, the Federal Reserve lists several kinds of assets, including:
- Cash within bank accounts, such as checking, savings, money market accounts, etc.
- Prepaid debit cards
- CDs and savings bonds
- Government bonds
- Health savings accounts
- Investment accounts including 529 college savings plans and individual taxable investment accounts
- Retirement accounts, including IRAs, 401(k)s and 403(b)s
- Life insurance policies with cash value
- Annuities with equity
- Vehicles including cars, RVs, motorcycles, boats and helicopters
- Real estate, including rental homes and primary/residential homes
In calculating net worth, liabilities (aka debts) get subtracted from the value of assets amount. In the Fed’s survey, debts included:
- Mortgages
- Home equity lines of credit or home equity loans
- Credit card balances
- Installment loans, including personal loans, auto loans and student loans
How to track net worth
While it’s not necessary to obsess over net worth, you should start tracking it early so you have enough money in retirement.
Personal Capital is a free investing and budgeting app that makes tracking net worth easy. The app lets users easily see all their financial data, including all linked assets and liabilities, in one place.
Users also get access to Personal Capital’s free retirement planner tool where they can decide how much they need to retire (and at what age), then track their savings. Read Select’s full review of Personal Capital.
Why net worth is important during retirement
The amount you save up for retirement becomes your income after you no longer earn a paycheck, making net worth a critical factor in how well you live.
According to retirement-plan provider Fidelity Investments, people should have the equivalent of 10 times their income put aside by age 67 to have a comfortable retirement. Based on the U.S. Bureau of Labor Statistics’ median American earnings data, this equates to roughly $514,280. However, it’s impossible to predict what the economy will be like exactly, so a safer bet is to aim for more (some say as much as $1 million) if you want to be as worry-free as possible when you age.
Yet the reality is that most Americans retire with less than $1 million in the bank. In particular, women currently are behind on retirement savings compared to men.
The rule of thumb suggests that retirees should withdraw no more than 4% of their investments annually to cover everyday costs.
A person with $977,600 in a brokerage account could therefore withdraw $39,104 per year to live on according to the 4% rule. What’s left over would stay in the stock market to continue earning year over year. A 75-year-old with the median net worth of $254,800 in a retirement account could hypothetically withdraw $10,192 per year according to this rule, or $849.33 per month.
But most people have more than $849 in monthly expenses, even if they’ve paid off major expenses such as a mortgage or vehicle. And $849 doesn’t begin to cover variable costs like medical bills and home repairs, let alone extras like vacations, birthday gifts, etc. That’s why building your net worth early is important.
https://www.briefing.com/the-big-picture
The Big Picture
Last Updated: 28-May-21 14:07 ET
Treasury market still working with friendly inflation hypothesis
Well, here we are again, talking about inflation. How could we not be?
In the last 24 hours, this happened:
- Costco (COST) CFO Richard Galanti said on the company’s earnings conference call that “inflationary factors abound,” and include higher labor costs, higher freight costs, higher commodity costs, and higher food costs.
- The PCE Price Index — the Fed’s preferred inflation gauge — was shown to be up 3.6% year-over-year in April versus 2.4% in March.
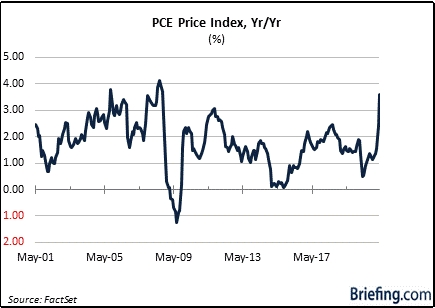
- The final reading for the University of Michigan’s Index of Consumer Sentiment for May showed the highest expected year-ahead inflation rate of 4.6%.
You know what the Treasury market did with that noisome whiff of inflation right below its nose? We’re not sure if it came down with Covid, but it seemed to lose its sense of smell.
The yield on the inflation-sensitive 10-yr note went down — not up — with that inflation information at its disposal. So, here we are again, trying to explain why the Treasury market took a counter-intuitive turn.
High Prices May Be Their Own Solution
Inflation is hitting home for consumers. It’s not just a figment of the imagination.
The summary of the University of Michigan’s Index of Consumer Sentiment for May notes, “Record proportions of consumers reported higher prices across a wide range of discretionary purchases, including homes, vehicles, and household durables — the average change in May vastly exceeds all prior monthly changes.”
Home prices in particular are going through the roof. In April, the median existing home price for all housing types increased 19.1% year-over-year to a record $341,600. The median new home sales price increased 20.0% year-over-year to $372,400.
That is great news if you are selling a home, but not such great news if you are buying a home.
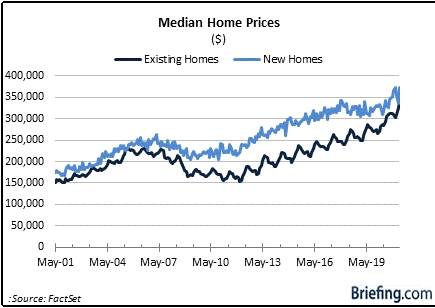
High prices create affordability pressures, which in turn hurt demand. As it so happens, existing home sales declined 2.7% month-over-month to a seasonally adjusted annual rate of 5.85 million. New home sales declined 5.9% month-over-month to a seasonally adjusted annual rate of 863,000.
To be fair, supply — or the lack thereof — was a factor in crimping home sales, but with median prices going up at a much faster rate than income, it’s safe to say price was also a factor in the monthly declines.
Ironically, high prices may just be the solution for tempering the outsized price increases in the housing market. That is, high prices themselves could kill demand — not entirely, but enough to cool down the price increases to a significant degree, particularly in the market for existing homes. Builders can take a more calculated approach to curbing new supply since they effectively control the supply.
Taking a “Peak” at Things
What happens in the housing market or what some think may happen — high prices killing demand and inviting lower prices or a much slower pace of price appreciation — is a microcosm perhaps of what the Treasury market is thinking about inflation.
It’s a different take on the “peak growth” narrative.
For the stock market, “peak growth” means peak economic growth and peak earnings growth, which by default invites an assumption that there will be a slower pace of growth for both very soon and a reduced willingness to pay premium multiples for stocks with lower growth prospects.
For the Treasury market, it is presumably looking at “peak growth” for inflation, anticipating more palatable readings in the months ahead. That view enables it to hold its nose now at the noisome whiff of inflation pressures. That is precisely how Fed Chair Powell would like the Treasury market to think about things, too.
What It All Means
The reaction by the Treasury market to the eye-opening inflation reports of late has been counter intuitive. Longer-duration bonds have been bought (sending yields lower) following those reports. The supposition is that there is a school of thought that inflation is going to be its own cure.
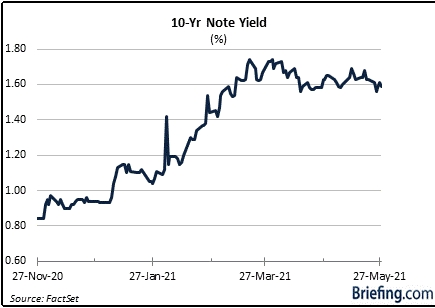
High prices get tolerated for a time, but eventually consumers and businesses will balk at paying the high prices. That in turn will temper demand, which presumably will lead to more supply and a moderation in the price pressures, aided as well by an easing of the supply bottlenecks that are contributing to current inflation.
This is a theory that has yet to be proven, but it resonates as a consideration for why longer-dated securities have not been sold in earnest even though consumer and producer prices have been rising in earnest.
It’s part of the “transient” theory, which hasn’t been proven yet either but seems to be registering as the Treasury market’s working hypothesis.
—Patrick J. O’Hare, Briefing.com
(Editor’s Note: The next installment of The Big Picture will be published the week of June 7.)
HI Financial Services Mid-Week 06-24-2014