HI Market View Commentary 12-14-2020
| Market Recap |
| WEEK OF DEC. 7 THROUGH DEC. 11, 2020 |
| The S&P 500 index fell 0.96% last week, taking a step back from its recent record highs and capping its latest win streak at two weeks, amid a continued rise in COVID-19 cases and higher-than-expected weekly jobless claims. The market benchmark ended Friday’s session at 3,663.46, down from last week’s closing level of 3,699.12. The index set a fresh intraday record Wednesday at 3,712.39 after posting a new record close Tuesday at 3,702.25, but moved lower Thursday and Friday after the Labor Department’s weekly jobless data missed expectations. The declines were led by real estate, which fell 1.9%, followed by a 1.1% drop in financials and a 1.7% decline in technology. All but one sector fell this week; energy climbed 3.6%, bucking the downward trend as crude futures rose. The activity came as investors grappled with new records continuing to be set for COVID-19 cases in the US, where the daily death toll hit yet another record this week. The market has largely looked past the escalating case levels in recent weeks, instead focusing on progress on the vaccine front. The US appears ready to approve its first COVID-19 vaccine after a special Food & Drug Administration panel recommended its broad distribution Thursday. The FDA is expected to make a decision on the emergency use authorization in the coming days, the vaccine’s developers – Pfizer (PFE) and BioNTech (BNTX) — said Thursday. Concerns, however, were revived as the Labor Department reported seasonally adjusted claims rose by 137,000 in the week through Dec. 5 to 853,000, well above the consensus estimate according to Econoday of 724,000. Claims for the previous week were also revised higher. The real estate sector’s decliners included Simon Property Group (SPG), which received a debt rating downgrade this week from Fitch Ratings while the firm said it has a negative rating outlook on the stock. The new rating is A-, down from A. The downgrade reflects the firm’s view that Simon’s credit metrics “will remain weakened by both the stress on its department store and apparel retailer tenant roster and the majority debt-funded Taubman transaction,” Fitch said. Shares fell 6.4% on the week. In the technology sector, shares of chipmakers Intel (INTC) and Nvidia (NVDA) fell amid reports the companies received letters from US lawmakers seeking details on the sale of advanced computer chips that were allegedly used by China to conduct mass surveillance on Uighur Muslims in the country’s Xinjiang region. Shares of Intel fell 4.3% this week while Nvidia shed 4%. On the upside, Occidental Petroleum (OXY) shares rose 12% on the week as the company upsized its previously announced cash tender offers and consent solicitations for some senior notes. Goldman Sachs raised its price target on the stock to $18.25 from $11. Next week, the economic calendar features the Tuesday release of November import prices and industrial production, Wednesday reports of November retail sales and October business inventories, and the Thursday release of weekly jobless claims. November housing starts and building permits are also due Thursday. Provided by MT Newswires. |
S.M.A.R.T. GOALS – A must read
As a Registered Investment Adviser I’ve heard two questions over and over again in the last couple of weeks.
What do you think the market will do in 2021? – What are your goals for 2021?
LET’S TALK ABOUT GOALS !!!
Both questions are intertwined and here is my “two cents”. I believe more people will lose money in 2021 as they set their primary goal to make back EVERYTHING they lost in 2020. Ego loses people money just as easily as fear and greed. There are no guarantees in the market and there is no proof the market will bounce back next year. It would be great to make back everything you’ve lost but a profit is still a profit. You don’t go broke by taking profits! You don’t go broke by collar trading! I would hate to see anyone in the market think they know more than the market does and try to outguess the market. It just doesn’t make any sense at all to put on risky trades to make back what you’ve lost in a week, month or last year? Let me introduce you to the idea behind being S.M.A.R.T. in your goal setting.
- S. – Simple, Specific, Schedule – Keep it simple stupid just like old acronym says – KISS. Set a simple return just like you set your primary exits in your trade. Decide on a specific amount (I will talk about this later) and write it down. Schedule it in your planner! Remember your schedule is to make that return over a year’s period not in the month of Jan or in the first half of the year. Make sure you see your goal on a daily basis as you check you schedule on a daily basis.
- M – Measurable – Most people set what is called a “pinpoint” goal. We might decide that we want to make a simple market average return of 7% in a 1 year period. What happens in real life? We hit the goal and then we Quit or Stop trying as hard. Set a range goal. Maybe you always want a minimum return of 7%ish so set your goal to be between 7% to 20%. On the bullish years 7% is easy so I set a goal so If you do make it you still have something to shoot for.
- A – Attainable – Make a plan to how you will attain your goals. Start this step by asking yourself what or who do you want to become? ie… a better trader, a full time trade, a stay at home dad, a millionaire. Too many people at the start of every year write down a wish list not a goal. I wish at the end of the year I can make this amount of money or lose this amount of weight. How will you do it and what will you do to get there? How much of your portfolio will be safe in collar trades? How much will be pure option strategies? How much will you use for vegas trades? Will you use margin to reach your goals? Figure out the details to how you will get to where you want to be at. Start with the end of the year goal on Dec 31st and walk yourself backwards.
- R – Realistic, Relevant – I always want to make a 50% return or more. Some years like this past year I was quite close to being at that goal. What happens in real life? We are nowhere close to our goal and we quit. We give up on the whole thing because we will never hit the goal. Step by step progression in trading is fine and make sure your goals remain relevant throughout the whole year. Don’t forget goals can be adjusted like a trade that may go south. S&P Ave 7.74
- T – Time – Set the time period that you want to accomplish your goals. Set short term, intermediate, long term, and life-long goals you want to reach and hold yourself accountable. Let others know the time period you expect to reach your goals and get the support needed to get there. Whether it is between you and your spouse, your kids, your parents, your education program or maybe the good Lord himself, find support during the tough times. I promise you they will come.
Conservative Trades (Perhaps 70% of your portfolio):
Cash or T-Bills –
Collar Trades –
Protective Puts (also known as Married Puts) –
Covered Calls with Long puts or DITM
Equities –
Medium Risk Trades (Perhaps 20% of your trades):
Bull Put –
Put Calendar –
Call Calendars –
Straddles / Strangles as a volatility play –
Put and / or Call Ratio Backspreads –
Winged Spreads –
Bull Calls (standard application) –
Bear Puts (standard application) –
Straddle / Strangle
Bear Calls –
High Risk Trades (Perhaps 10% or less):
Long Calls or Long Puts (as a non-hedged directional trade) –
Naked Short Put –
Naked Short Call – NEVER DO THIS UNLESS YOU ARE WILLING TO RISK AND LOSE EVERYTHING
Vegas Trades (Outside the box trades) –
New equity positions for 2021 that I am looking at – WMT, ALK, PYPL, SQ, CCL, RCL, MGM, SBUX
I still like my favorites – AAPL, BIDU, BAC, BA, DIS, F, V, & UAA is “still” my wildcard
For smaller accounts following the SPY, QQQ, DIA, F, UAA, Leaps
Where will our markets end this week?
Higher
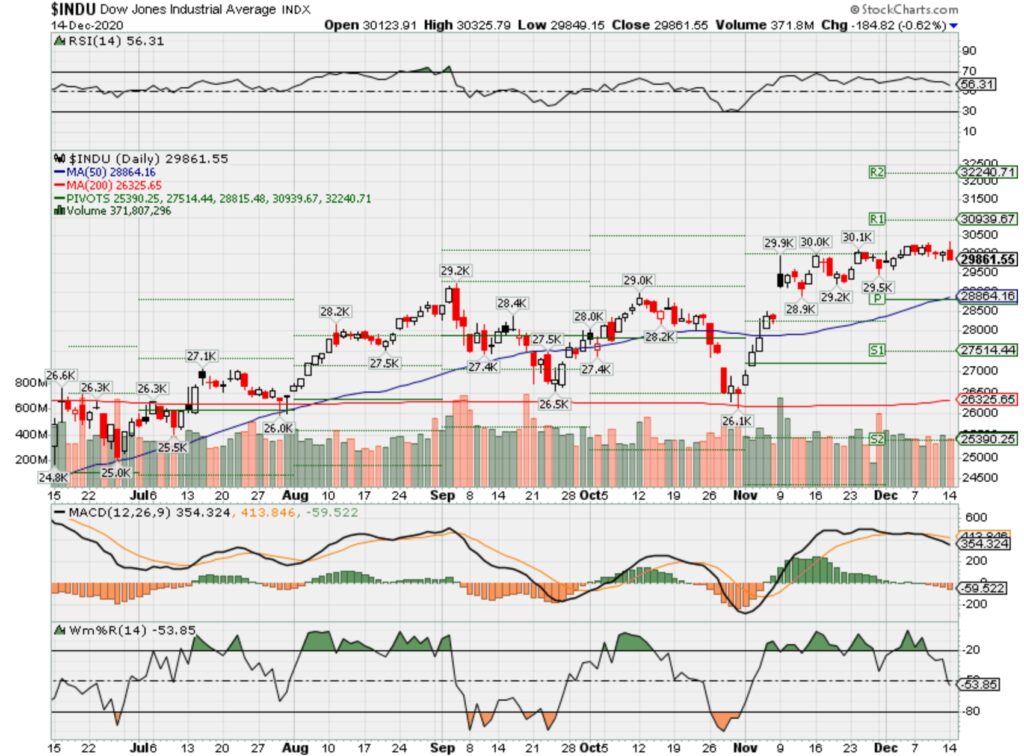
DJIA – Bullish
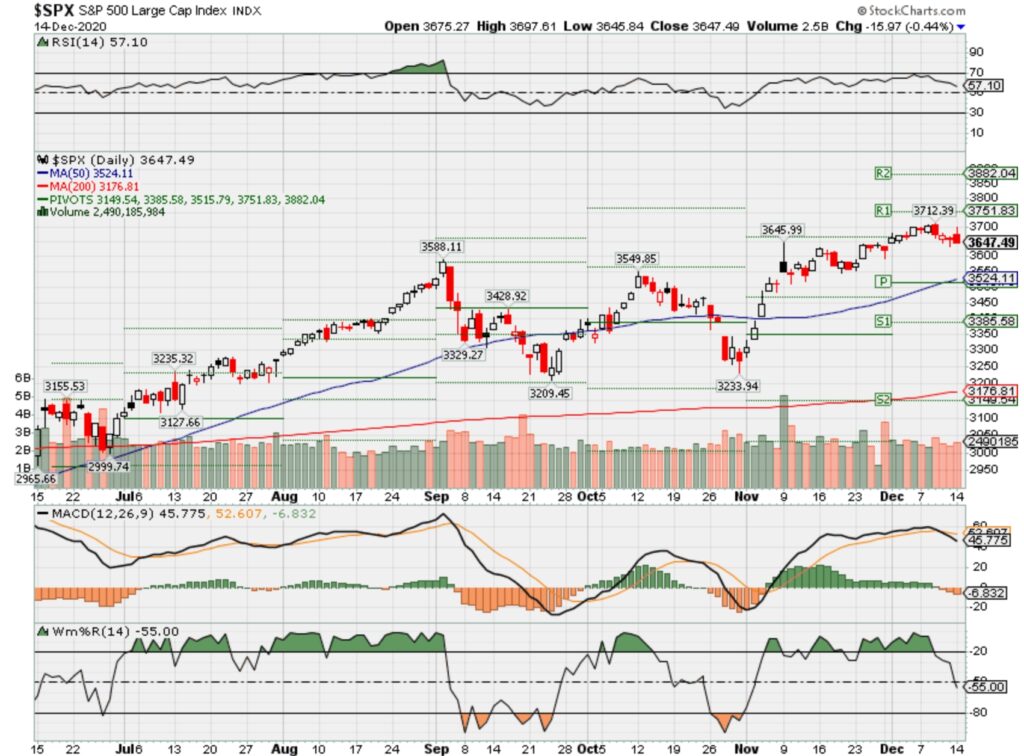
SPX – Bullish
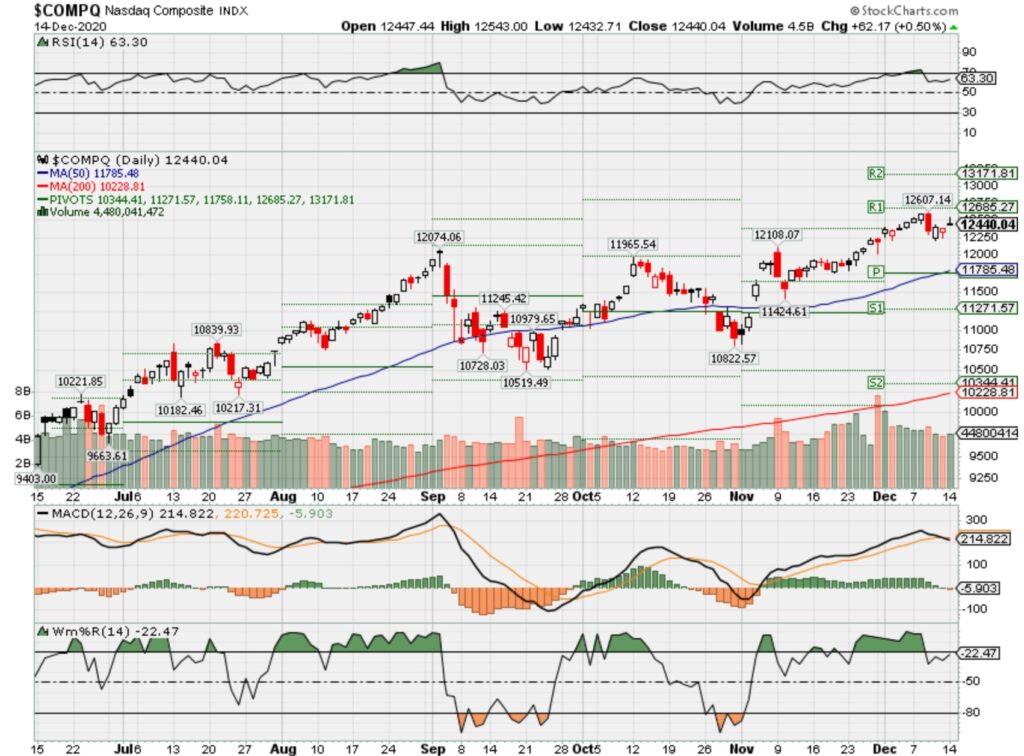
COMP – Bullish
Where Will the SPX end December 2020?
12-14-2020 +2.5%
12-07-2020 +2.5%
11-30-2020 +2.5%
Earnings:
Mon:
Tues: NDSN
Wed: LEN
Thur: CCL, GIS, JBL, RAD, BB, FDX
Fri: DRI, NKE
Econ Reports:
Mon:
Tues: Empire, Capacity Utilization, Industrial Production, Import, Export
Wed: MBA, Retail Sales, Retail ex-auto, Business Inventories, NAHB Housing Market Index, FOMC Rate Decision
Thur: Initial Claims, Continuing Claims, Housing Starts, Building Permits, Phil Fed
Fri: Current Account Balances, Leading Indicators, OPTIONS EXPIRATION
Int’l:
Mon –
Tues –
Wed –
Thursday –
Friday-
Sunday –
How am I looking to trade?
The big decision how far to let stocks run into a Christmas Rally ?!?!?!?!?
EARNINGS
www.myhurleyinvestment.com = Blogsite
customerservice@hurleyinvestments.com = Email
Questions???
https://seekingalpha.com/article/4392373-baidu-is-not-aging-search-dinosaur
Baidu Is Not An Aging Search Dinosaur
Dec. 1, 2020 3:54 PM ET
Summary
Baidu is priced as if its search is the only sunset business it has.
I break it down by business lines to demystify the poor perception Baidu often received, and show its true strength.
Baidu is a strong buy at its current price.
Background
Baidu (BIDU) is often regarded as Google in China. The largest search engine in China, Baidu also has a similar corporate strategy to Google, as it develops market leadership in other areas such as smart devices, AI, and Cloud.
BAT (Baidu, Alibaba, Tencent) were considered 3 prominent Chinese internet giants, similar to the positioning of Google, Amazon, and Facebook.
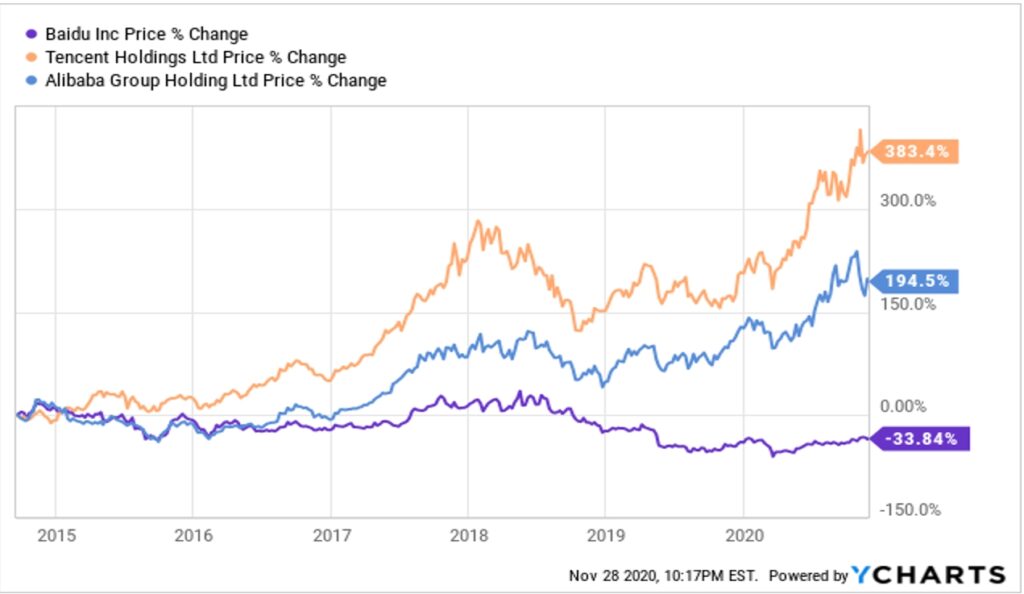
However, Baidu has fallen behind over the last 5 to 10 years, resulting from its complacency after Google’s withdrawal from China in 2010, and arguably declining search quality, which was tragically underscored by a university student death associated with treatment advice from Baidu search in 2015. Its stock price since 2015 shows a widening gap between Baidu and Tencent/Alibaba. Currently, Baidu’s market cap of 47.5B is less than 7% Alibaba or Tencent.
Data by YCharts
Investment Thesis
While Baidu search took many missteps, it is still a dominant player with a commanding market share in China. Its online marketing business has steady revenue and is a money-printing machine with a decent profit margin. In the meantime, Baidu’s many other bets, including its Cloud/AI, Smart Device, and Autonomous Driving business are top-tier businesses and compete favorably among its domestic and international peers.
My conservative model values Baidu at $60.5B with a 28% potential upside to its current price.
Business
Search: Despite heightened doubts on its search quality, Baidu search has a commanding market share of 76% in China today. Its closest competitor Sogou, with deep-pocket backers including Tencent (OTCPK:TCEHY) and Sohu (SOHU), ranked distant No.2 at 11%.
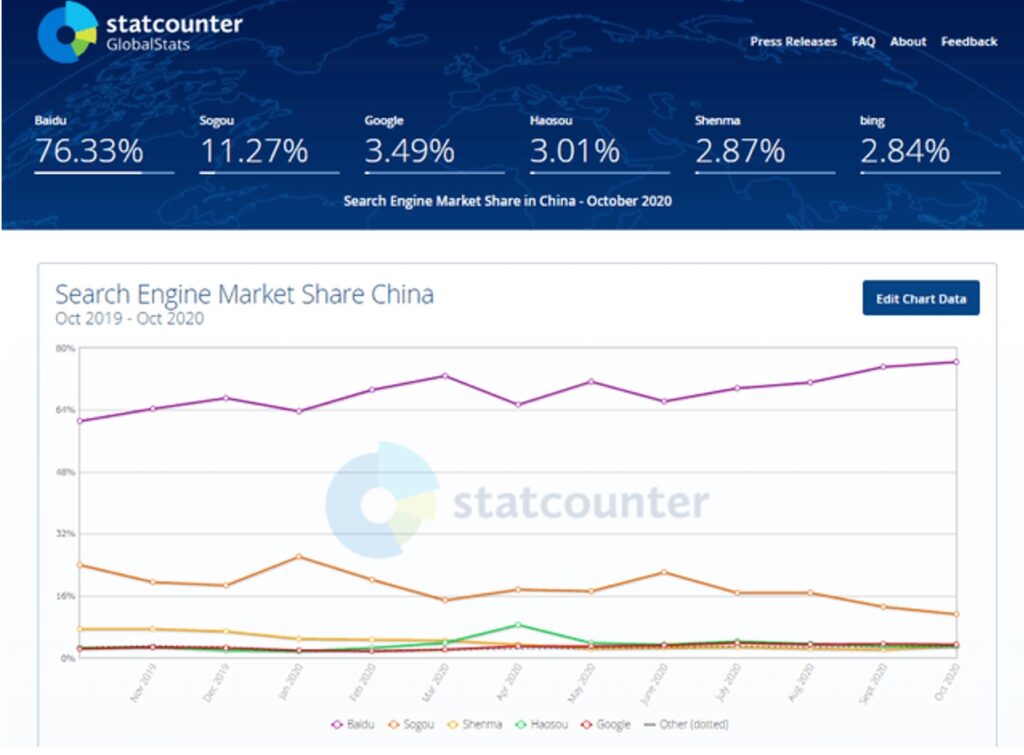
Source: Search Engine Market Share China from StatCounter
Smart Devices: Online marketing business is to compete on consumers’ attention and access to information. Smart speakers and displays become vital IoT plays on the battlefield.
Baidu sold 19 million smart speakers (powered by DuerOS) in 2019, about 12% global market share, ranked No.3 globally (behind Amazon/Google) and No.1 in China (ahead of its peers Alibaba and Xiaomi). The chart below shows the top players’ market share from 2016 to 2019 and noticed Baidu’s surge from 2018 to 2019.
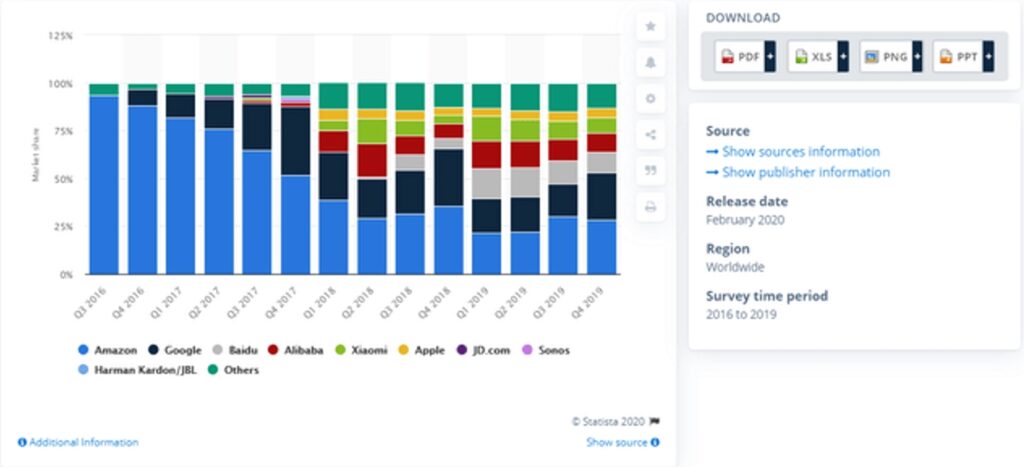
Source: from Statista
Cloud/AI:
Baidu entered the cloud business relatively late in 2015. In the latest Canalys estimate published in Jun 2020, Alibaba leads with over 44% market share in China, Baidu belongs to the 2nd tier, ranked No.4 with 8.6% market share, behind Tencent and Huawei.
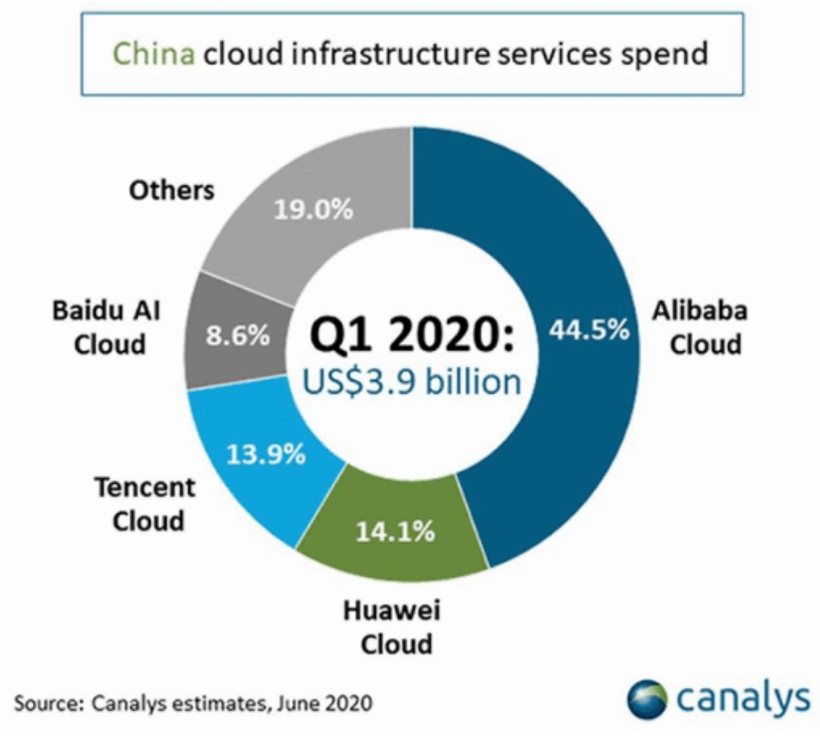
Source: Canalys estimates, June 2020
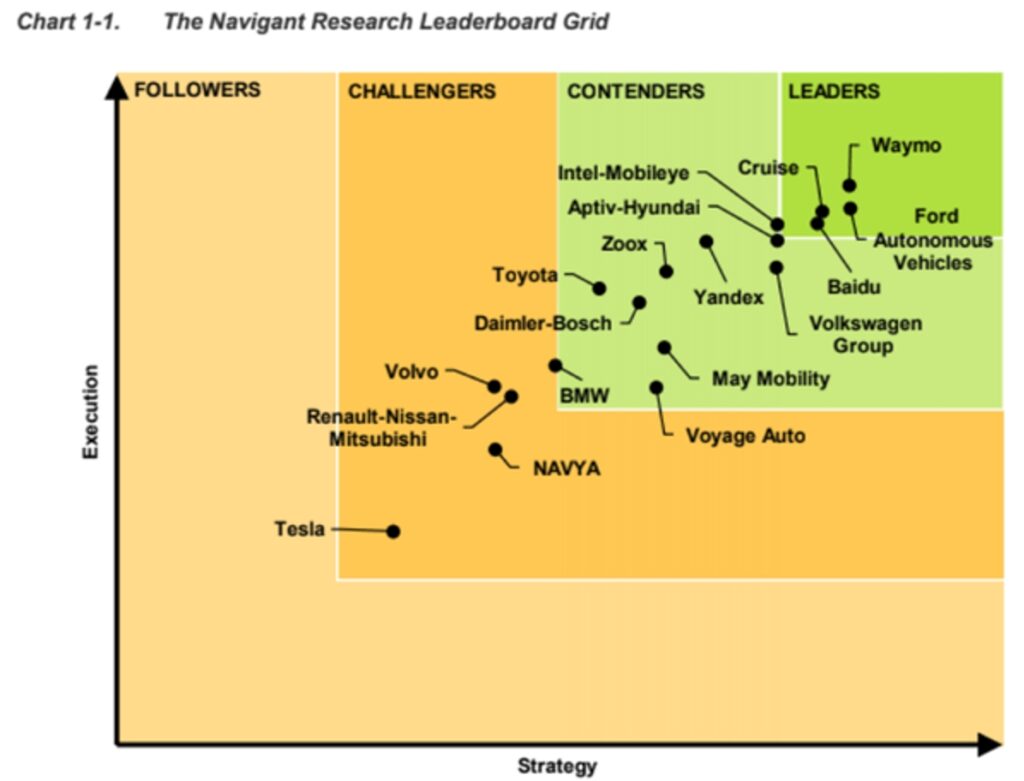
Autonomous Driving: A bit less known, Baidu’s autonomous driving unit (aka Apollo) competes favorably among its international peers. In the Navigant research report published early this year, Baidu was placed in the Leaders group, together with Waymo, Cruise (GM), and Ford (F).
Califonia DMV publishes a self-driving car annual report. In its 2019 report, Baidu has the highest MPI (Miles Per Intervention) score among all participants. While we shall take that information with a grain of salt, as MPI has long been disputed as a less relevant measurement, it provides a data point that Baidu is one of the top competitors in the autonomous driving space.
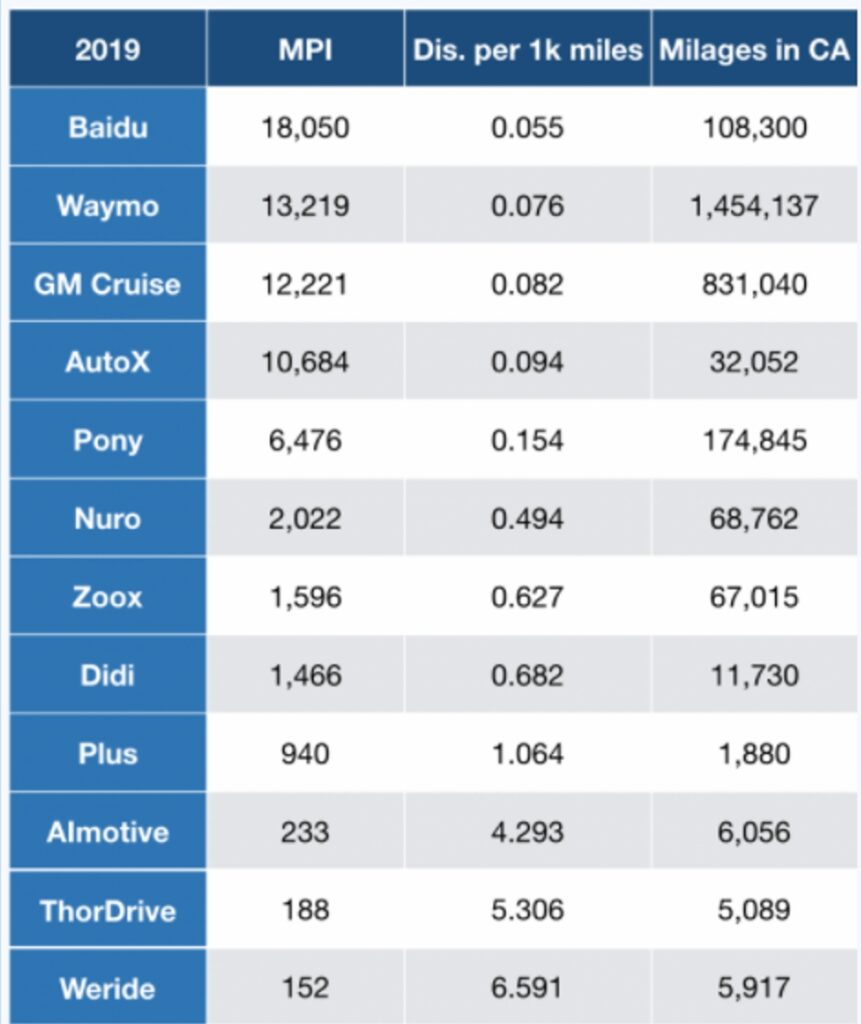
Source: data from 2019 CA DMV self-driving car report
Sum-of-all-parts Valuation
Search (online marketing): its online marketing revenue (driven mostly by search) is a steady and mature business that generates around $10B revenue a year, with an average net profit of around $2.5B. For a high operating margin, steady/low growth business, I use a conservative 10x P/E and value its online marketing business at 25B.
Smart Devices: Smart Living Group (NYSE:SLG) operates DuerOS voice assistant and associated smart speakers and displays. In the latest Series A round SLG has a 2.9B valuation. Though it doesn’t disclose the detailed deal terms, it mentioned that Baidu will continue to be the majority shareholder. I valued it at $2B, assume Baidu has 70% ownership.
Cloud/AI: Baidu doesn’t provide its Cloud business revenue breakdown. Alibaba recorded $6B cloud business annual revenue in its latest report, which will place Baidu’s cloud annual revenue at roughly $1B, as Baidu’s Cloud business is about 18% Alibaba’s cloud size (see above section from Canalys Estimates in June 2020).
Alibaba Cloud was recently valued at $93B. At 18% Alibaba Cloud size, a conservative model value Baidu cloud at $12B.
Apollo: it is difficult to value an autonomous driving unit. A prominent example was Waymo. It was valued at around $200B in 2018, while its latest 2020 round put a price tag of 30B. As a conservative model, I value Apollo at $5B.
Other Assets (iQiyi + CTrip + Net Cash Position)
Baidu has 56% ownership of iQiyi (IQ), valued at $9B.
Baidu has 12% ownership of Trip.com Group (TCOM), valued at 2.5B.
Prior to JOYY (YY) acquisition, excluding intangible assets, long term equity investment, and PP&E, Baidu has a net cash position around 5B.
Sum-of-all-parts calculation values Baidu at $60.5B, equivalent to $178/share, a 28% potential upside to its current price at $139.4.
Recent Events
JOYY Acquisition: Since Baidu’s 3.6B JOYY Chinese live streaming business acquisition announcement on 11/16, and Muddy Water’s JOYY short report shortly after, Baidu’s stock dropped 5.7%, and has been lagging behind KraneShares CSI China Internet ETF (KWEB) by 6.6%, that is almost a $3.1B market cap loss. In other words, the market already wrote off 80% JOYY acquisition value in less than 10 days, not to mention Baidu actually had an excellent quarterly report, beating analyst estimates both top and bottom lines, as its Baidu core earned $1.1B operating income, back to pre-covid level.
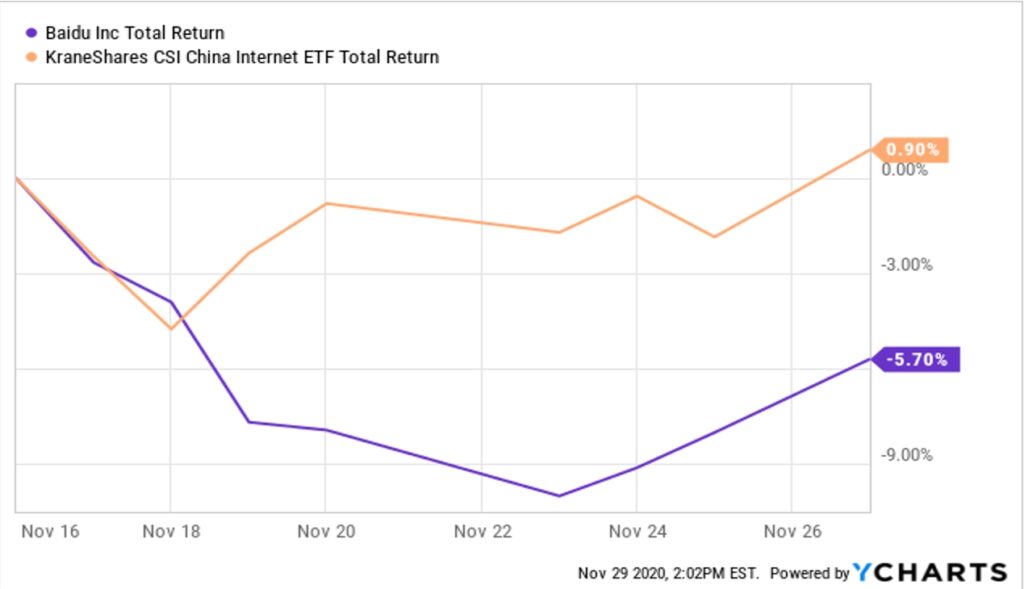
Data by YCharts
[object HTMLElement]
While I don’t have a view on whether Baidu’s JOYY acquisition is an excellent move or not, I believe a loss of over $3B market cap on a $3.6B acquisition is an over-reaction and presents a good buying opportunity.
Concerns and Opportunities
While Search continues to provide an important path to how consumers acquire information online, it has evolved from a simple search box to more diversified channels, including richer contents, IoT (smart devices), and IoV (autonomous driving). The battlefield will continue to expand, and it includes deep-pocket players like Tencent, Alibaba, ByteDance to name a few. That means Baidu must continue to invest heavily in both content, and channels. This is a must-win battle and will present a significant threat to its existence if its market share drops below 2/3.
Baidu has gained significant cloud market share since 2018. Its non-online marketing revenue from Baidu core reached $434 million in 3Q20, increasing 14% year over year, primarily driven by the growth of cloud services. Note that smart devices contributed about 50% of that revenue, so its cloud revenue increase YoY is roughly 30%. Its enhanced AI integration with Cloud has been praised as a key competitive edge against its competitors and AI has become increasingly important in Cloud use cases and shall provide a further tailwind to Baidu Cloud.
Concluding Thoughts
A conservative sum-of-all-parts values Baidu at a $60.5B market cap. At the current price of $139/share, it offers 28% upside potential, and I am taking a position at the current price.
One More Thing
I hope you enjoy the article and find the idea worth further exploring. I would like to mention the last article I wrote had a similar investment thesis – Citi (C) is a fundamentally strong business facing some temporary headwinds. Since my publication a month ago, Citi went up 39.5%, outperformed S&P Regional Banking ETF (KRE) by 14% and S&P500 (SPY) by 28%.
I would appreciate you following me, and best of luck with your investments.
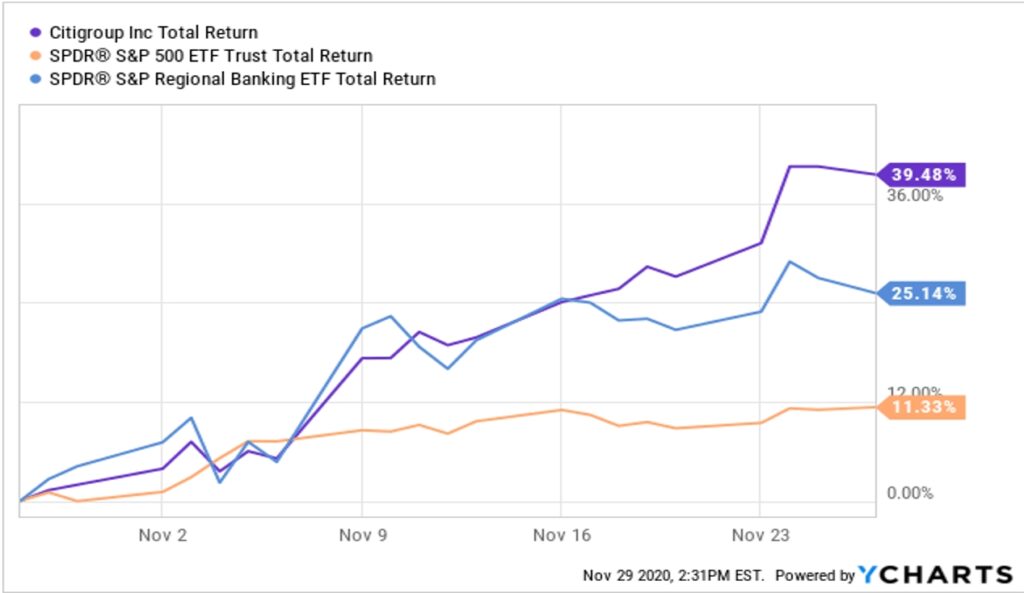
Data by YCharts
[object HTMLElement]
Disclosure: I am/we are long BIDU. I wrote this article myself, and it expresses my own opinions. I am not receiving compensation for it (other than from Seeking Alpha). I have no business relationship with any company whose stock is mentioned in this article. https://buy.tinypass.com/checkout/template/show?displayMode=inline&containerSelector=.pianoInlineBottom&templateId=OTWE1YZWIZDB&offerId=fakeOfferId&showCloseButton=false&trackingId=%7Bjcx%7DH4sIAAAAAAAAAF2R227bMAyG30XXEUCdZd1lXbqlh3VtgrjtnSLTiYLY9WLZCVb03WsH64ZOgARQ3_-TlPhKfCyIIxf51e5nY0LTkQlp_AZXEY_zkXDgQBmnTFKwVGkqORVG0WbaL-4eWexu7-91sEtqlDBaCq6YygRoLDxqlJkpLMiyEOshMZ4aPESsA55Tzx4X8xtxu9CrS_WJzk4YuhRf6rOMraVNmYUtUBgWTzvW9bj7JZqabbXh1VpX7Sf_NPw1t9uX4xKrZu8TTi8eflxmD9ffxcyYseLWtx-MuHTocELSn_hsvlvmM_b0nM-fv34h_9jKH6Kv0yipu_1-QoKvGh83dftx0cc2njnp6X8fyKliFIaN8bTKy-tq-dTj7yr_RpkKmWDcl4WVxbqEDJTmwhSlYtaCz4YOYjNORANz2jInAJxSw2GyEp1EsK4MUjgJOIq7Fg_TDdZp8BTHMD4g7YljGoaJGAv87R11H-uX_gEAAA&experienceId=EXSIL3MS6VF5&tbc=%7Bjzx%7DlCp-P5kTOqotpgFeypItnF8s8MpxM38IrHUJL44z5kT9myju13V863INrmtFdZLd-oj4WGLy_qkPpbhS8evNjmz52ga-TzS89UhSZ0XSc3Ch9ov4MMdmNkXIk9Tg6-qrF_8FvkdvJa7BN2lpXibw_Q&iframeId=offer-0-qMWGS&url=https%3A%2F%2Fseekingalpha.com%2Farticle%2F4392373-baidu-is-not-aging-search-dinosaur&parentDualScreenLeft=0&parentDualScreenTop=0&parentWidth=1127&parentHeight=650&parentOuterHeight=752&aid=CWJjPp7cpu&tags=long-ideas%2Cdeep-value%2Csum-of-the-parts%2Csa-exclusive%2Cauthors-pick%2Cchina-country%2Cinternet-information-providers%2Ctechnology%2Carticle%2Cglobal-markets%2Cspecial-access&pageViewId=2020-12-14-08-56-42-375-pAvSOX1iuMQQ6c8T-753764325159306edae6e497d804fd3b&visitId=v-2020-12-14-08-52-51-051-eixVWfKmTYvezmWG-15c9312afd84dbf09056237df51880a9&userProvider=publisher_user_ref&userToken=3dkJn1RuwX2f3Tet5YykzffNcp7zTHEy4E7purByigW5RnW2W2D1LQJzXW8zCe2pKVxHdsoc0MwmXaM3TkGO2PF3vJz-NeE4B7odXolPKfY~~~LCwniebVGRvC9-NEIj9oBVPlGMH16hjiO7bHW9Bom50&customCookies=%7B%7D&hasLoginRequiredCallback=true&width=643&_qh=000ff96873
https://seekingalpha.com/news/3644059-paypal-tops-evercore-isi-list-of-2021-payment-stock-picks
PayPal tops Evercore ISI list of 2021 payment stock picks
Dec. 14, 2020 9:41 AM ETPayPal Holdings, Inc. (PYPL)By: Liz Kiesche, SA News Editor6 Comments
- Evercore ISI analyst David Togut names PayPal (PYPL +2.0%) top 2021 payment stock pick as the fintech benefits from acceleration of digital payments triggered by the COVID-19.
- “Potential new marketplace wins could offset the headwind from the end of eBay operating agreement,” Togut writes in a note to clients.
- He points to the launch of its crypto service and the introduction of QR codes that will allow consumers to use PayPal at large national retailers in-store.
- Rates PYPL Outperform with a $312 price target.
- See how PayPal ratings compare with the rest of Togut’s top five payment picks for 2021:
- Togut names Square (SQ +0.4%) the No. 2 payment stock pick for next year, citing the combination of its Seller ecosystem for micro and small to mid-size merchants and its popular Cash App digital wallet and banking app.
- “2021 catalysts include integration of the Cash App & Seller ecosystems, a potential second government stimulus, and SQ’s usage of its banking license to introduce new products,” Togut writes.
- Rates SQ Outperform with a $300 price target.
- Square stock far outpaces its payment rivals and the S&P 500 in the past year:
- FIS (FIS -0.8%) comes in third on Togut’s list as its transformational Wordpay acquisition “should accelerate FIS’ organic revenue growth from a COVID-pressured 1% in 2020 to at least high single digits in 2021, sustaining in 2022 and beyond.”
- “FIS enjoys a superior market position in the regional and Tier 1 bank outsourcing space, evidenced by recent long-term core processing contract wins with 4 of the top 30 US banks by assets,” he writes.
- Rated FIS Outperform with a $193 price target.
- Rounding out the top five picks are Global Payments (GPN +1.1%) and Fiserv (FISV +0.6%).
Wintel Wars: Apple’s Revenge On Microsoft And Intel
Dec. 14, 2020 10:10 AM ET
Summary
We discuss how Apple has spent two decades setting the stage for its return to dominating the PC industry. We cover the complex relationships between Apple, TSMC, Microsoft, and Intel.
Though Intel has tricks up the sleeve, it’s x86 bread and butter is a likely casualty of Apple’s conquest. Microsoft has more flexibility, focusing on cloud and emerging technologies.
Apple’s custom silicon signals a much larger master plan for the “personal computer” industry. There are seismic shifts occurring that are not yet widely understood.
The rise of Apple is being enabled by a close partnership with TSMC, which is one of only 3 companies in the world with advanced fab technology (along with Intel and Samsung).
The ramifications of Apple’s strategy could stretch into server hardware, as ARM continues to take market share from Intel’s x86. This might justify the epic expectations surrounding Nvidia.
Introduction
For decades, the computer industry has been dominated by a confederacy between Microsoft and Intel. This powerful partnership first emerged in in the 1980’s as Microsoft began to optimize software for IBM machines running Intel hardware. This led to a closely knit “co-engineering” relationship where Microsoft software was designed to run exclusively on Intel hardware, with the effect that computer manufacturers became essentially VARs (value-added-resellers), taking Microsoft and Intel products, and integrating them into complete units marketed to the consumer.
The computer manufacturers became more like distributors for Microsoft and Intel. As IBM began to loose its grip on the industry, rising competitors such as Gateway and AST battled each other for market share… Intel and Microsoft reigned supreme. Since the majority of computers shipped with a combination of Microsoft Windows software running on Intel hardware, this relationship was dubbed “Wintel“. As the structure of the industry flattened, Wintel became the governing force.
The X86 Confederacy
This “co-engineering” relationship hinged on an instruction set architecture known as x86, which Intel developed and patented. In layman’s terms, Intel patented the fundamental instructions for operating a computer, because Microsoft wrote it’s programs to run exclusively on Intel’s patented instructions.
This was truly a 4D chess move at a time when companies (such as AT&T and Knight-Ridder) basically saw the PC industry as a multi-media content distribution platform, a digital version of the daily newspaper (coincidentally, this view was later pervasive in dot-com companies such as Yahoo and AOL). Intel was working on x86 at the same time executives at IBM largely saw personal computers as merely a consumer novelty.
Ironically, decisions made by IBM when it entered the market 1981 would act as a catalyst for Wintel’s dominance, making it the standard for the industry. IBM was trying to catch up to Apple, which had approximately 90% market share in personal computers. By the end of the decade, Apple’s market share would be single digits. However, Microsoft and Intel were the true winners.
The effect of x86 was twofold. For one, a competitor developing their own hardware would not be able to run Windows (unless they licensed x86 from Intel, in the case of AMD). More importantly, the dominance of “Wintel” propelled Intel’s R&D budget. For Microsoft, it meant that its software, and software written for Windows, would have future compatibility with Intel’s x86 chips. It would not have to write new software for each new chip.
It was a virtuous cycle. With operational cash flows growing from $1B in 1990 to $10B in 1997, Intel was able to leap ahead of the rest of the industry with better and better hardware. This in turn, of course, further cemented Microsoft’s dominance in software.
Intel pioneered a concept known as Moore’s Law, an observation that the number of transistors in an integrated circuit doubles roughly every two years. The pursuit of this engineering goal put Intel and Microsoft both at the center of the global economy. Bill Gates became the richest man on earth. Intel viewed Moore’s Law almost like a religion, of which Intel employees were the guardian.
An attempt at a competing solution, a partnership between Apple, IBM, and Motorola, failed. To keep up, Apple was forced to adopted x86 and Intel hardware in 2005. Little has changed since then. However, the proliferation of mobile computing (smartphones) would set the stage for a massive seismic shift that has only just begun.
The Mobile Computing Revolution
Not long after Apple moved from PowerPC to x86, then CEO Steve Jobs approached Intel to pitch a partnership for iPhone processors. Paul Otellini, Intel’s CEO at the time, later said that Intel didn’t think it would turn enough profit off of the deal. Intel passed.
This led Apple to turn to another partner, Samsung. A stable supply of advanced NAND flash memory from Samsung’s semiconductor foundry had been critical in the development of the iPod, which also relied on both the ARM instruction set (an alternative to x86) and Samsung SoC’s.
Because Samsung was already both producing phones and a key partner for the iPod, a partnership with Intel would have helped keep Samsung at bay. In the end, the iPhone’s processor was designed in a joint-effort between Samsung and Apple engineers working together in Cupertino, adapted from a chip Samsung was using for cable boxes.
The Korean government initially banned the iPhone, a tell-tale sign of what came next. Samsung used the engineering expertise gained from developing iPhone SoC’s to enter the smartphone market with the Samsung Galaxy, with the goal of overtaking Apple. This infuriated Apple, which responded with a bitter legal battle. Apple also moved SoC production to TSMC.
Apple may not have been able to stop its partner Samsung from also becoming a formidable competitor, but as mobile computing ascended to dominance, both companies came out winners. Samsung was able to achieve it’s goal of overtaking Apple and becoming the leader in sales volume. Apple dominated the premium side of the market with the highest margins, driving the company to a $2T valuation today.
Intel, sensing parts of its business would be relegated to the lower growth desktop and laptop markets, made an unsuccessful attempt to catch up with Intel Atom SoC’s. But why was Intel unable to corner the mobile the market the same way it had in desktops and laptops?
Because the mobile phone industry was in its infancy, ARM (an alternative to x86) was able to become the de facto standard for mobile computing. As the mobile phone market matured, it was transformed from a scattered mess of different operating systems to a duopoly between Apple and Android, both running on ARM. ARM had the competitive advantage of being inherently energy efficient, making it a natural choice for battery-powered mobile devices. Just as x86 created a barrier to entry to personal computers, ARM created its own exclusive Android/iOS software moat.
One interesting twist is that around the same time Apple moved production to TSMC, Samsung ended up working with Intel on an x86-based mobile OS called “Tizen” as a hedge against its reliance on Google’s android OS. Today it is mostly being used for Samsung’s TV’s.
Thus the entire computer industry essentially split into two categories: Desktops/servers/laptops/datacenters running on x86, phones/tablets/IoT running on ARM. This ARM ecosystem, combined with the rise of the mobile market and its lush profits for Apple, was a windfall for TSMC. Intel’s fateful decision consequently created a powerful new alliance.
“More than Moore” Morris Chang
TSMC was founded by Morris Chang, the former head of manufacturing at Texas Instruments. Morris Chang conceived of the idea for an outsourced foundry business while renting Texas Instrument’s excess manufacturing capacity. This was a radical new idea in the “real men have fabs” era. Today, Taiwan-based TSMC’s market capitalization is 3x that of Texas Instruments. It has LTM revenue of nearly $46B with $27B in operational cash flow. It is the world’s 9th largest company by market cap, recently overtaking the legendary Berkshire Hathaway.
TSMC’s singular focus on the manufacturing process enabled new “fabless” companies such as Qualcomm and Xilinx to focus solely on innovative new chip designs. Many of them licensed the ARM instruction set. Even Intel outsources some manufacturing to TSMC.
The bad blood between Apple and Samsung resulted in Apple designing its own iPhone chips in-house and switching its production to TSMC. Apple used ARM, which it had prior experiences with in devices such as the Apple Newton, the standard for the industry by the time Apple created the A6. Just as Microsoft and Intel had worked together three decades prior to crush Apple in the market for personal computers, TSMC has developed a very close partnership with Apple, its largest customer.
With the rise of mobile computing, “Apple Silicon” has quietly become a major force in the semiconductor industry. Using the profits from the iPhone combined with Apple Silicon R&D efforts, TSMC has been able to catch up and surpass Intel’s manufacturing technology, while Intel has struggled to get its latest process nodes into production.
This has wreaked havoc on the industry. Once subordinate to the whims of industry giant Intel, an array of smaller competitors such as Nvidia are now competitive, empowered by the ability leverage TSMC’s manufacturing technology and ARM’s instruction set. Nvidia’s revenue has increased 3-fold over the past 5 years.
Amazon and Google have also leveraged TSMC’s manufacturing technology and ARM’s IP to create their own custom chips, alternatives to those offered by Intel. TSMC recently announced it was working with Google and AMD on new 3D chip designs, a cutting edge technology.
Apple has been the driving force of TSMC’s success. Rather than setting ambitious Moore’s-Law-type-goals, Apple’s requirement for a new and better manufacturing process for each new iPhone generation has driven TSMC to take less risky incremental steps. This approach lacks the exciting and bombastic hubris of Intel, but it has put TSMC’s technology in the lead.
TSMC’s customers, particularly Apple, are able to focus all of their attention and energy on developing design innovations. TSMC’s engineers work closely with those of its partners. TSMC is able to see potential issues, opportunities, and challenges from its vast array of partnerships. This includes not only Apple, Google, Amazon, Nvidia, Xilinx, and Qaulcomm… but also Broadcom (AVGO), AMD (AMD), Sony (SNE), NXP (NXPI), Marvell (MRVL), and Analog Devices (ADI) among others.
Apple’s Revenge: The Apple-ARM-TSMC Alliance
Perhaps at this point you’ve realized that it’s all come full circle. The IBM-Microsoft-Intel cartel is over; the Apple-ARM-TSMC alliance is looming over the industry. Most street analysts view Apple as a company that is simply content with building a better iPhone every year and maybe selling it at a higher price point. For years, critics have questioned whether Apple will be able to come up with another killer product, a sequel to the iPhone or iPod.
But internally, Apple seems to be quietly pursing a grand strategy to move from a premium alternative to the new standard in personal computing. With Apple’s custom silicon designs, TSMC’s manufacturing process, and ARM’s lightweight architecture, Apple can develop desktop and laptop products that not only compete with “Wintel” but can dominate with clear superiority.
Last week it was widely reported that Apple is working on a new chip to take on Intel. Few people seem to realize that this has already happened. Apple is just working on an even more superior version.
Last month, YouTube celebrity Jonathan Morrison ran a quick test where he opened a short video clip in professional editing software on his “decked out” iMac, powered by Intel, and began exporting it. While waiting for his “decked out” iMac to render the short clip, he pulled out an iPhone 12 Mini. Opened the same video into editing software, and was able to render/export it in seconds. He did this on low battery without any of the cooling fans featured in a typical desktop computer.
In summary, It took minutes for a high-end Intel desktop unit to compute what an iPhone 12 Mini on low battery was able to do in seconds. Let that sink in for a moment before continuing.
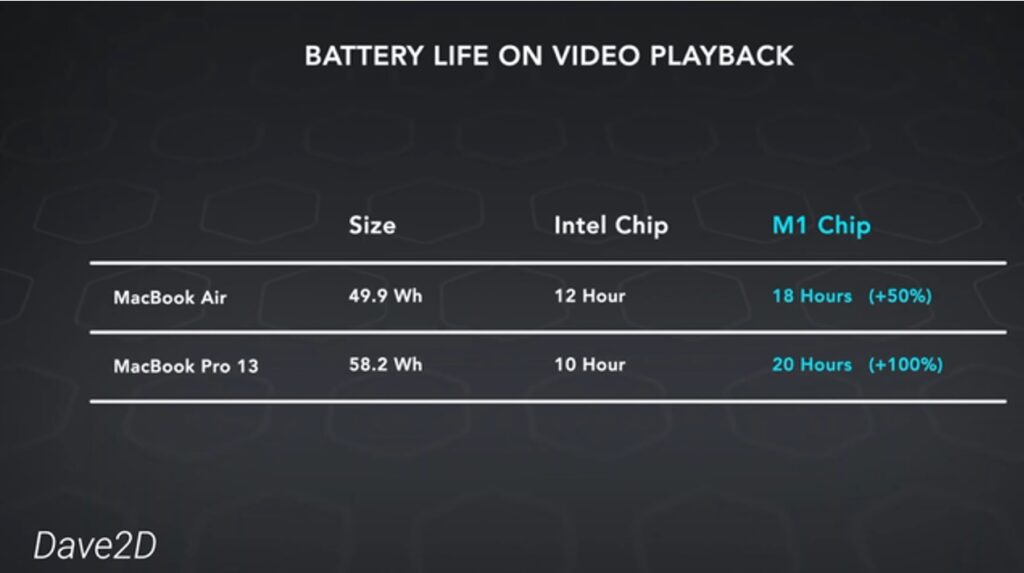
Other reviewers and YouTube celebrities have also provided rave reviews of Apple’s new M1 chip, featured in the latest MacBook. Apple’s x86 emulation software is able to translate most programs into ARM, and the difference has been unnoticeable. This alone is an incredible feat of engineering, though one YouTuber hilariously pointed out that some apps even feature a warning label letting you know that they’re designed for x86/Intel. Adobe has already released a beta version of Photoshop for ARM.
(Image Source: Dave2D/YouTube)
Then there’s the battery life, which is incredible. As one YouTuber described:
20 hours of video playback is bonkers. Like that’s a solid 50% more for the same battery size as the previous generation. It’s as if it’s new battery tech… …That’s what it feels like. This is how significant it is.
This is because of ARMs highly efficient architecture which is inherently low-power. How will Intel compete with bloated and inefficient x86? At this point, the only advantage x86 has is that the desktop/laptop market, with the exception of Apple’s recent releases, is almost exclusively running on x86. Programs that want to take advantage of Apples new designs will have to be rewritten and reworked for ARM. No easy task.
But a few stealthy recent announcements may give foresight into just how grandiose and bold of a strategy Apple has embarked on. In early December, Apple announced that it is putting macOS computers in the cloud, via AWS. For now these “Mac mini computers” will run on Intel i7 processors, to aid developers building and testing apps. How long will it be before Apple starts making it easier for developers to build and test apps on Apple silicon?
A recent key hire might give us a clue. Apple made a near simultaneous announcement that it was bringing in Josh Elman, a former partner at VC firm Greylock, known for his early bets on TikTok and Discord. According to Elma, this role will involve helping customers “discover the best apps for them.” This seems kind of odd, why would a top VC take a corporate role at Apple, just to market apps to customers? We suspect that the true nature of this role might be expanding the role the app store plays in Apple’s ecosystem, by pushing developers to optimize for ARM-based Apple chips.
The biggest and final hurdle is the consumers dependence on software written for Microsoft Windows, but it’s hard to say Microsoft doesn’t see the writing on the wall.
Under Nadella, Microsoft disbanded the entire Windows division, redistributing it across the company. Microsoft is experimenting with its own ARM-based Surface laptops. Microsoft has also experimented with ARM-based servers in Azure, and exotic new designs from companies like Graphcore, of which it is both an investor and partner. Microsoft offers it’s Office suite of software for iOS via a pricey subscription. Xbox runs on AMD hardware built by TSMC, so it’s not a stretch to imagine ARM gaming. Microsoft’s current focus has been on cloud, and turning software into cross-device platforms with Teams, Office 365, and Xbox Console Companion.
Furthermore, the relationship with Intel really started to break down after the 2018 security “meltdown” caused by vulnerabilities in Intel hardware.
Nvidia gets the last laugh…
This analysis would not be complete without a brief discussion about Nvidia. Astute readers will note that ARM is in the process of being acquired by Nvidia, but few realize how transformational this acquisition could be. We believe that Nvidia will transition to being more of an IP-company, licensing out it’s IP/designs (which will now include ARM) and focusing less on developing it’s own competing hardware.
We are porting the NVIDIA AI and NVIDIA RTX engines to ARM. Today, these capabilities are available only on x86. With this initiative, ARM platforms will also be leading-edge at accelerated and AI computing.
From Nvidia’s perspective, the parallel computing technology used in GPUs are the future and they can leverage this by combining their IP with ARM. Technology historically used to compute graphics is now massively reshaping the type of hardware found in the cloud, and enabling ever more powerful AI/ML models with acceleration hardware for specific workloads. We touched on this in our previous article on Palantir (PLTR), where we believe such advances in hardware will not only drive demand, but enable Palantir to scale at much lower costs with less need for developers to write custom code themselves.
ARM is being purchased from SoftBank, a Japanese conglomerate famous for it’s VC offshoots that have built an empire of start-ups. Selling ARM to Nvidia will accelerate technological progress and thus increase the value and feasibility of SoftBank’s futuristic bets. But given Apple’s grand ambitions, perhaps it is no coincidence that SoftBank also approached Apple as a suitor for ARM.
It’s also worth noting that Nvidia’s CEO Jensen Huang and TSMC’s Morris Chang are both long-time friends, working together since the 1990s. Both are Taiwanese-Americans. Coincidentally, so is Lisa Su of AMD, whom we would argue is the most successful female CEO of all time. Possibly because of the complex diplomatic status of Taiwan, the media rarely gives her credit for this.
Perhaps Nvidia, once kicked around by Intel, deserves its lofty valuation. Leveraging TSMC’s manufacturing technology, there’s a very good chance ARM could dominate all of computing, replacing the role of x86 even in datacenter applications (an Intel stronghold). This will depend on Intel’s ability to innovate, and the role of another emerging architecture, the open source RISC-V.
Conclusion
Apple is making a huge play for the personal computer to be an ARM-based ecosystem, of which it is seeking dominant market share. After steadily building an ecosystem capable of offering a compelling alternative to “Wintel”, the current silicon “world order” is weak enough for Apple to once again return to industry dominance. With Nvidia’s efforts, enterprise and industrial computing may run predominantly on ARM as well.
This is a “super cycle” that has been decades in the making.
Conquering the desktop and laptop markets will enable Apple to fully leverage its software ecosystem, setting the stage for even further innovations. How many readers are viewing this article on a windows computer with an iPhone on the desk? How many/much of your photos, notes, videos, text messages, calendar, and overall life is sitting in Apples iCloud?
The Apple-TSMC partnership is both the new Microsoft Windows and the new Intel. Therefore, we are long both TSMC and Apple. We’ve been long Apple for a long time, and we’re buying even more exposure here. We’re also long Microsoft, given Microsoft’s transformation under Nadella and focus on cloud/enterprise. We own some Nvidia. We might short Intel.
Disclosure: I am/we are long AAPL, MSFT, TSM, NVDA, PLTR. I wrote this article myself, and it expresses my own opinions. I am not receiving compensation for it (other than from Seeking Alpha). I have no business relationship with any company whose stock is mentioned in this article.
Additional disclosure: We may initiate a short position in Intel (INTC).
Carnival Corp.: An Unpopular Valuation Implication Convinces Me To Buy (NYSE:CCL)
November 29, 2020 admin Stock News 0
In 2020, I have written two articles about Carnival Corporation & Plc (CCL). Not so surprisingly, I have added to my long position in Carnival twice this year as well; in March and June. The investment in Carnival is still in the red, and a week ago, I was contemplating whether adding to my position is the right choice. Obviously, I carefully read a few articles on Seeking Alpha and elsewhere, before going through a few broker reports as well. All these articles and reports agreed on one thing; even if Carnival recovers, the upside would be limited because of the massive ownership dilution resulting from millions of new shares the company has issued over the last few months. But what if Carnival was undervalued before the pandemic to start with? In this case, investing in Carnival stock will lead to handsome returns in the coming years, but nobody seems to care about this possibility. A top-down analysis of the cruise industry reveals Carnival was undervalued back then, and it still is. On top of this, Carnival seems to be one of the best picks to isolate the factor returns associated with positive vaccine data. Based on these reasons, I have been adding to my position in Carnival over the last few days.
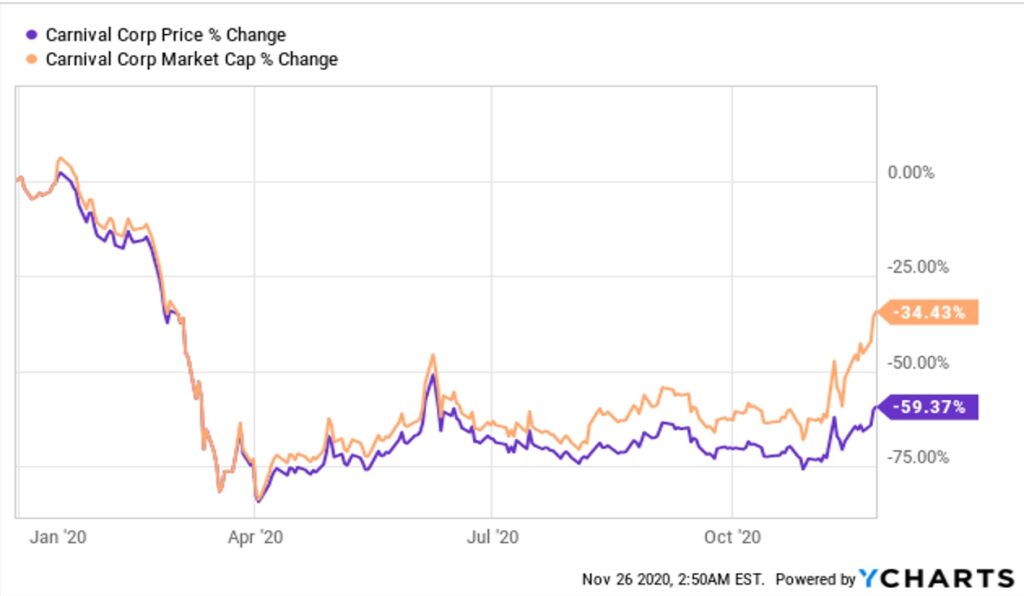
Price return vs. the market value of Carnival
Investors are fair to worry about the ownership dilution resulting from the issuance of new shares. The company had just below 700 million shares outstanding at the beginning of the year, and the new issuance of equity securities and convertible debt securities have lifted the outstanding shares to over a billion as of Nov. 26. Considering this development, an investor would not be surprised to know that the market capitalization of the company has declined by a lower percentage in comparison to the YTD return of the stock (because of a higher number of outstanding shares).
Data by YCharts
An easy way to put this in writing is that Carnival is not as cheap as it looks because the company has been issuing new shares at a rapid pace since April. Having said that, this is by no means a confirmation that Carnival is not undervalued. More on this in the following segments.
Carnival might have been significantly undervalued back then
The best place to start is to go back in time to gauge a measure of the valuation multiples at which Carnival stock has traded in the past. For this purpose, I have used a lookback period of 5 years. My findings are summarized below.
| Year | Average P/E multiple | Average P/S multiple |
| 2019 | 11.77 | 1.69 |
| 2018 | 11.10 | 1.85 |
| 2017 | 18.49 | 2.75 |
| 2016 | 13.99 | 2.37 |
| 2015 | 24.11 | 2.70 |
Source: Refinitiv
Even though the company’s revenue increased from $15.7 billion in 2015 to $20.82 billion in 2019 and net income grew from $1.75 billion in 2015 to nearly $3 billion in 2019, Carnival’s average earnings multiples trended downward during this period. The price-to-sales ratio has mirrored the declining P/E ratio as well. This observation suggests investors were expecting Carnival’s growth to slowdown in the coming years even before the pandemic. This, however, seems to be an error of judgment.
Before the pandemic wreaked havoc, the global cruise industry was expected to carry a record 32 million passengers this year, and there are multiple tailwinds driving the industry forward.
- The increasing popularity of experiences over material items among the Generation Z population, which is expected to become the largest contributor to the world economy in the coming years.
- The growth of freelancing that provides the opportunity for professionals to work while traveling.
- The stellar economic growth in emerging nations such as India and China that has led to the rise of a middle-income society in both these nations and many other Asian and Latin American countries.
- The growth of the “solo travel” concept and the measures taken by leading cruise operators to cater to this market by building studio cabins, solo-lounges, and single-friendly activities.
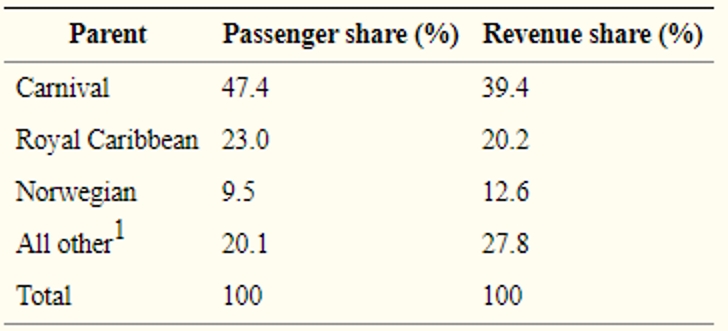
With all these positive developments, the cruise industry was arguably looking forward to possibly their best-ever decade in history from a financial perspective before COVID-19 forced the industry to a standstill. In 2019, Carnival was the undisputed leader in the global cruise industry from both a passenger share perspective and a revenue share perspective.
Source: ResearchGate
Considering this market-leading position, Carnival’s earnings multiples were likely to expand in the years ahead if not for the pandemic. Once again, this goes on to suggest that Carnival might have been mispriced prior to the pandemic. I ran a discounted cash flow valuation based on conservative estimates using Wall Street consensus estimates for revenue as of December 31, 2019, to gauge a measure of the intrinsic value I would have assigned Carnival at the end of the last year. Below are some of the important estimates I used.
- Average EBITDA margin of 25% through 2024.
- Capital expenditures to average 26% of revenue through 2024.
- A weighted average cost of capital of 8%.
Using these assumptions and the consensus estimates for revenue growth, I would have assigned an intrinsic value of $71 per Carnival share at the end of the last year (using a share count of 688 million). In contrast, Carnival shares were trading hands at around $50 in the market at that time, suggesting the company might have been significantly undervalued before the pandemic. Because of this reason, concluding Carnival to be overvalued based on its valuation level prior to the pandemic might result in investors failing to identify the true value of the business.
This, however, is not a guarantee that Carnival is currently undervalued either. The operating conditions have significantly changed over the last few months, and the pandemic has truly changed the business prospects for the coming years. All these need to be factored into our earnings model to conclude whether Carnival is still undervalued, but the point is, the additional shares issued by Carnival to raise funds is not an investment thesis to dump the stock or to avoid investing in the company altogether.
The mounting debt burden will be a drag on future earnings
Carnival’s long-term debt has doubled since November 2019, which goes on to highlight the extreme measures taken by the company management to stay afloat during these trying times. Carnival is required to honor multi-billion dollar debt repayments in the next 3 years, but the debt maturity profile illustrated below reveals only part of the problem.
Source: Third-quarter 10-Q
To assess the real impact of Carnival’s fundraising activities in the last few months, an investor needs to look at the cost at which the company secured new funding.
| Funding activity | Interest rate |
| $1.9 billion in June 2020 | LIBOR plus 7.5% |
| €800 million in June 2020 | EURIBOR plus 7.5% |
| $775 million in July 2020 | 10.5% |
| €425 million in July 2020 | 10.1% |
| $900 million in August 2020 | 9.9% |
Source: Third-quarter 10-Q
In isolation, the cost of these bonds does not provide any meaningful idea to determine whether Carnival is borrowing at high or low costs. Therefore, comparing the cost of these bonds to what Carnival paid in the past to secure funding is necessary. In October last year, Carnival issued international bonds with a coupon of 1% for a principal value of EUR 600 million. These were issued just a few months before COVID-19 surfaced and goes on to show the material impact on Carnival’s cost of capital resulting from the challenging business conditions that have prevailed since the beginning of the year.
To account for this negative development, among other things such as adjusting the net profit margin and free cash flow to equity expectations, I have used a much higher weighted average cost of capital in my updated model for Carnival.
My target price
The global cruise industry is projected to reach the pre-COVID-19 revenue level only by 2024. Taking this into consideration, I have used the below revenue projections in my model. To refresh your memory, Carnival brought in $20.8 billion in revenue in 2019.
| Financial year | Projected revenue (USD millions) | The implied revenue growth rate |
| 2020 | 5,694 | -72.7% |
| 2021 | 8,256 | 45% |
| 2022 | 16,595 | 101% |
| 2023 | 17,787 | 7.2% |
| 2024 | 18,771 | 5.5% |
Source: Author’s expectations
Using a cost of capital of 9.5%, I have arrived at an intrinsic value estimate of $26.13, using just over $1.1 billion shares outstanding. This implies an upside potential of 21% from the market price of $21.58 on Nov. 27.
Takeaway
There’s a lot of talk as to why Carnival does not deserve to converge with its pre-COVID-19 stock price even in the best-case scenario because of the millions of new shares issued by the company over the last few months. Even though this is a very valid argument, the market is missing the possibility that Carnival might have been undervalued before the pandemic, which I believe was the case by the end of the last year. Updating my earnings model for all the available information at present, I find Carnival to be undervalued at the current market price. However, it goes without saying that investing in Carnival will only suit risk-seeking investors because of the significant uncertainties surrounding its business operations and the capital structure. More dilution is likely on the cards as well. To mitigate these risks, I have decided to cap Carnival investment to just 5% of my portfolio, which I believe is a strategy that could be used by every Carnival bull to minimize concentration risk.
If you enjoyed this article and wish to receive updates on my latest research, click “Follow” next to my name at the top of this article.
Disclosure: I am/we are long CCL. I wrote this article myself, and it expresses my own opinions. I am not receiving compensation for it (other than from Seeking Alpha). I have no business relationship with any company whose stock is mentioned in this article.

HI Financial Services Mid-Week 06-24-2014