HI Market View Commentary 04-06-2020
| Market Recap |
| WEEK OF MAR. 30 THROUGH APR. 3, 2020 |
| Last week the Standard & Poor’s 500 Index continued to be plagued by the economic fallout of COVID-19 as dismal data on the labor market coupled with increasingly worrisome death rates upstaged the CARES stimulative package and drove the index 2.1% lower for the week.
The benchmark average closed the week at 2,488.65, down from last week’s close of 2,541.47, marking the sixth week in seven that the index has ended lower. Wall Street closed out the worst first quarter in the financial markets since 1938 and headed into Q2 on the upswing. The S&P was poised to extend last week’s promising close with the support of the healthcare sector with shares of Johnson & Johnson (JNJ) and Abbott Labs (ABT) buoyed by their respective progress on a COVID-19 vaccine and rapid virus test. Johnson & Johnson was up 9% while Abbott gained 6.5% from a week ago. Biotechs pulled out ahead, especially Regeneron (REGN), which jumped 9.7% on the company’s assurances that their COVID-19 program may yield results by the end of this month As one of the few industries insulated from the worst of COVID quarantines, the consumer staples sector gained ground for a second week, up 3.4% from last Friday’s close. McCormick (MKC), General Mills (GIS) and Kroger (KR) propped up the sector with gains of 11% for McCormick and 9.4% from General Mills. Sysco (SYY), however, shed 22% this week. President Trump this week gave the energy sector a much-needed shot in the arm when he weighed in on the price war between Saudi Arabia and Russia. Trump’s assurances that both sides would curb production catapulted oil futures nearly 30%. While most of the gains evaporated when the Kremlin threw cold water on production cuts, the energy sector continued to move higher by 5.3%, marking this only the second time in seven weeks it’s closed the week higher. But the modest gains in consumer staples, energy, and healthcare stocks were more than overshadowed by the heavy losses suffered by defensive sectors such as real estate and utilities, down as much as 7% from last week. Financials lost 6.5%, as plummeting interest rates continued to wreak havoc on banking stocks. Citigroup’s (C) exposure to consumer credit card debt resulted in a 14.4% loss this week, while insurers including Prudential (PRU) and MetLife (MET) were also left with outsized losses of 13% and 10%, respectively. The industrial sector also limped into the close, down 4.3% after another tough week for the airline industry. Boeing (BA) shares were down 23% from the prior week’s close. Shares of American Airlines (AAL) and United Airlines (UAL) were down roughly 30 |
SO the question is what was done through the first quarter that was historically so bad?
IF you Mutual funds or any funds you sat through with the opportunity to dollar cost average with whatever new funds or reserve funds you had in the account.
401K had money to put in the end of the quarter or beginning of the new quarter
Most high yield bonds lost 25%
Most new issue bonds now hold the lowest yields in market history
Spread trading, commodities, currency, hedge trading all got their butt handed to them
100% but 50% short trading did awesome and gold was up roughly 10%
OR you could have been with Hurley Investments
WE added shares 100% paid for on BA, AAPL, F, FB, DIS, V, UAA, AOBC, MU, BIDU
We dollar cost averaged Leaps on BA, AAPL, DIS, F, FB, UAA, BIDU
AND we still have to reset new V Leaps and stock ownership positions
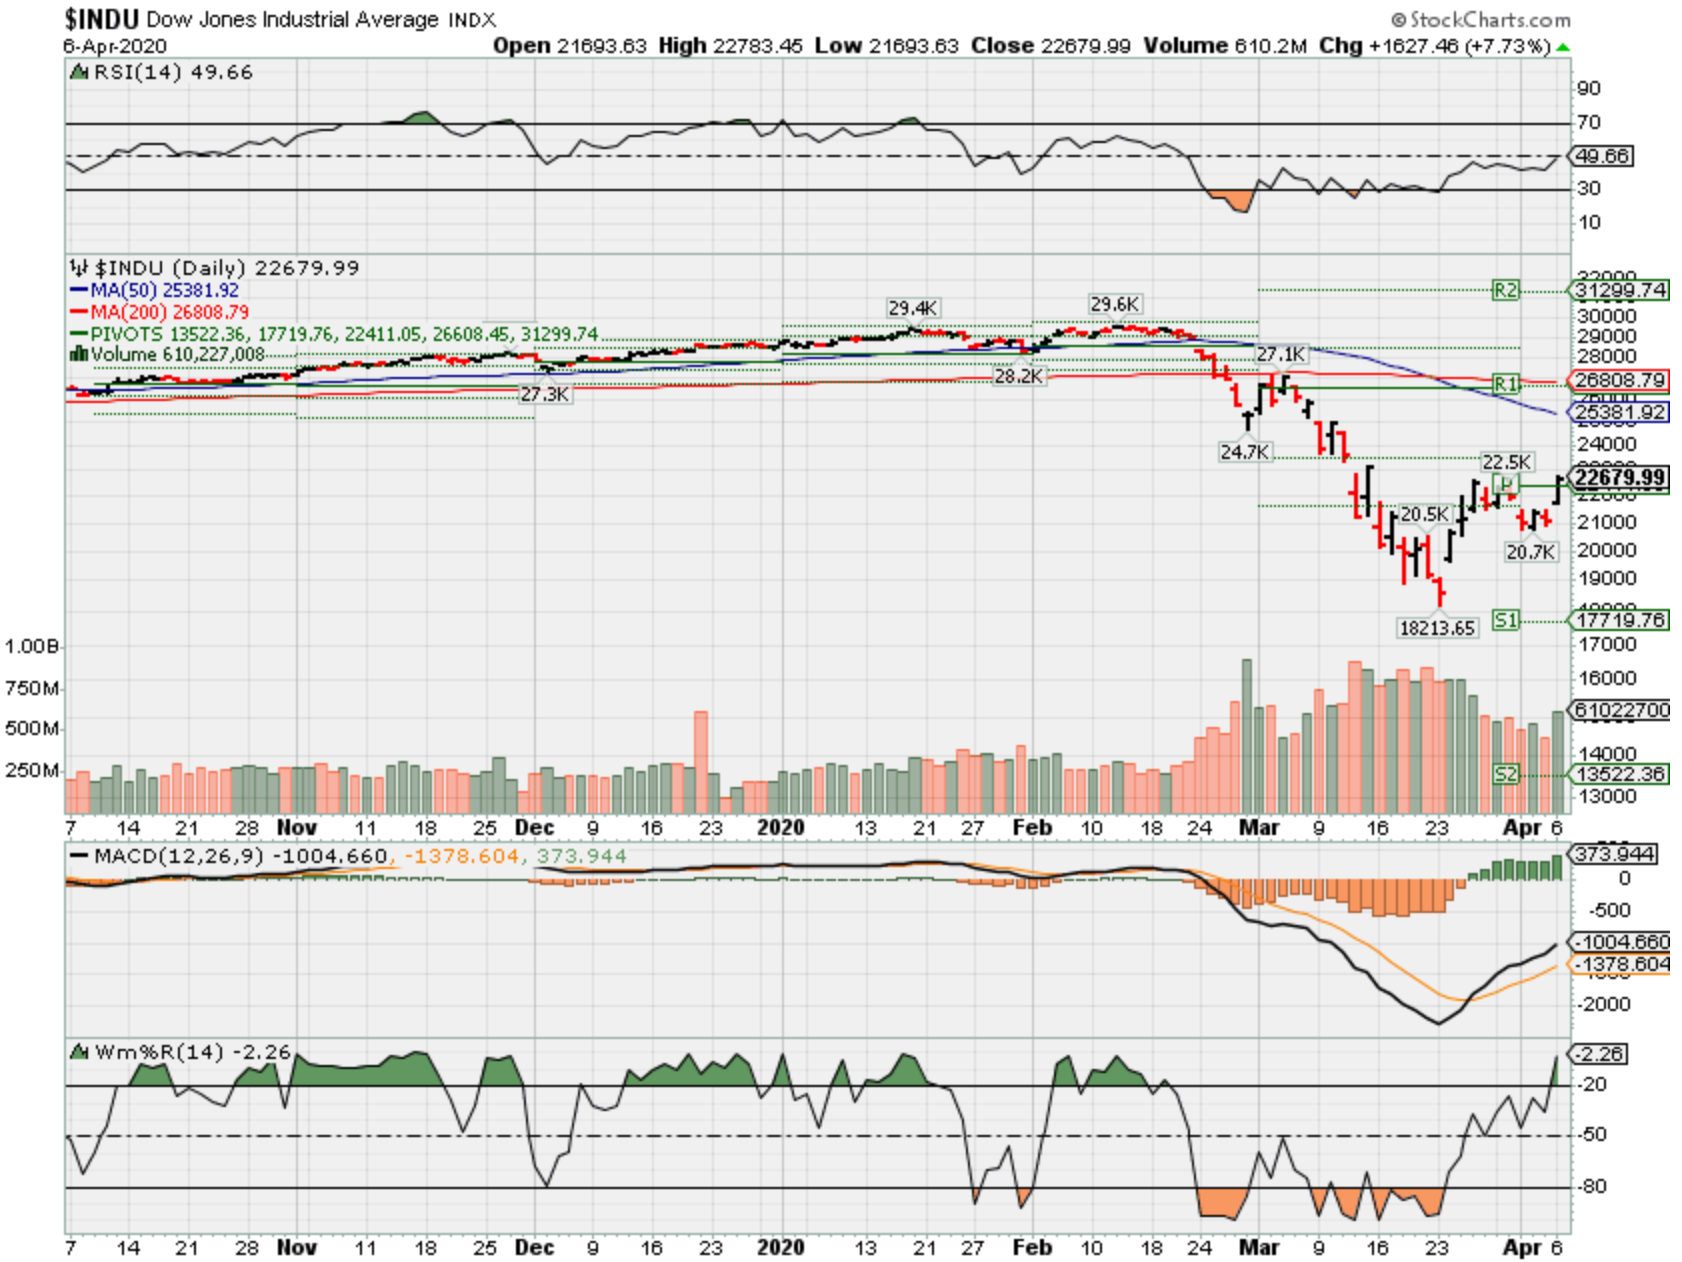
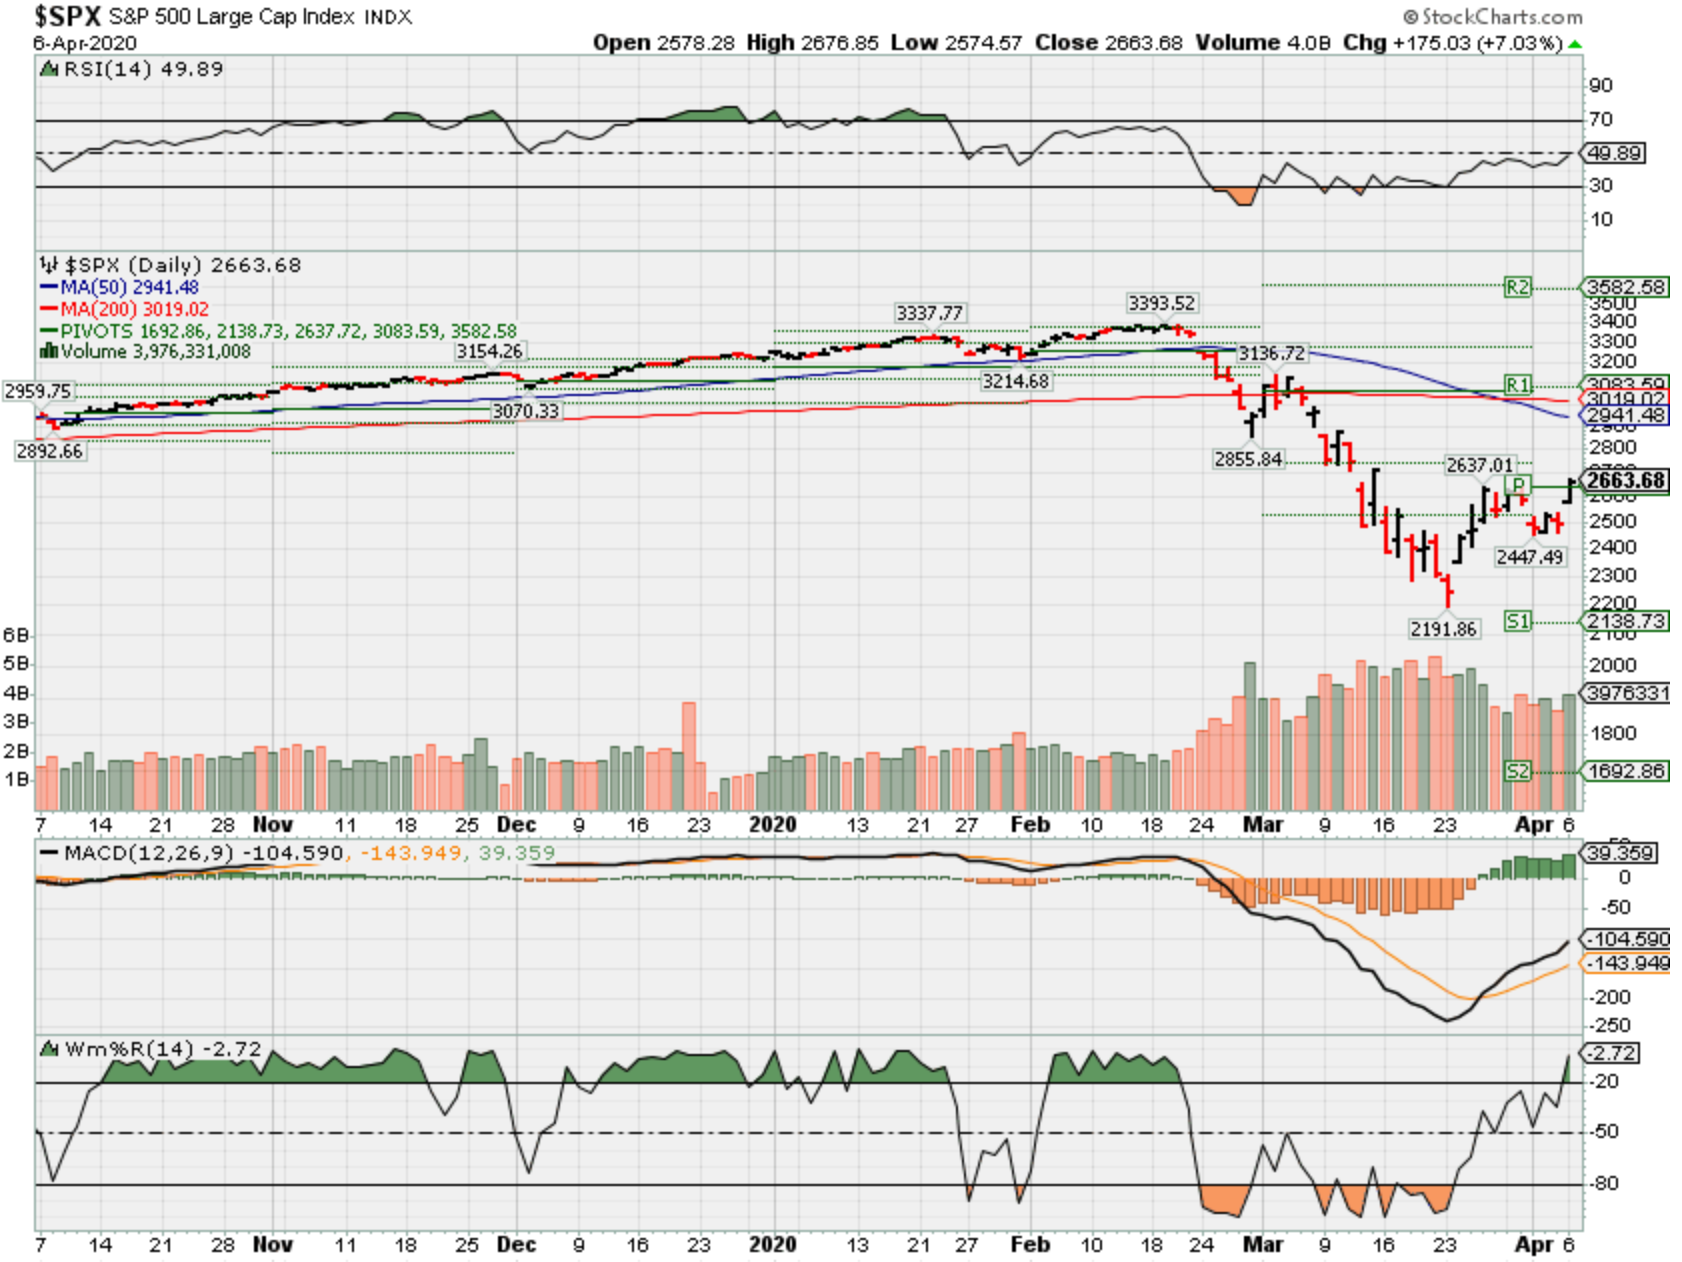
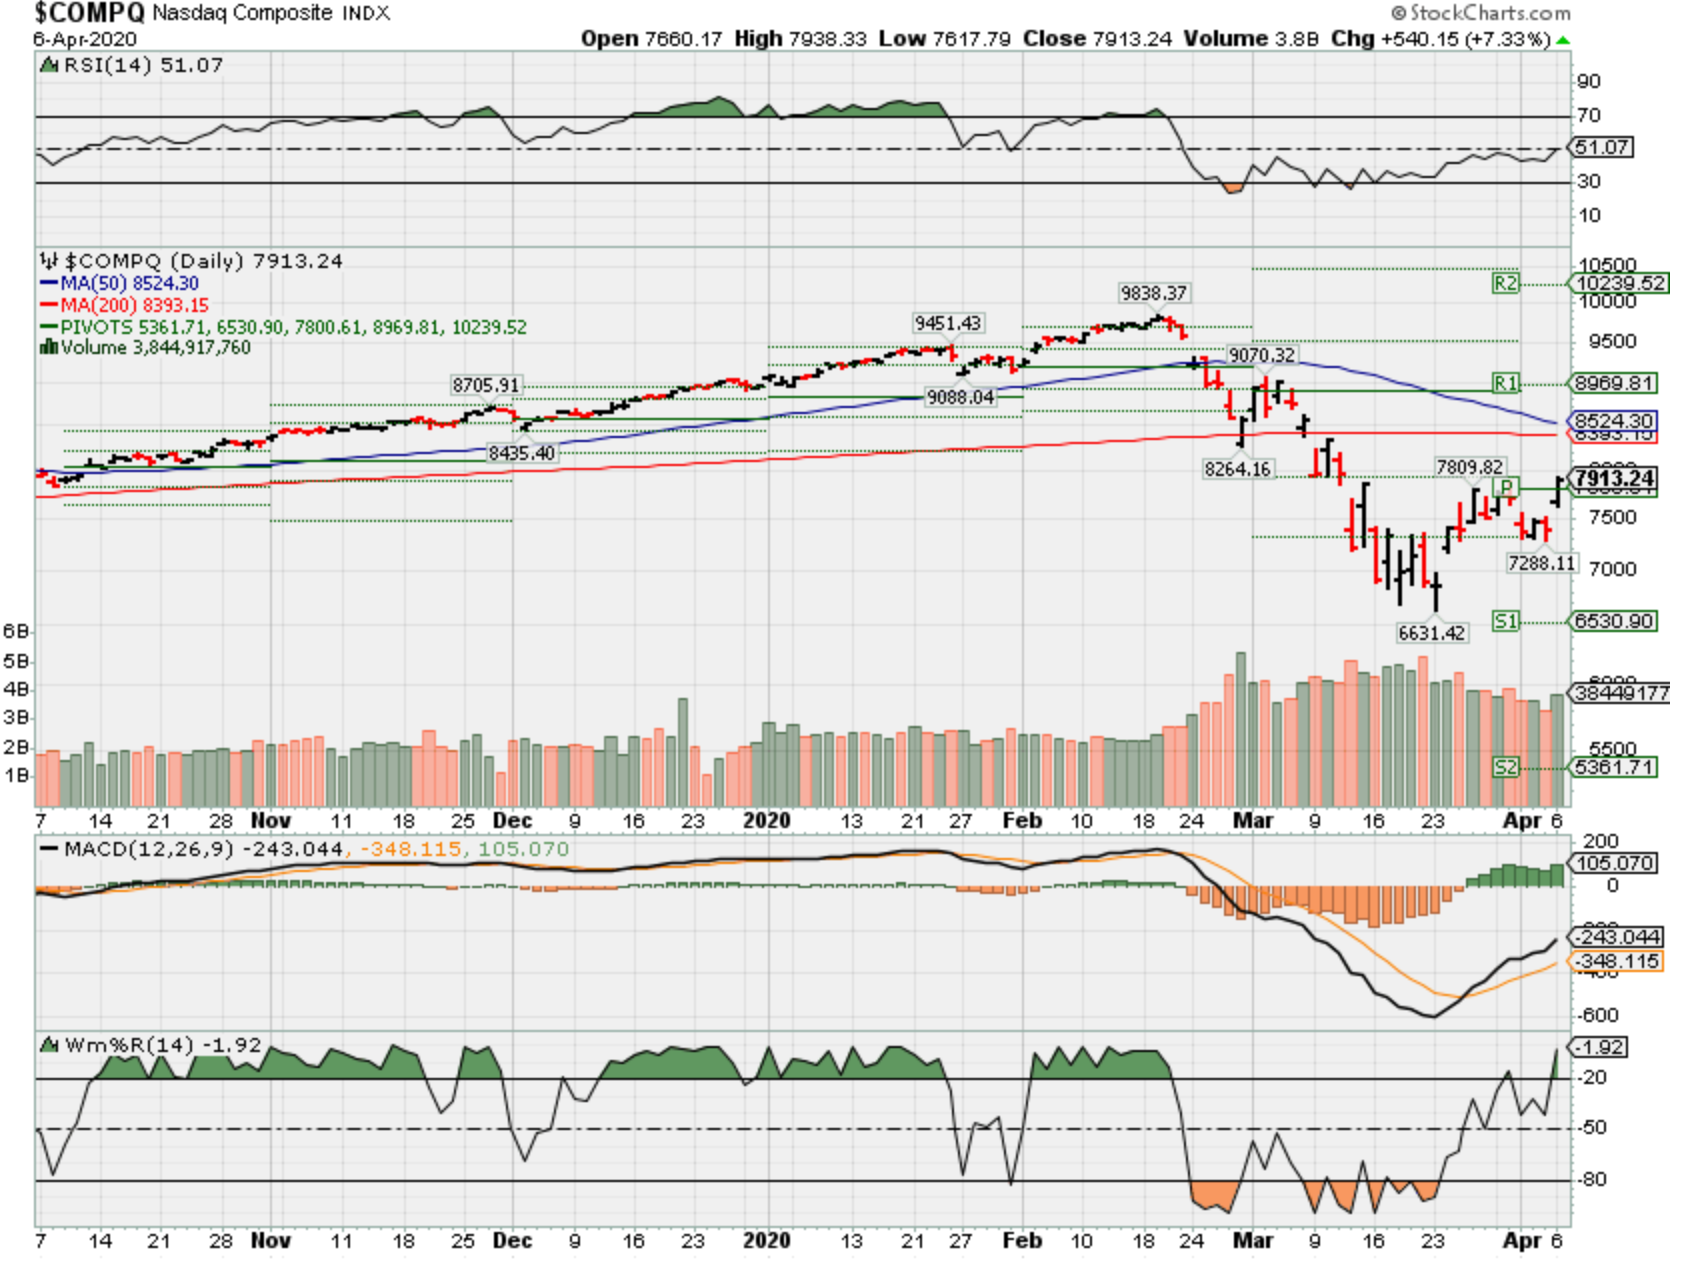
TODAY our markets are up based on ONE DAMN DAY of the new active virus infected people going down or the 9% drop in oil prices with the Saudi Arabia, Russian, OPEC meeting being push to Thursday now
ALL bad news and we hit the 50% retracement on the 100th of a percent
Question is this a bear market retracement before the next leg down
Where will our markets end this week?
Higher
DJIA – Bearish
SPX – Bearish
COMP – Bearish
Where Will the SPX end April 2020?
04-06-2020 +2.0%
03-30-2020 0.0%
Earnings:
Mon:
Tues: LEVI
Wed:
Thur: DAL
Fri:
Econ Reports:
Mon:
Tues: Consumer Credit, Jolts
Wed: MBA, FMOC Minutes
Thur: Initial, Continuing, PPI, Core PPI, Michigan Sentiment, Wholesale Inventories,
Fri: MARKET CLOSED – GOOD FRIDAY
Int’l:
Mon –
Tues –
Wed –
Thursday –
Friday-
Sunday –
How am I looking to trade?
I’m to the point that new money, even if we need to add protection, has to be in place
IF we get down to being only 10% down I have to take protection off and let stocks run
www.myhurleyinvestment.com = Blogsite
customerservice@hurleyinvestments.com = Email
Questions???
IF you don’t trust Chinese why do you invest in BIDU
I’m letting the markets tell me where the next leg will be going
Goldman sees 15% jobless rate and 34% GDP decline, followed by the fastest recovery in history
PUBLISHED TUE, MAR 31 20209:37 AM EDT
Jeff Cox@JEFF.COX.7528@JEFFCOXCNBCCOM
KEY POINTS
- Goldman Sachs has revised its coronavirus projections, seeing an even bigger impact on GDP and employment.
- The firm sees the jobless rate topping out at 15% and GDP sagging by a record 34% in the second quarter.
- That will be followed, though, by a 19% rebound in the third quarter that would be the highest on record, Goldman said.
Goldman Sachs has revised its view for how the coronavirus will impact the U.S. economy, seeing a sharper downturn than originally thought followed by an even bigger upturn.
Among its expectations are that the unemployment will peak around 15% later this year, well above original expectations for 9%. Gross domestic product is forecast to fall 9% in the first quarter followed by a stunning 34% plunge in the second quarter that would be by far the worst period in post-World War II history.
After that, Goldman expects the U.S. to see a spike higher in activity, featuring a 19% surge in Q3. That would take the U.S. from the worst quarter in history to its best.
Economists at the firm cite “anecdotal evidence and the sky-high jobless claims numbers” to back its unemployment forecast. Nearly 3.3 million Americans filed first-time claims for unemployment compensation in the most recent week, and Goldman predicts another 5.5. million to be counted when the next report comes out Thursday.
“This not only means deeper negatives in the very near term but also raises the specter of more adverse second-round effects on income and spending a bit further down the road,” the firm said in a note. “On the other hand, both monetary and fiscal policy are easing dramatically further, which will tend to contain these second-round effects and add to growth down the road.”
For the full year, Goldman forecasts a 6.2% decline in GDP, which also would be worse than anything the nation has seen going back to the Great Depression. The second-quarter plunge would be more than triple the previous low of 10% set in the first quarter of 1958. The Great Recession low of 8.4% came in the fourth quarter of 2008.
A sharp rebound, though, is expected to follow.
Stimulus abounds
Goldman sees the main propulsion coming from fiscal and monetary support greater than expected. Congress has recently passed a $2 trillion rescue package aimed at a variety of targets, and Goldman expects another measure on the way specifically aimed at supporting state governments. The Federal Reserve also has taken its benchmark interest rate to near zero and has rolled out a number of other programs aimed at supporting the economy.
In addition, measures taken to contain the coronavirus spread, specifically through social distancing and increased testing, will “result in sharply lower new infections over the next month, and our baseline is that slower virus spread and adaptation by businesses and individuals should set the stage for a gradual recovery in output starting in May/June,” Goldman wrote.
However, that won’t happen without sharp contractions in manufacturing, particularly autos as well as consumer spending, that will be offset by food and beverage production and medical equipment.
“We expect manufacturing to recover somewhat more rapidly than services, as factories are likely to reopen more quickly than non-essential services firms,” Goldman wrote.
The firm’s estimates come amid a plethora of downbeat forecasts of how bad things could get in the near term and the uncertainty of how sharp the recovery will be.
The St. Louis Federal Reserve recently estimated an unemployment rate that could hit 32% amid 47 million layoffs. However, St. Louis Fed President James Bullard has said he expects the economy to stage a strong recovery after.
The Next Leg Down: Another Massive Decline Is Coming
Mar. 29, 2020 1:51 PM ET
Includes: DDM, DIA, DOG, DXD, EEH, EPS, EQL, FEX, HUSV, IVV, IWL, IWM, JHML, JKD, OTPIX, PSQ, QID, QLD, QQEW, QQQ, QQQE, QQXT, RSP, RWM, RYARX, RYRSX, SCAP, SCHX,
SDOW, SDS, SH, SMLL, SPDN, SPLX, SPUU, SPXE, SPXL, SPXN, SPXS, SPXT, SPXU, SPXV, SPY, SQQQ, SRTY, SSO, SYE, TLT, TNA, TQQQ, TWM, TZA, UDOW, UDPIX, UPRO, URTY, UWM, VFINX, VOO, VTWO, VV
Summary
The next leg down in the current bear market cycle is soon at hand.
The forthcoming economic and financial crisis will be more severe, by far, than any in US economic history since the Great Depression.
During the next leg down in the ongoing bear market, the value of the S&P 500 index is likely to decline a minimum of 26% from Friday’s closing level.
Extremely severe declines, surpassing those experienced during the financial crisis of 2008-2009, are a distinct possibility.
My regular readers are aware that I have been warning of severe US and global recessions – and associated massive stock market declines – due to the fallout from the global COVID-19 pandemic crisis. After alerting my readers and subscribers well in advance about the initial bear market decline, I later provided my readers and subscribers with a forecast of the stock market crash experienced during the week of March 16 – March 20. After alerting my subscribers between March 19 and all of last week about an impending bear market rally, I’m now again warning my readers and subscribers about a forthcoming second major leg in the current bear market cycle.
In this article I will explain why it’s highly likely that, after the current bear market rally runs its course (likely within the next few days), US equities will reverse to the downside and initiate a second major leg down in the current bear market cycle, resulting in a collapse in the value of the S&P 500 index which extends far beneath recent lows established on Friday, March 20. In this article I will describe only one methodology which I have employed to arrive at this forecast.
The Method
The method I describe in this article is relatively simple. I provide a list of historical bear markets since 1929 and classify them by their severity. I then briefly review some of the economic crises and recessions associated with those bear markets and compare them in terms of severity to the current and forthcoming economic crisis and recession that’s associated with the global COVID-19 outbreak.
It will briefly explain why the current and forthcoming economic crisis and recession is likely to be significantly more severe than any other economic crisis and/or recession since the Great Depression. In this context, I will show that it will be quite fortunate, indeed, if during the current bear market cycle, the S&P 500 index manages to establish a bottom somewhere in the range of 1876 to 1463.
Historical Bear Markets
I define a bear market as a decline in the value of the S&P 500 index lasting at least two months and involving a drawdown of 20.0% or more from peak to trough. Correspondingly, a bull market is defined as an increase in the value of the S&P 500 index lasting at least two months and involving a gain of 25% or more from trough to peak.
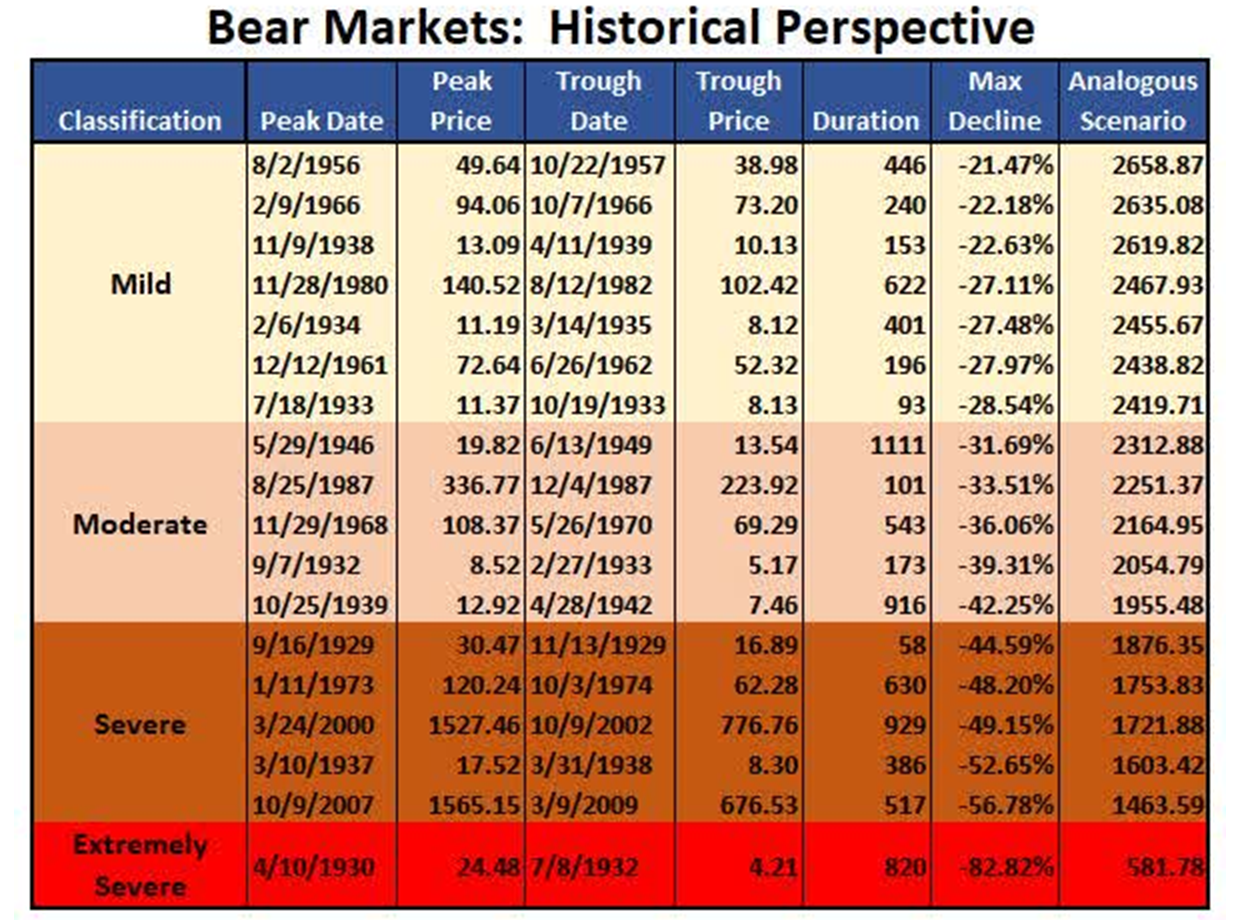
In the table below I provide a list of all historical bear markets since 1929. Furthermore, these historical bear markets have been classified by severity – Mild, Moderate, Severe, Extremely Severe.
Readers should take note of the figures on the right, under the column heading “Analogous Scenario.” This is the hypothetical trough value of the S&P 500 during the current bear market cycle that would correspond to the maximum draw-down of each of the individual historical bear markets that are reported in this list.
In What Range is The Current Bear Market Likely to Trough?
It will be noted by those familiar with economic history that the economic downturns associated with “mild” category of bear markets were relatively mild recessions – or in some cases were merely economic slowdowns. The “moderate” category of bear markets were generally associated with a moderate deterioration of general economic conditions. The “severe” category of bear markets were associated with five of the most severe economic contractions in American economic history since 1929. Finally, the “extremely severe” category of bear markets thus far contains only one historical example (April 1930 – June 1932) – a bear market which was associated with an economic crisis of such severity that it has no rival among other crises in American economic history since 1929.
My current “optimistic case” is that the current bear market will ultimately be classified merely in the “moderate” category. In accordance with this particular analysis, this would imply a trough for the current bear market cycle in the range (S&P 500 index) of 2313 to 1955. For reasons I will proceed to explain later in this article, I believe that it’s relatively unlikely that the S&P 500 will bottom out in this range during the current bear market cycle.
My current “base case” scenario (my working hypothesis) is that the current bear market will ultimately fall into the “severe” category. In this particular analysis, this would imply a trough for the current bear market cycle in the range (S&P 500 index) of 1876 to 1463.
As one contemplates the current and prospective economic crisis, it becomes quite clear that its degree of severity is significantly greater than that of the five economic crises and recessions that are associated with the bear markets classified under the “severe” category. Let us review a few important considerations in this regard.
- Peak loss of output.It’s now generally accepted by economists that US GDP will contract by an annualized rate of somewhere between 15% and 25% in the second quarter of 2020 (some economists have estimated that the contraction in 2Q 2020 could be as severe as -50%). This would represent the greatest quarterly contraction in US economic history, by far.
- Cumulative loss of output.Even though the US economy may resume quarterly sequentialeconomic growth in the third quarter, the US economy will most likely remain in deep contraction mode on a year-over-year basis (i.e. relative to the same period in 2019) for all of 2020. This is due to the fact that social distancing will continue to be practiced (mandated and/or voluntary) – to a lesser or greater degree – for 12-18 months (or until a vaccine and/or cure for COVID-19 is widely available), thereby devastating large parts of the US economy during this time. For example, restaurants, sporting events, air travel, concerts, conventions, shopping malls and tourism will be devastated (relative to 2019 levels) for as long as social distancing is being practiced. In this context, it can be estimated with confidence that the cumulative loss of output associated with the forthcoming recession, relative to the baseline level of output (in this case 2019), will be by far the most severe since the Great Depression. No other recession since 1929 comes even close.
- Peak unemployment.Peak unemployment is likely to surpass 20% and could be substantially higher. This is a higher rate of peak unemployment than any US economic crisis since the Great Depression.
- Cumulative loss of hours of production.The cumulative loss of productive labor associated with the forthcoming recession will surpass any such losses since the great depression. No other recession other than the Great Depression produced a loss of labor hours that is even close, by comparison.
- Massive financial crisis.The forthcoming financial crisis will make the Financial Crisis of 2007-2009 look like child’s play. No financial crisis since the Great Depression will be remotely comparable to the one which will be experienced in the coming months and years. The financial crisis of 2007-2009 – which had been the most severe financial crisis since the Great Depression – was mainly caused by defaults in just one segment of the credit market, namely residential mortgages. The forthcoming financial crisis will involve massive defaults on debt obligations from virtually every single industry in the US economy. Furthermore, massive defaults on commercial leases will have a devastating impact on the highly leveraged real estate sector and the financial entities that finance them. In the course of the forthcoming financial crisis, the common equity sharesof many banks and financial companies will become worthless, while virtually all common equity shareholders of financial companies that provide credit will be subject to massive dilution in forthcoming restructurings and recapitalizations.
- Loss of wealth.The aggregate intrinsic value of common equity shares in the US economy will suffer a precipitous plunge. Many companies will face bankruptcy and the value of common equity shares for most of these companies will go to zero. And in the case of most companies that manage to escape bankruptcy, most common shareholders (public or private) will face drastic reduction in the intrinsic value of their shares due to a combination of increased debt (raised to cover losses) and shareholder dilution via recapitalizations. Furthermore, valuation multiples based on earnings or other fundamental metrics will collapse due to the application of lower long-term growth rates and higher discount rates (i.e. higher risk premiums).
In sum, the severity of the current and forthcoming economic crisis and recession will be far greater than that of any since the Great Depression. Therefore, it’s reasonable to infer that the bear market associated with the current and forthcoming economic crisis will be more severe than any bear market since the Great Depression. Certainly, on this basis, it will be quite fortunate if the current bear market cycle manages to establish a bottom somewhere in the range of the five major US equity market declines categorized as “severe” bear markets.
What About the Effects of Monetary And Fiscal Stimulus?
In response to the above thesis it could be argued that the analysis does not take into account the extent of government counter-cyclical monetary and fiscal stimulus to counter-act the crisis. In my estimates, I certainly do take into account massive monetary and fiscal stimulus. Although this subject cannot be thoroughly addressed in this article, I will briefly point out the following:
- No silver bullet.Fiscal and monetary stimulus will in no way be able to fully compensate for loss of output and loss of income (business and personal) that will result from this crisis. Massive losses of output and income (both personal and business) will occur despite stimulus efforts.
- False expectations on bailouts.Although many US industries will undoubtedly be “rescued,” it’s unlikely that common equity shareholdersof publicly held corporations will be fully “bailed out” – and some will not be bailed out at all. There’s little political appetite in the US to provide bailouts for common equity shareholders of large corporations. The current bailout packages that have been approved by Congress are mainly designed to assist small- and medium-sized businesses. Any forthcoming bailouts of large publicly-traded corporations (such as those that comprise the S&P 500) will most likely involve restructurings and/or recapitalizations in which the value of common shareholder equity will be either be completely wiped out or at least massively diluted. It’s important that investors not confuse bailouts of small- and medium-sized businesses with bailouts of publicly held corporations that trade on the stock market. Furthermore, it’s important that investors understand the difference between “bailing” out a company as a going concern (thereby preserving employment and production) and bailing out common equity shareholders. It’s likely that the former will occur, but the latter is likely to occur to a much lesser extent.
- There’s no free lunch.The massive increase in public and private debt plus the monetary debasement associated with the current and forthcoming bailouts and rescue packages (and their monetary financing) will be unprecedented – and this will have massive economic costs which will greatly impair US economic growth going forward. Long-term earnings growth will be impaired and risk premiums used to discount future earnings will increase. Therefore, this crisis will result in a long-term loss of economic value and/or wealth. As a consequence of this, there will be a massive decline in the valuations of US equity shares going forward.
In sum, even though government fiscal and monetary stimulus will certainly ameliorate some of the loss of common equity shareholder value that will occur as a result of the current and forthcoming economic crisis, the likely loss of aggregate common equity shareholder value is very likely to be enormous. Indeed, the aggregate loss of intrinsic shareholder value (not just market value) is likely to be far greater than that experienced in any crisis since the Great Depression.
Risk of Another Depression?
There’s a rapidly-increasing risk that the situation could devolve into something more similar to a scenario similar to the “Extremely Severe” bear market that was associated with the Great Depression. In studying the stock market declines associated with the Great Depression, you will note that the peak-to-trough stock market decline associated with the Great Depression passed through two major price cycles prior to reaching the ultimate trough. The first bear market cycle phase began in September of 1929, accelerated with the Crash of October 1929 and finally established a trough in December of 1929. Please note that, up until that point, the bear market associated with the October 1929 Crash was “merely” classified as “severe.” Indeed, starting in December of 1929, a substantial bull market developed, as investors at that time expected the crisis to be short-lived. However, by April of 1930, it became clear that the economic and financial crisis would become prolonged and a second – and much more terrible – bear market phase began which resulted in a US equity market decline of more than -80%. This second bear market phase associated with the Great Depression occurred between April of 1930 and June of 1932.
My Current Base Case Scenario Forecast
My current expectation is that the US equity market will establish an intermediate trough sometime in the next two months which will be situated in the “severe” range. This situation would be analogous to the first major leg (September 1929 to April 1930) of the massive stock market declines associated with the Great Depression.
However, (keeping the Great Depression analogy in mind) if effective epidemiological, economic and financial solutions cannot be devised and implemented by August of 2020 (or market participants expect that solutions will not be forthcoming), I expect the current bear market to transition into the “extremely severe” category (as occurred after April of 1930). A transition into the “severe” category would imply that the US Equity market declines associated with the COVID-19 economic crisis would ultimately be significantly more severe than those of the 2007-2009 bear market (the most severe of the bear markets classified in the “severe” category). In such a scenario, I would expect the S&P 500 to ultimately reach a trough below 1000.
However, my “base case” currently assumes that effective epidemiological, economic and financial solutions can be put in place by August 2020. In this scenario, I would expect the current bear market cycle may trough in the “severe” range – i.e. between 1876 and 1464. This implies a minimum decline of 26% relative to Friday’s closing value on the S&P 500 index. However, it should be noted that, for reasons described above, this scenario can arguably be considered to be somewhat optimistic.
Finally, it should be noted that this method of analysis this is just one of several scenario analyses which I have performed. However, all other methodologies yield similar results. For example, scenario analyses based on valuation metrics yield similar results.
Conclusion
Investors urgently need to implement a portfolio strategy which is designed to effectively deal with the forthcoming economic crisis and the associated severe or extremely severe bear market. Investors stuck in old and irrelevant patterns of thinking – i.e. investors that do not understand the severity of the forthcoming economic and financial crisis and that “this time is different” – will be severely punished and will suffer tremendous losses of wealth and income.
Wise investors must devise their portfolio strategy plan quickly and decisively, because the second leg of the current bear market is soon at hand.
If you are the type of person that is keen to take advantage of a once-in-a-decade opportunity created during this extraordinary economic crisis, subscribing to Successful Portfolio Strategy is something you should really consider.
It is critically important that you have the right portfolio strategy to deal with the current unprecedented economic and financial crisis. Successful Portfolio Strategy will provide you with the knowledge and the tools that you need to put a winning portfolio strategy in place and successfully manage its practical implementation. Please note that one of my two portfolios in the service is up over 1,000% since the crisis began.
Disclosure: I/we have no positions in any stocks mentioned, and no plans to initiate any positions within the next 72 hours. I wrote this article myself, and it expresses my own opinions. I am not receiving compensation for it (other than from Seeking Alpha). I have no business relationship with any company whose stock is mentioned in this article.
Additional disclosure: All positions are disclosed in Successful Portfolio Strategy model portfolios.
Worst yet to come as coronavirus takes its toll on auto sales
PUBLISHED WED, APR 1 20206:31 PM EDTUPDATED WED, APR 1 20208:19 PM EDT
KEY POINTS
- S. new vehicle sales were expected to have declined about 40% in March, according to J.D. Power.
- This year’s sales could return to near-recession levels of 12.1 million to 14.8 million due to the coronavirus, the firm says.
- In states such as Pennsylvania and Michigan, stay-at-home orders have halted all new vehicle sales.
The coronavirus, led by stay-at-home regulations, brought U.S. vehicle sales to a grinding halt in many areas of the country and the worst is still yet to come, according to industry officials.
Any sales gains achieved in January or February by automakers were essentially erased last month as sales fell off a cliff as some states banned dealers from even conducting online sales due to COVID-19. The orders, until lifted, are expected to continue taking their toll on the auto industry going forward.
“Our expectation is that it gets worse from here,” Cox Automotive Chief Economist Charles Chesbrough told CNBC on Wednesday as the majority of automakers reported substantial sales declines for March and the first-quarter. “The news is going to get really bad.”
What was expected to be a down, yet still robust, sales year of about 16.5 million to 17 million vehicles could return to near-recession levels of 12.1 million to 14.8 million, according to J.D. Power.
“Clearly, there is significant economic damage occurring as we speak,” said Thomas King, president of the data and analytics division and chief product officer at J.D. Power.
J.D. Power expects vehicle retail sales this month to decline by about 80% compared to April 2019 due to stay-at-home orders and COVID-19′s overall impact on the economy and consumer confidence. Retail sales do not include sales to fleet customers such as the government or businesses.
Stay-at-home orders
In states such as Pennsylvania and Michigan, home of General Motors and Ford Motor, stay-at-home orders have halted all new vehicle sales. And even in states that continue to allow some retail sales, the markets have declined upward of 80% at the end of March, according to J.D. Power.
“The pace of decline on a daily basis has been accelerating throughout the month,” said Tyson Jominy, vice president of data and analytics at J.D. Power. “It was a small drop in the beginning … the exit rate for the month was down 66% on Saturday before falling 82% on Sunday.”
As of Wednesday, 39 states had enacted “stay at home” or “essential business” mandates that affect 265 million people, or 80% of the U.S. population, according to J.D. Power. That includes 25 states with full or partial bans on automotive sales.
The impact of COVID-19 was obvious Wednesday as many automakers reported double-digit sales declines for March. Overall, U.S. vehicle sales are expected to have declined about 35% to 40% in March, which is typically one of the best months of the year for automakers.
Final U.S. vehicle sales for March and the first quarter were not available Wednesday as automakers continue to report results.
Rapid recovery?
If the stay-at-home orders are lifted, there “is a chance” for a rapid recovery and the auto industry going back to “something resembling business as usual,” according to King.
However, another scenario, is the orders remain in place into the summer and continue to cripple the automotive industry — and the broader economy.
Last week, a record 3.3 million people filed for jobless benefits. Economists are predicting another record wave this week as well, with predictions averaging between 4 million and 5 million. The longer this situation persists, the worse it will be for the recovery.
“This is a very, very difficult environment,” said King, adding demand for vehicles will be “depressed” and fall between 10% and 13%. “Fundamentally, demand will not get restored to pre-virus levels until at least next year.
In addition to sales, automakers across the country have shut down assembly operations due to COVID-19 and enacted emergency plans to save cash such as cuts to executive salaries, partially deferring pay for salaried employees and drawing down and establishing billions in new lines of credit.
Cox Automotive’ s Chesbrough said while the “second quarter is going to be a nightmare” for automakers, there are reasons for optimism in 2020.
“Once we get through this, there’s a lot of ingredients to suggest that we could see a very strong V-shaped recovery,” he said, adding cash flow for the automakers is “going to be critical.”
Chesbrough cited the government’s $2 trillion stimulus package, 0% federal interest rates and low gas prices as some reasons in addition to millions of returning lessees and automakers offering special financing options and discounts as reasons to be optimistic.
Cox Automotive has not yet revised its U.S. vehicle sales for the year. Prior to the coronavirus, the company was forecasting sales of 16.7 million in 2020.
China hid extent of coronavirus outbreak, US intelligence reportedly says
PUBLISHED WED, APR 1 202012:15 PM EDTUPDATED WED, APR 1 20207:24 PM EDT
Kevin Breuninger@KEVINWILLIAMB
KEY POINTS
- The Chinese government has deliberately underreported the total number of coronavirus cases and deaths in the country, the U.S. intelligence community told the White House, a new report says.
- Bloomberg, citing three U.S. officials, reported Wednesday that the intelligence community said in a classified report that China’s public tally of COVID-19 infections and deaths is purposefully incomplete.
- The secret report concludes that China’s numbers are fake, two of the officials said, Bloomberg reported. The White House received the report last week, according to the news outlet.
The Chinese government has deliberately underreported the total number of coronavirus cases and deaths in the country, the U.S. intelligence community told the White House, a new report says.
Bloomberg, citing three U.S. officials, reported Wednesday that the intelligence community said in a classified report that China’s public tally of COVID-19 infections and deaths is purposefully incomplete.
The secret report concludes that China’s numbers are fake, two of the officials told Bloomberg. The White House received the report last week, according to the news outlet.
At a White House press briefing Wednesday, Trump said that “we have not received” any intelligence reports showing that China underreported its coronavirus numbers.
Still, Trump said that Beijing’s tally appeared “to be a little bit on the light side, and I’m being nice when I say that, relative to what we witnessed and what was reported.”
China has reported 82,361 coronavirus cases, data from Johns Hopkins University shows. That number is about half of the total cases confirmed in the U.S., which has become the country with the highest number of reported infections in the world.
Neither the White House nor the Chinese Embassy in Washington, D.C., immediately responded to CNBC’s requests for comments on Bloomberg’s report.
“You don’t know what the numbers are in China,” President Donald Trump said at a press briefing last week.
Market Recovery: Sooner Than Most Expect
Apr. 2, 2020 9:01 AM ET
Summary
Sentiment and positioning are exceptionally one sided.
Almost everybody thinks we will break the March lows.
Insiders continue buying equities at a record pace.
We identify the path forward for equities.
In the last few weeks we have had an immense urgency to get market updates out in a timely fashion. Outside the desire to inform investors as to what’s happening, we are acutely aware that even the small lag between starting to write an update and finishing it is sometimes making a lot of the data outdated. For example, since Feb. 24, 2020, we have had eight market openings with a gap of more than 3% lower. The total such 3% gap-down openings over the last 20 years is 19. That level of pandemonium has made even the most stoic investors nervous, and we don’t blame them one bit. But nervousness aside there are some reasons to be a bit positive even in the giant sea of red. We examine the current situation and give you our take.
The quarter that should be forgotten
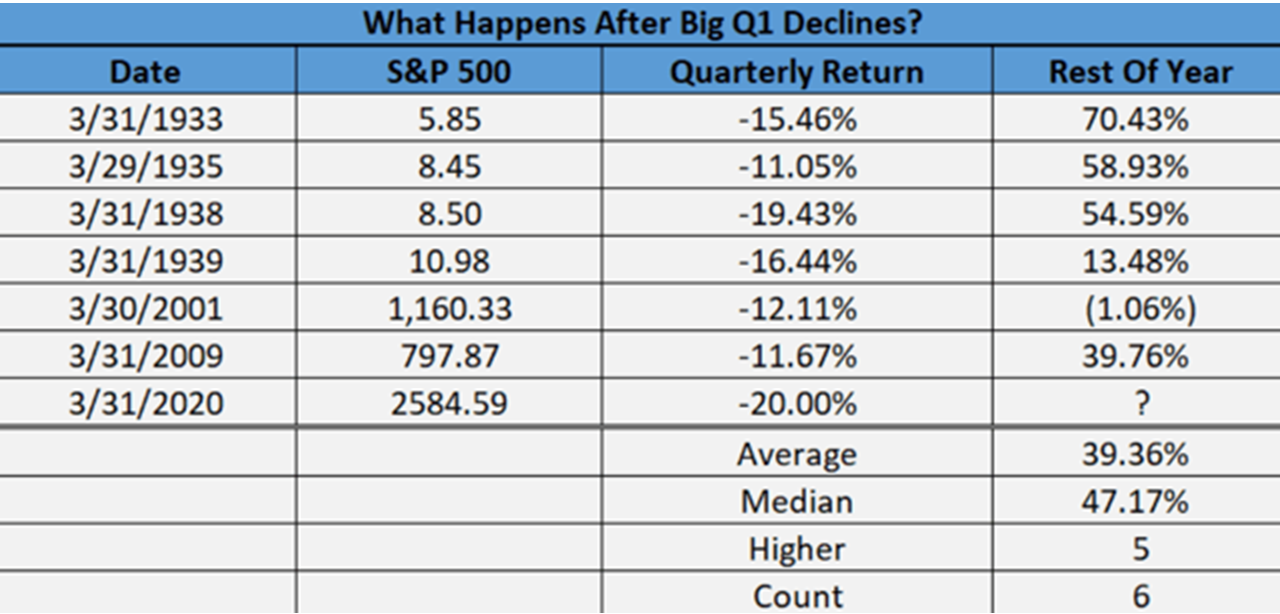
In case March felt like an eternity, you are not alone. Even after the furious rally off the bottom, Q1-2020 had a total decline of 20%. First quarter declines of big magnitude are rare as a lot of money historically comes into the market at that point. When we do have a decline of greater than 10%, the rest of the year has actually done quite well with one meager exception.
Source: Ryan Dettrick
Who Is Buying And Who Is Not Buying The Recovery
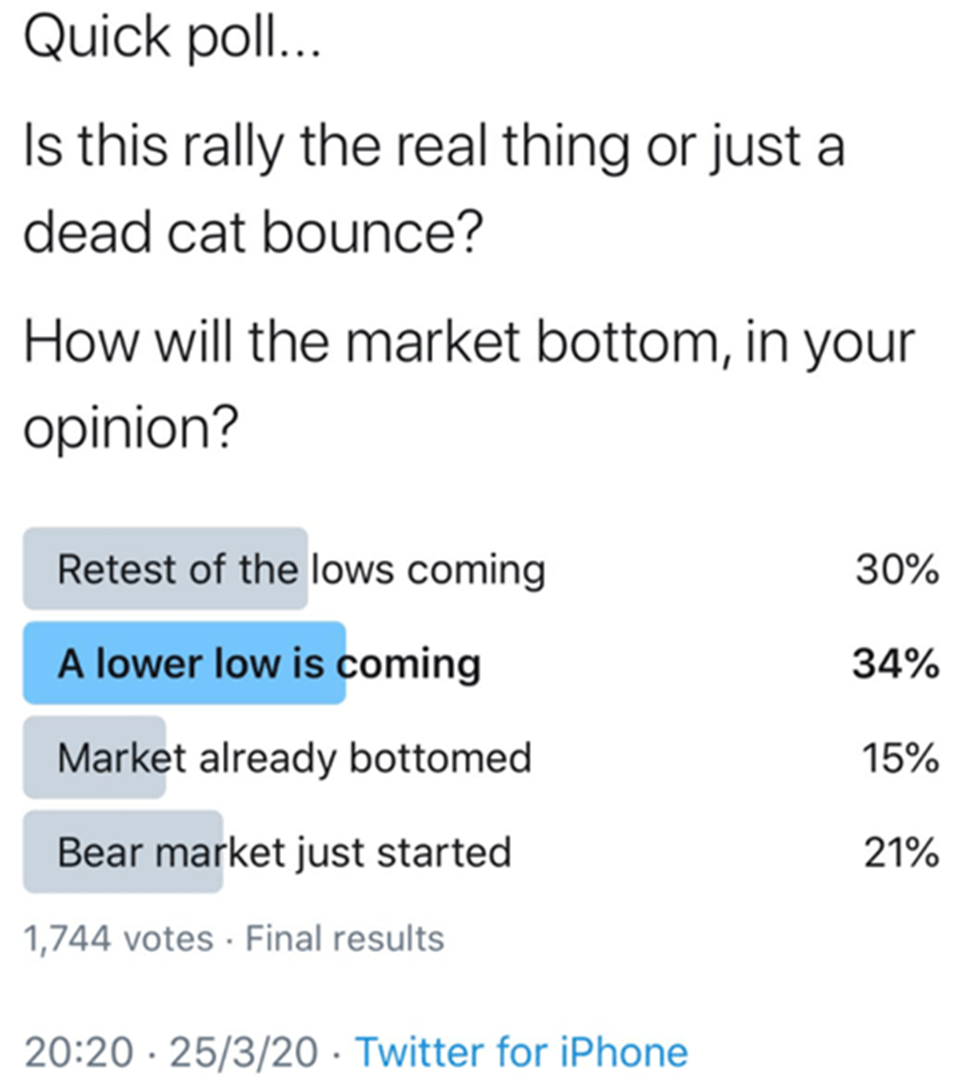
Even after today’s decline the indices are notably off their worst levels seen in the middle of March. It’s a good point to gauge as to who thinks this recovery is for real vs. who believes that we have far lower to go. The general public is strongly bearish. In a rather small but unscientific poll, 85% expected lower prices in some shape or form.
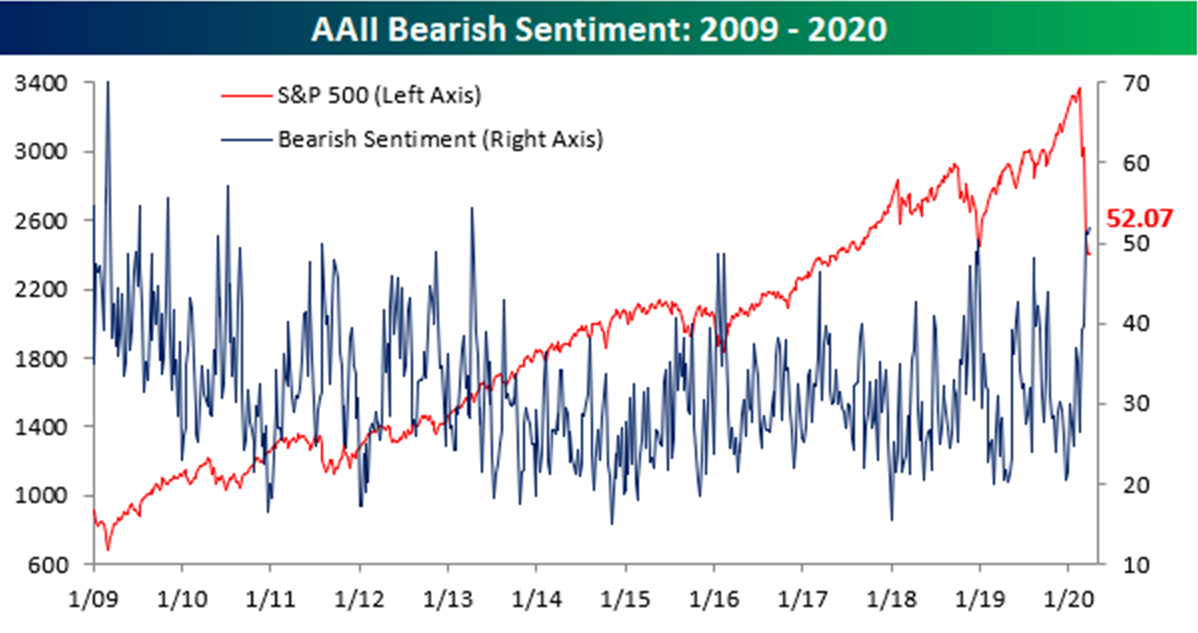
Only 15% thought the bottom was in. The small investor is decidedly negative as well, although 2009 saw spikes of even higher levels which finally marked major bottoms.
Source: Bespoke
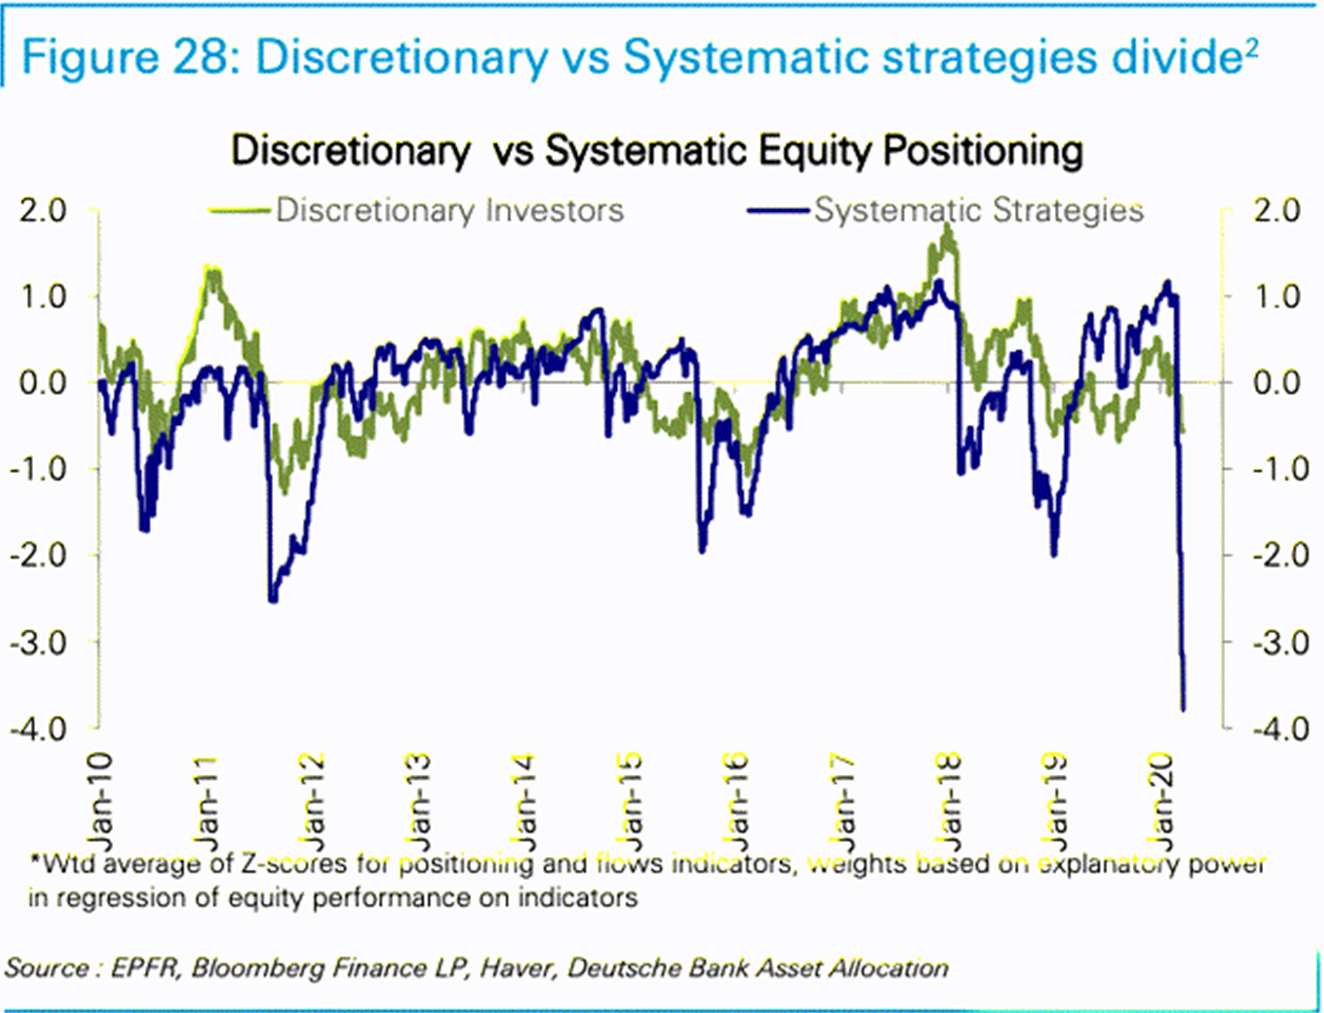
The managed money crowd could not run away fast enough from equities. Systematic equity positioning dropped to an all time low and was so far below its previous troughs that even a small mean reversal could power the markets much higher.
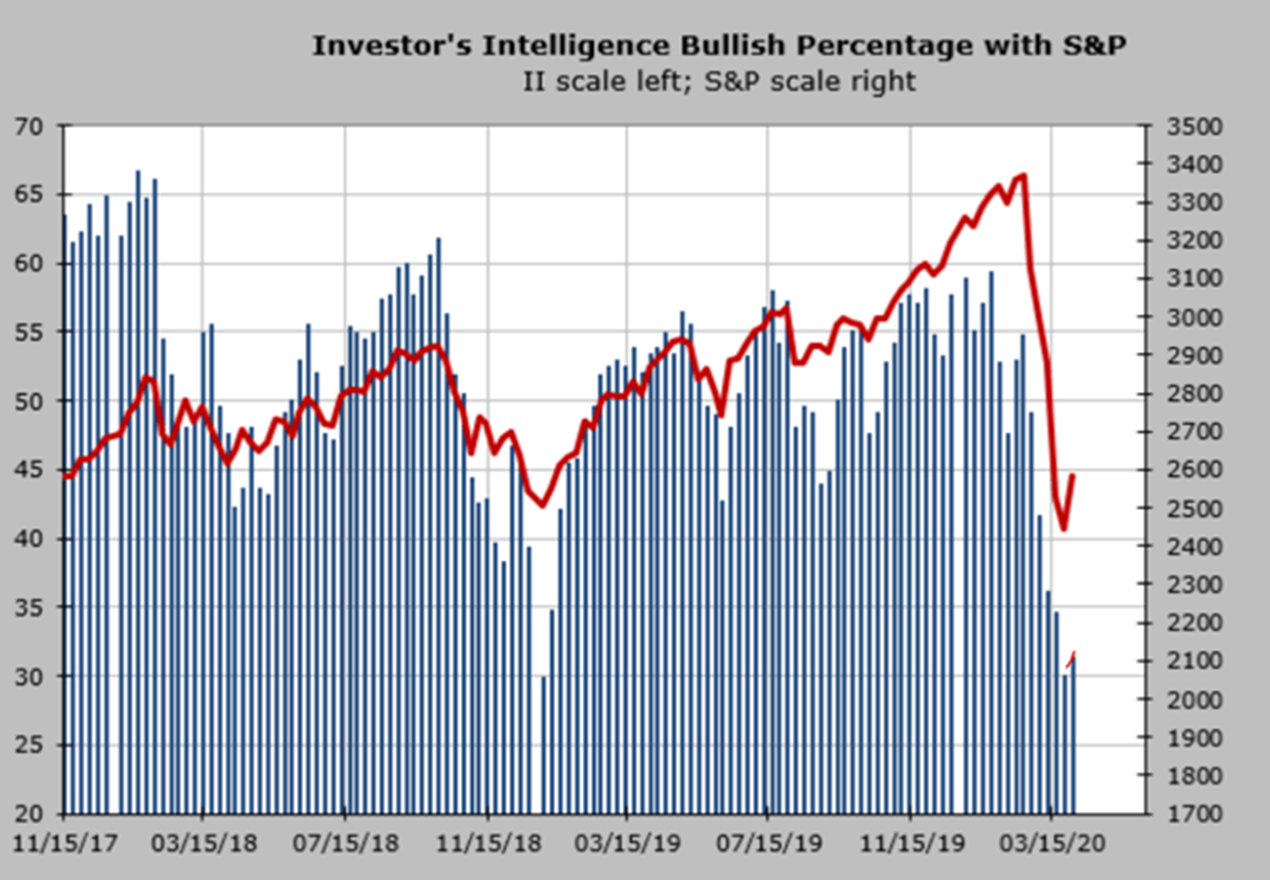
Investor Intelligence surveys also shows the gloom and pretty much the thinking is that this is a temporary bounce that will be followed by more punishment.
Source: Investor’s Newsletter Survey
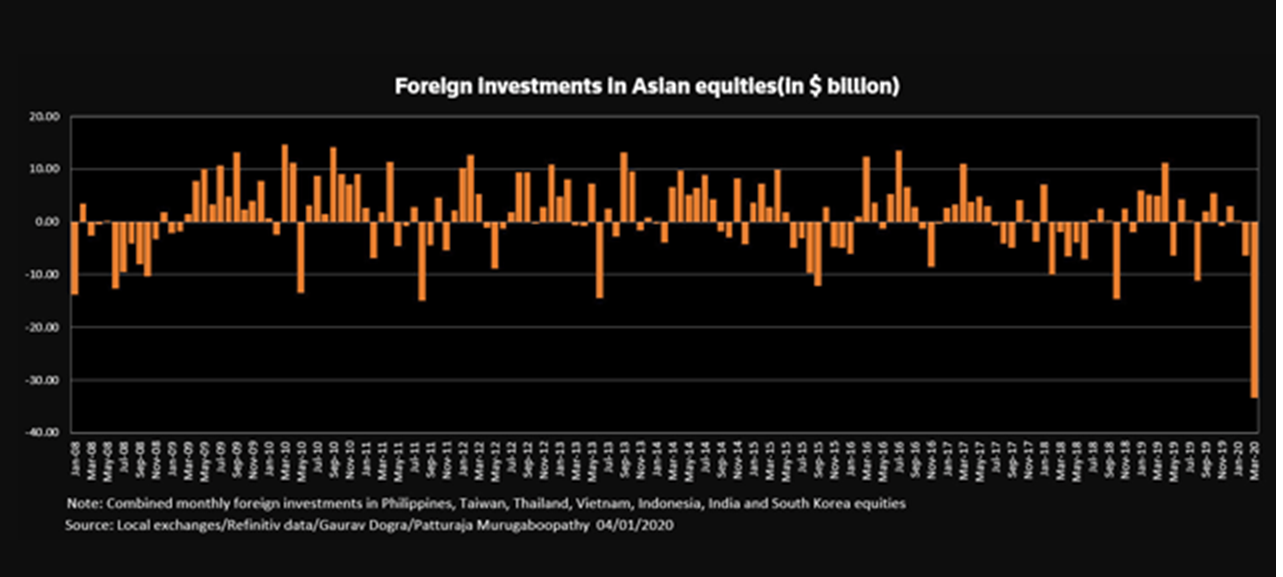
The fear has gone global and is not just confined to the developed markets. Investors pulled out more than three times the money from emerging markets than they did in any one month during the global financial crisis.
Source: Reuters
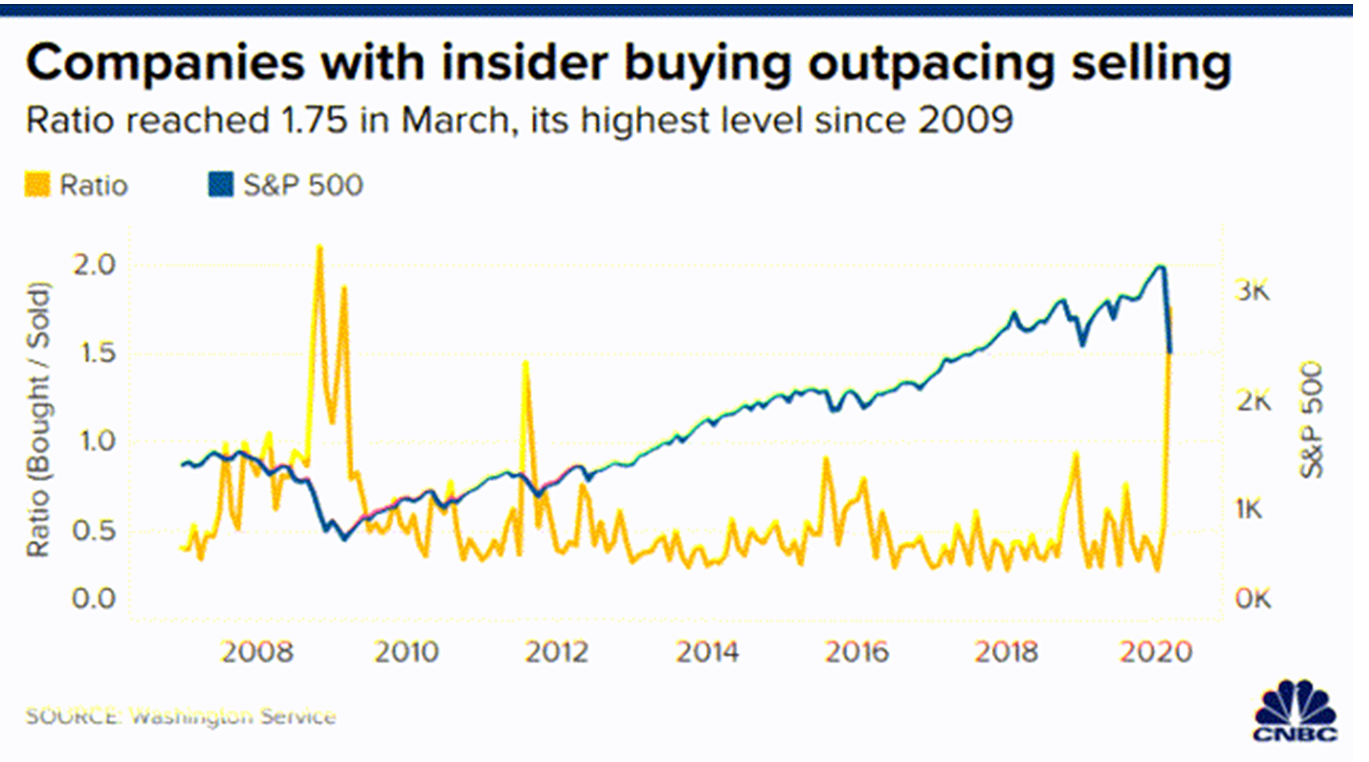
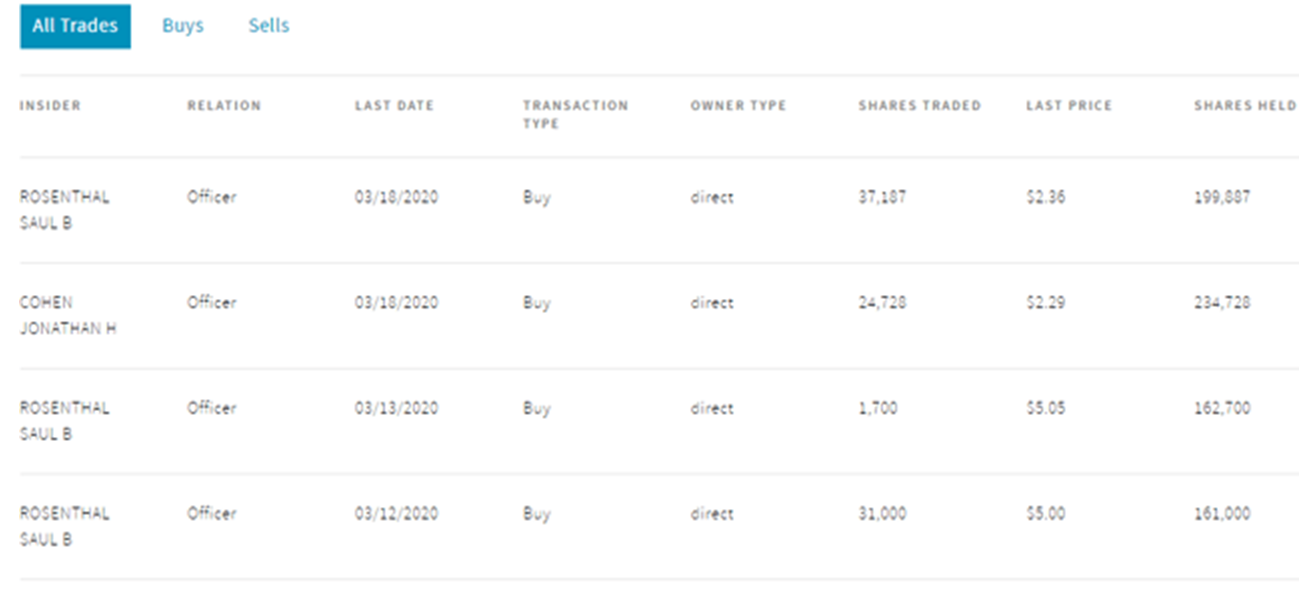
On the other hand corporate insiders are just not buying into the gloom and doom and their buying activity remains strong.
High dividend stocks with notable insider buying include Oxford Lane Capital (OXLC), Pennant Park (PNNT) and Energy Transfer (ET), Newtek (NEWT), Ares Capital (ARCC), and The GEO Group (GEO), among others.
Below is the insider activity chart of OXLC.
Source: Nasdaq
Below is the insider activity chart of PNNT.
Source: Nasdaq
Insiders can be early, and if we examine the spikes in buying activity, they have often coincided with the initial bottom and not the retest. But they know the impact on their company’s activity and clearly they are not seeing cause for alarm that everyone else is. They also have a better gauge on the pulse of the economy and possible changes to lockdown scenarios by the administration. Their unbridled bullishness is possibly one indicator that suggests the bottom might be in or we won’t go much lower than the March lows.
The Virus
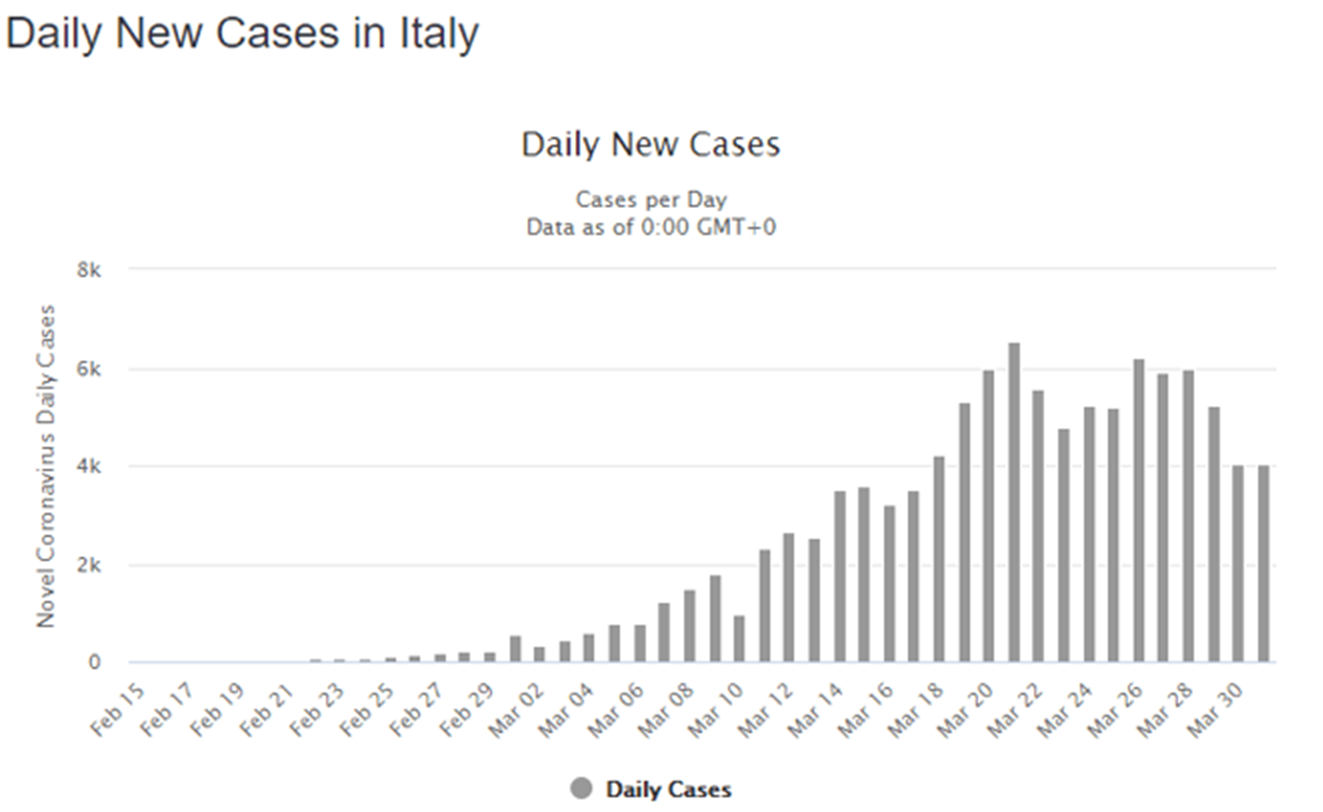
In an earlier report we had talked about JPMorgan (JPM) predicting a peak in Italian cases in the week of March 18-March 25. That peak came right on schedule on March 21. Equally important, the rate of growth has fallen rather markedly when computed as a percentage of total cases.
Source: Worldometer
On March 14, a few days after the lockdown, total known cases were growing at almost 20% a day. Today that number is close to 4% and continues to fall. Now this is to some extent a law of large numbers at play, but it also portrays the difficulty the virus has of transmitting once the population takes countermeasures.
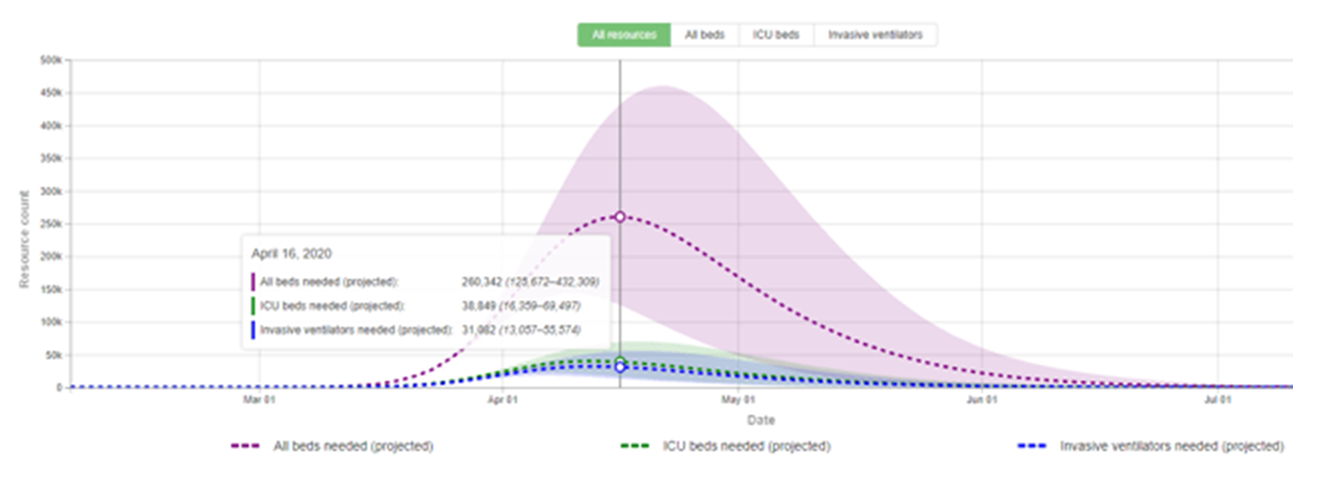
In the U.S. the peak resource usage is projected to be April 16.
Source: HealthData
Of course, from an investing standpoint people are wondering as to how long the measures will stay in place.
Serology tests might make it easier to end restrictions
One possible glimmer of hope comes from the progress on serology tests. Two different serology tests have been rolled out in the U.S. with plenty more on their way here and around the world.
BD Integrated Diagnostic Solutions president Dave Hickey said: “Serology tests are important because they provide an additional piece of information to aid in characterizing possible prior exposure to SARS-CoV-2, especially since many infections are mild or asymptomatic in severity.
Initial evidence suggests that nearly all patients infected with SARS-CoV-2 will have developed a detectable antibody response within days of symptom onset, at which time a negative serologic test along with molecular diagnostics could be helpful in ruling out Covid-19.”
The test can analyze blood, serum or plasma samples for the presence of immunoglobulin M and Immunoglobulin G antibodies related to SARS-CoV-2.
Source: Medical Device Network
These tests could identify who possibly has had a sub-clinical infection and developed immunity to the virus. This would allow a larger percentage of the population to return to some semblance of normalcy.
Why do we believe that the percentage of infections is far higher than the official case numbers? We don’t know for sure, but we are seeing the anecdotal evidence piling up. First, we had Iceland’s mass testing showing half of those who tested positive showed no symptoms at all. Second, because of the constraints on testing, Italy and Spain are not even testing patients with less than moderate symptoms. Third, NBA players who were likely able to get far ahead in the line to get tested showed a rather remarkable 13% positive rate. Is it possible that the level of infection in that small population is so much higher than the general population? We think that’s possible, but the more probable reality is that sub-clinical infections are several times the size of clinical infections.
Market Bottom Based on Insider Buying
When all the experts and forecasts agree — something else is going to happen.” Bob Farrell
We certainly have a giant consensus that the virus will take long to resolve and markets are done for the foreseeable future. The insiders appear to be a tiny group that is dissenting and historically they are very close to the bottom price wise but 3-4 months early on a timing basis. . Based on that, we could put in a final bottom sometime in June before rocketing higher. There are quite a few unknowns at present and markets hate uncertainty. A faster resolution than the one we outlined will take either a treatment that prevents moderate symptoms from becoming severe or a serology test that confirms the suspicions of many epidemiologists.
Conclusion: Remain Hopeful, the Pain Will Soon End.
It suffices to have a look at the chart below posted by FT.com on April 1 to have plenty to hope for.
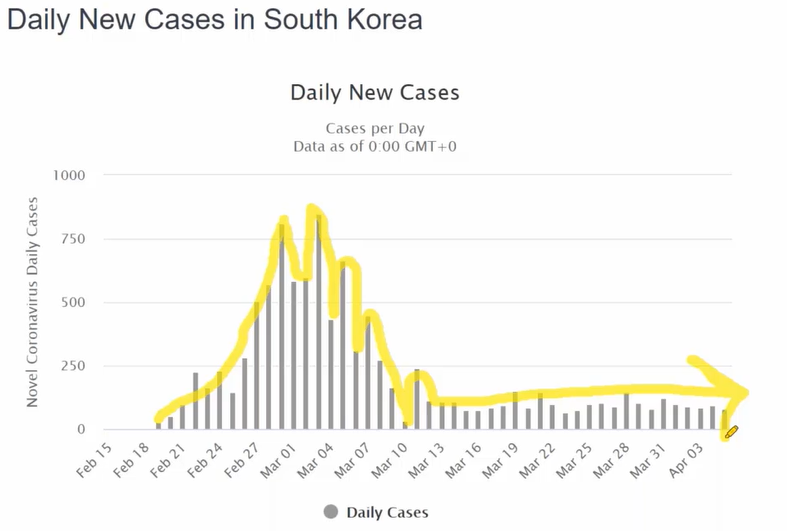
In China, the virus curve shows that the pandemic is most likely coming to an end. In the United States, a peak is projected in two weeks. In few more weeks the charts will look similar to that of China today. We suspect that the markets could move significantly higher once we have a confirmation that we are close to a peak.
In these difficult days, it’s easy to lose hope. Keeping an objective perspective of the situation can help overcome fears. Relief is most likely sooner than most expect.
Thanks for reading! If you liked this article, please scroll up and click “Follow” next to my name to receive our future updates.
Disclosure: I am/we are long OXLC, PNNT, ARCC, NEWT, GEO, MRCC. I wrote this article myself, and it expresses my own opinions. I am not receiving compensation for it (other than from Seeking Alpha). I have no business relationship with any company whose stock is mentioned in this article.
Visa And Mastercard: Minimal COVID-19 Impact, Inflation-Resistant, And Attractive Valuations
Apr. 2, 2020 3:11 PM ET
Summary
Visa and Mastercard should face minimal impact from the Covid-19 outbreak. Pricing power is impenetrable.
Their business model is inflation-friendly, should it be caused by the 2.2T stimulus.
Valuations are attractive, and both companies remain excellent long-term holds.
You will often see investors praising quality stocks, but argue that they are too expensive. It makes sense, after all. Exceptional companies with outstanding records of shareholder value creation are often tied to a considerable premium. From time to time, whether a recession occurs, or unforeseen circumstances take place, great opportunities arise to buy quality merchandise when it is marked down, as Warren Buffett’s famous quote goes.
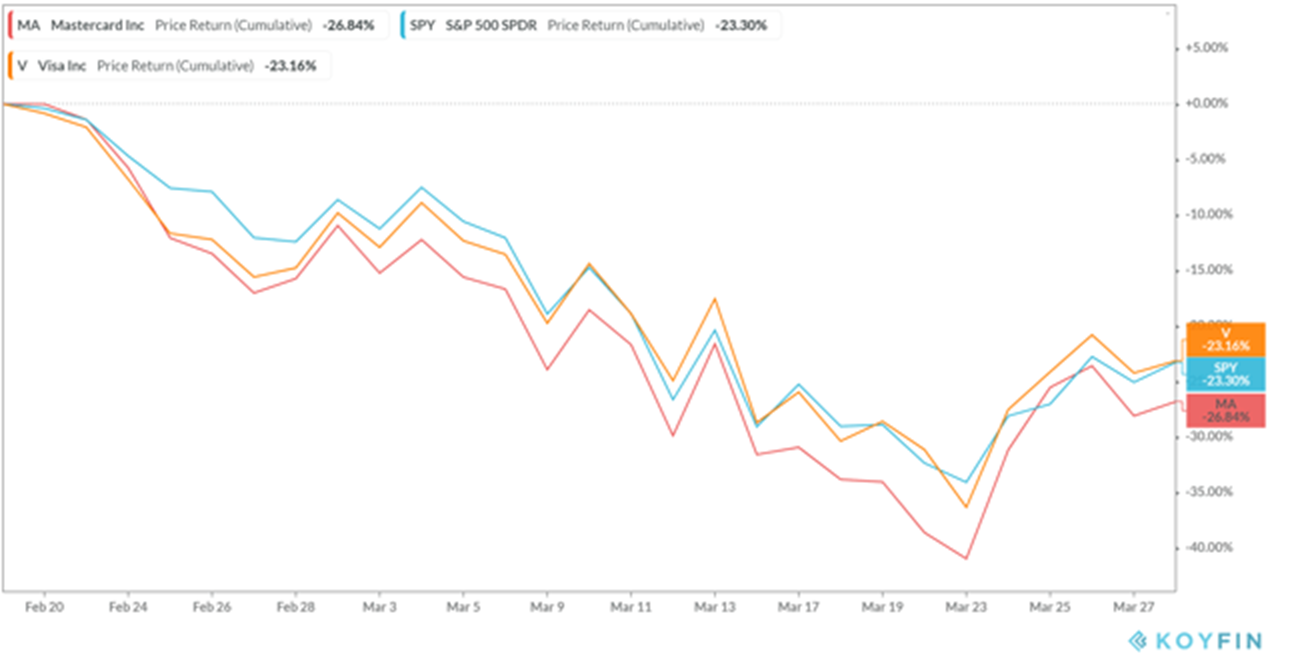
One such example is Visa(V) and Mastercard (MA). Shares saw their price drop as much as 37% and 42%, respectively, from their earlier highs. The declines, especially for Mastercard, were more violent than the overall market, part of which could be attributed to their premium valuation at the time. In my view, while shares have rebounded from their lows, I consider both stocks to be top-quality companies, whose current discount opportunity should not be missed.
Covid-19
With major economies around the world being shut down, consumer spending is expected to slow down over the next quarter or two significantly. Everyday transactions, like your daily coffee, should pretty much plummet. Therefore, on that part, payment processors like Visa and Mastercard should lose significant revenue amid less payment volume. On the other hand, a substantial part of that consumption shifts online, where processors still get their fees. While there is no doubt that processors’ previous guidance expectations are negatively affected, there are a few positive points to consider too.
1) Pricing power
Online transactions are more profitable. Keyed-in transactions (Using your card details to purchase something online) have a higher average processing fee to account for the higher risk. Since consumers favor online shopping amid safety and government restrictions, I expect that processors will average a higher fee per transaction completed.
- Pricing power remains invincible. Processing fees can be split into two sides—wholesale and markup fees.
- The first one is non-negotiable. This fee is identical no matter what processor you’re using. Credit cards usually carry a higher wholesale fee too. We have all seen customers emptying supermarket isles as they buy in bulk. There is a higher chanceof using a credit card, as a result of earning higher rewards, further boosting the processors’ wholesale volume. Moreover, since no additional cost is incurred to conduct these transactions, net profit margins are driven higher, further boosting profitability.
- Markup fees will vary depending on the processor. But this fee can be negotiated (e.g., firms with higher volumes can ask for lower fees). Card processors and payment gateways charge their own markup fees. Pricing power here remains strong, since Visa and Mastered essentially run a duopoly, with no competition to allow for pricing pressure.
2) Inflation
Last Friday afternoon, President Donald Trump signed into law a historic $2 trillion stimulus package to aid the American public and the US economy to fight the overwhelming spread of Covid-19. However, many investors and policymakers have expressed their worries. The question arises as to whether such a stimulus is “affordable,” and whether it will cause government debt crises and a subsequent rise in inflation. While a debt crisis would cause everyone trouble, on the inflation part, Visa and Mastercard have their investors’ back covered. In fact, the duo will never be impacted negatively by inflation. On the contrary, it will expand its profitability even further, since processing fees work on a percentage basis.
3) Dislike towards cash
Finally, a less impactful but potential effect of Covid-19 is the acceleration towards a cashless society. Physical cash loses ground to digital by the day, but it still remains a considerable share of total payments volume, at around 31%. Considering increased awareness towards hygiene and being a potential virus-carrying source, consumers should further deviate from wanting to touch physical cash. That could be an additional positive long-term driver for both Visa and Mastercard.
Attractive Valuations
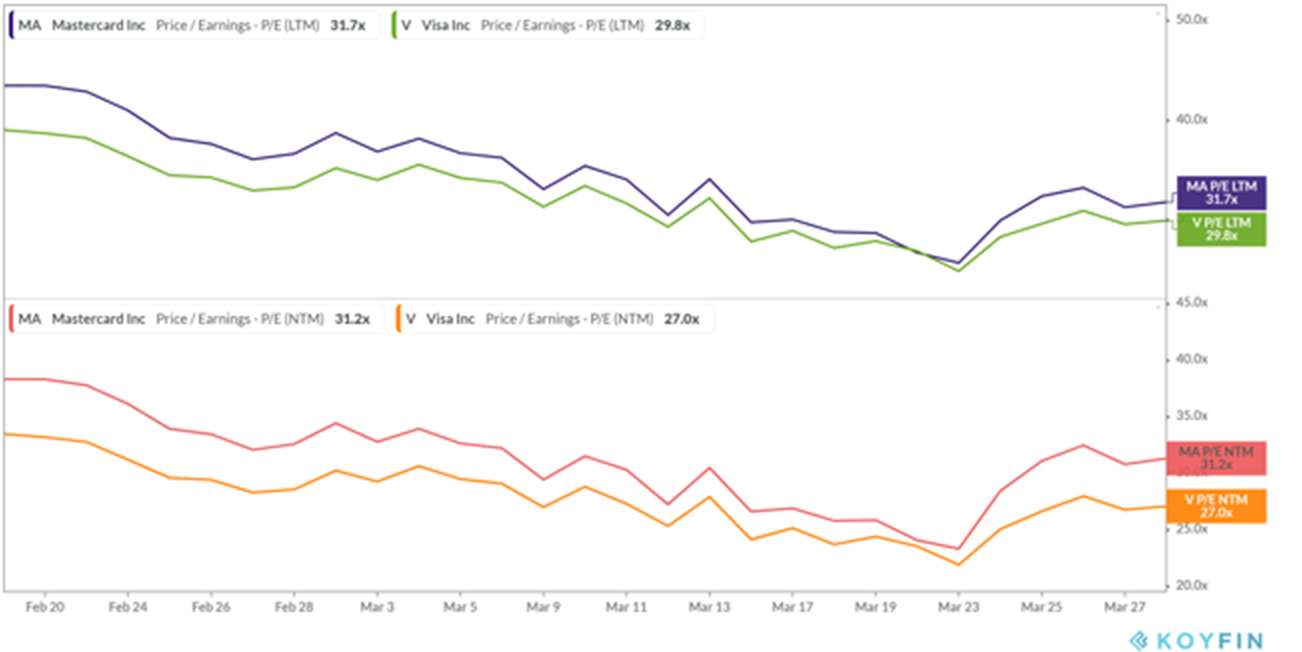
As I mentioned earlier, quality companies tend to trade at a premium, as demand for their shares remains strong. Visa and Mastercard have been no different. However, at their current valuations, they present an excellent long-term growth opportunity. Their current P/E ratios (Last Twelve Months) are 29.8 and 31.7 and respectively.
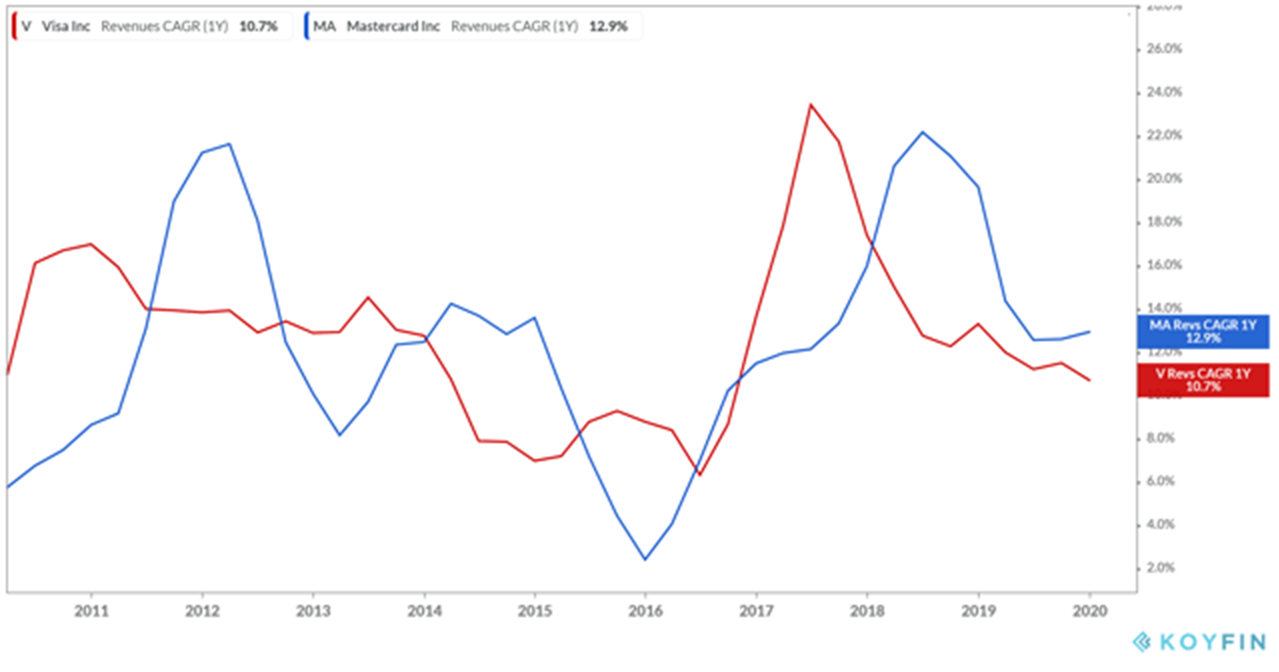
Let’s consider Mastercard’s updated guidance, for example. The company sees Q1 revenue growth in low single digits and a currency headwind impact at ~2%. Considering a low single-digit growth rate for this quarter, overall revenue growth for the year could still account for the north of 5%. Moreover, profitability should remain intact, as the company doesn’t need to take action (e.g., advertising) to fuel growth later on. The same should apply for Visa as well. Personally, I don’t see how a year of slightly less revenue growth justifies such a violent price drop. Therefore I see both companies trading at a significant discount at FPE of ~30, considering their well-known long-term growth prospects and impenetrable moat.
Finally, the price decline may even turn out to be beneficial for long-term shareholders. Both Visa and Mastercard have a unique love towards share buybacks. The companies have been aggressively canceling the shares out of the market, increasing their programs annually. As you can see in the graph below, both companies have reduced their shares outstanding by more than 30% over the past ten years. If anything, this period in time should allow management teams to scoop up additional shares on the cheap, further boosting EPS, and reducing forward PEs.
The future
Innovation is at the forefront of both Visa and Mastercard. The world has changed for the better through their fast networks that have made payments fast and secure for every business around the world. However, this doesn’t mean that they are not always focused on staying ahead of the competition in the fintech world. After all, since they are both used amongst the majority of electronic transactions, the synergies are flawless.
Earlier this year Visa acquired Plaid for slightly more than $5.3 billion. This is the company’s biggest acquisition excluding the €13B ($14B) acquisition for Visa Europe in 2015. Other recent purchases include Earthport, a cross-border payment company, Verifi, a company that helps other organizations reduce chargebacks and finally, Payworks, a company that provides gateway software for Point of Sale. The sequence of Visa’s purchases reveals a similar philosophy when it comes to potential synergies. They are back-end solutions, that while most people don’t know about, they are being used in our daily transactions. Plaid, for example, links the data of most of the banks and credit unions and sells to many fintech companies. Plaid’s technology is used to power many well-known fintech companies in the market. Examples include Venmo (PYPL), Acorns, Trim, and Lending Club (LC), Betterment, Wealthfront. The reason I like Visa’s acquisitions is that these kinds of solutions are used in the background, where Visa can build a powerful ecosystem of products to promote through its powerful brand and market leverage. Investors have been constantly discussing the idea of, say Visa purchasing Square (SQ), since it owned a small equity piece in the first place. However, Point Of Sale companies like Square, face fierce competition, since they operate on a very crowded space. Therefore Visa’s choice to pursue the digital ecosystem path is, in my view, the better road towards future growth.
Mastercard has followed a similar path, enriching its portfolio through a series of acquisitions. Last year alone, the company has purchased four companies, namely:
- RiskRecon, a leading third-party/vendor cyber risk solutions provider,
- SessionsM, a customer loyalty and engagement platform
- Transactis, which provides banks and merchants with SaaS-based billing, payment, and loyalty products, and
- Vyze, which offers solutions that enable retailers to offer more payment options for their customers.
Similarly to Visa, Mastercard has taken the digital path towards adding solutions for merchants and financial institutions that can unlock synergies with their processing networks. Considering their incredibly strong cash flows, I expect both companies to continue seeking more growth avenues through purchasing other firms. Staying pure digital seems like a wise choice as well.
Conclusion
All points considered, I believe that Visa and Mastercard are superb long-term holds that should suffer minimal impact amid Covid-19. Consumer spending is shifting towards digital in these times of self-isolation, but the two companies remain the leading processors to undertake these transactions, which can even attract higher fees. With robust pricing power and even an inflation-friendly business model, whatever shock the current outbreak may have on their income statements, should only be a temporary growth deceleration, on a much larger long-term growth story. At their current attractive valuations, I see both companies as attractive buys for investors who are willing to undertake potential short-term volatility.
Disclosure: I am/we are long V, MA. I wrote this article myself, and it expresses my own opinions. I am not receiving compensation for it (other than from Seeking Alpha). I have no business relationship with any company whose stock is mentioned in this article.


15 comments
Great blog right here! Also your web site lots up very fast!
What host are you the use of? Can I get your associate hyperlink in your
host? I wish my web site loaded up as quickly as yours lol
Hey, I think your website might be having browser compatibility issues.
When I look at your website in Chrome, it looks fine but when opening
in Internet Explorer, it has some overlapping.
I just wanted to give you a quick heads up!
Other then that, great blog!
Superb site you have here but I was curious about if you knew of
any message boards that cover the same topics talked about here?
I’d really love to be a part of group where I can get opinions
from other experienced people that share the same
interest. If you have any recommendations, please
let me know. Many thanks!
Normally I do not learn post on blogs, however I wish to say that
this write-up very pressured me to try and do so! Your writing
style has been surprised me. Thanks, quite great article.
Hello there! I could have sworn I’ve been to this site before but after browsing through some
of the post I realized it’s new to me. Nonetheless, I’m definitely delighted I found it and I’ll be book-marking and checking back often!
Hello would you mind letting me know which webhost you’re working with?
I’ve loaded your blog in 3 completely different browsers and I
must say this blog loads a lot faster then most. Can you recommend a good
hosting provider at a honest price? Cheers, I appreciate it!
WP Engine is who I run all my blog posts through
I’m not that much of a internet reader to be honest but your sites really nice, keep it up!
I’ll go ahead and bookmark your website to come back in the future.
Cheers
It’s enormous that you are getting ideas from this piece of writing as well as from our dialogue made at this place.
Hi there! I know this is kinda off topic but I was wondering which blog
platform are you using for this site? I’m getting sick and tired
of WordPress because I’ve had issues with hackers and I’m looking
at options for another platform. I would be fantastic if you could point me in the
direction of a good platform.
I’m currently using WPEngine an it seems better than a typical wordpress standard blog site
Spot on with this write-up, I really think this site needs much more attention. I’ll probably be back again to read more, thanks
for the info!
It is in point of fact a great and useful piece of information. I am glad that you shared this useful info with us.
Please keep us up to date like this. Thank you for sharing.
Wow, marvelous weblog layout! How long have
you ever been running a blog for? you made blogging look easy.
The entire look of your website is great, let alone
the content!
It’s remarkable for me to have a web site, which is helpful designed for my knowledge.
thanks admin