
HI Market View Commentary 03-24-2025
Market uncertainty has led us to be more nimble in moving protection around
We want to have “some” protection in place instead of not enough
When you short a call option, you are obligated to deliver the underlying stock if the option is exercised, but you are not entitled to any dividends paid on that stock, instead, you are responsible for paying the dividend to the buyer who exercised the call.
Here’s a more detailed explanation:
- Short Call Obligation:
When you sell (or “write”) a call option, you are obligated to deliver the underlying stock if the buyer of the call (the long call holder) exercises their option.
- Dividend Risk:
If the stock pays a dividend while you are short the call, and the option is exercised before the ex-dividend date, you will be required to deliver the stock, and the long call holder will become the owner of the stock and is entitled to the dividend.
- Paying the Dividend:
As the short call writer, you are responsible for paying the dividend to the long call holder, who now owns the stock.
- Ex-Dividend Date:
The ex-dividend date is the date on which the stock price drops by the amount of the dividend. If you are assigned to deliver the stock before the ex-dividend date, you are responsible for paying the dividend.
- Why you don’t receive the dividend:
Because you are obligated to deliver the stock to the long call holder, and they are now the owner, they are entitled to the dividend, not you.
Are Investors Short a Dividend-Paying Stock Entitled to the Dividend?
Updated May 12, 2024
Reviewed by
Fact checked by
Shareholders may buy a stock in part to collect dividend payments. Dividends are profits distributed to equity owners, and shareholders of dividend-paying firms are eligible to receive them as long as they own the stock by the ex-dividend date.
But what happens if you sold short a dividend-paying stock? Read on to learn the answer.
Key Takeaways
- Shareholders of dividend-paying companies as of the record date are entitled to collect declared dividends.
- If, however, you are short a dividend-paying stock, you are not entitled to receive the dividend and must pay it instead to the lender of the borrowed shares.
- If you sell short a dividend-paying stock after its record date, you are not responsible for paying a previously declared dividend.
https://www.briefing.com/the-big-picture
The Big Picture
Last Updated: 21-Mar-25 07:06 ET | Archive
Stock market forced into second-guessing the outlook
Column Summary:
*Market Uncertainty: Tariffs and spending cuts have shifted market focus from tax cuts and deregulation.
*Economic Indicators: Mixed signals from jobless claims, copper prices, and yield curves complicate economic outlook.
*Investment Shifts: Defensive sectors outperform, and foreign markets gain as U.S. market volatility increases.
The stock market’s thinking heading into 2025 was that the outlook glass is half full. Economic activity would be improving under a new administration pushing tax cuts and deregulation. That push hasn’t changed. The problem is that tariff actions and government spending cuts have been pulled forward on the list of policy priorities.
Consequently, the stock market has been forced to consider the possibility that the outlook glass may be half empty, as the politics of the day have stirred concerns about an economic slowdown upending a previously full earnings growth outlook.
Corrections Among Us
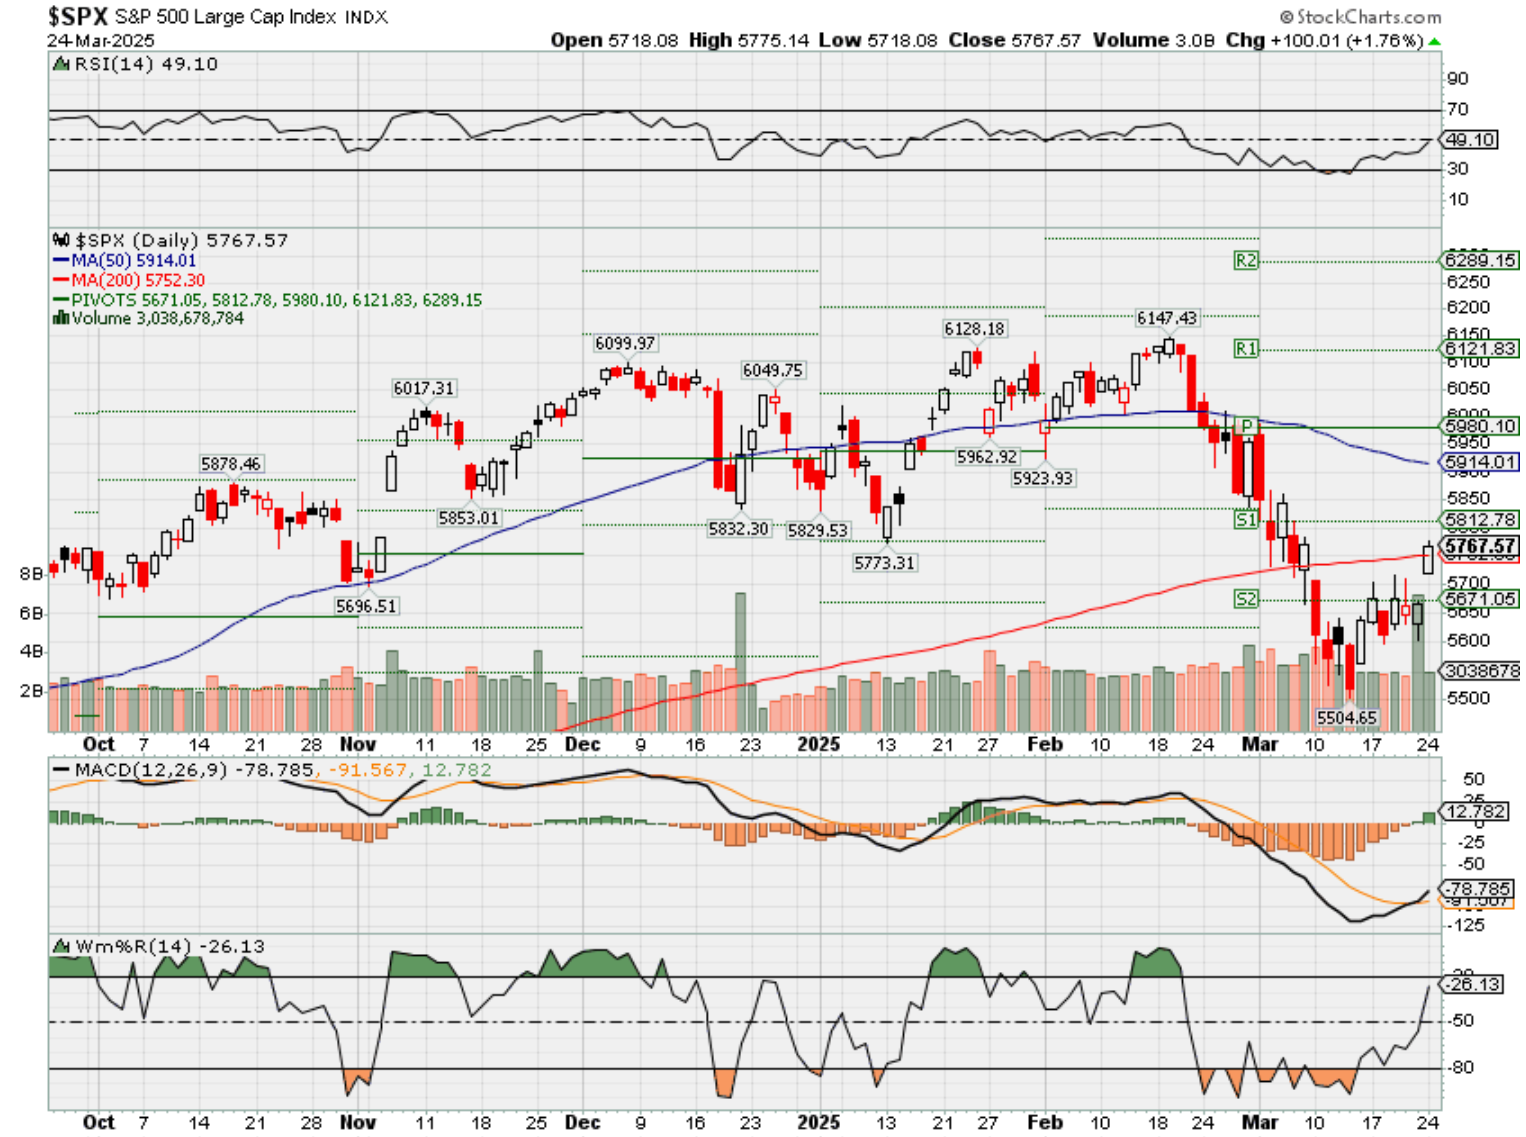
The first quarter has had its highs and lows. The S&P 500 hit an all-time high on February 19, which left it up 4.5% for the year. By March 13, it had fallen as much as 10.5% from that high and was down 6.4% for the year.
The sudden reversal was precipitated by tariff and counter-tariff announcements, an unwinding of the momentum trade, and a stark sell-off in the “Magnificent 7” stocks. This all occurred at a time when Treasury yields were falling, which was a reflection of the market’s burgeoning growth concerns, and European and Asian equity markets were posting robust gains, which was a reflection of rebalancing activity driven by a recalibration of the U.S. exceptionalism view.
The cumulative effect of the selling resulted in corrections for each of the major indices (a correction is typically defined as a pullback of 10-20% from a prior high).
Some Offsetting Positions
The pullback led to a compression in P/E multiples as stock prices fell faster than earnings estimates. Strikingly, the forward 12-month earnings estimate didn’t fall at all. It stood at $274.47 on February 19 and today it sits at $277.54, according to FactSet.
It has been a peculiar divergence — one that suggests this “correction” is either only a price correction from an overvalued state or a sign of worse things to come for earnings estimates on account of a weakening economy.
The latter narrative is not without its challenges.
- High yield credit spreads, which would widen rapidly on the specter of recession, or an actual recession, don’t convey such concerns.
- The futures price for copper, which has extensive end uses in industrial applications, has surged 27% year-to-date as of this writing.
- Initial jobless claims — a leading indicator — are tracking at levels that are consistent with a solid labor market and an economy on a positive growth trajectory.
Still, worries about the growth outlook have been apparent in other ways:
- The spread between the 3-month T-bill yield (higher) and the 10-yr note yield (lower) has inverted.
- The counter-cyclical health care, utilities, and consumer staples sectors have exhibited relative strength over the last month.
- The futures price for oil, which has extensive end uses for consumer and industrial applications, has dropped 6.5% year-to-date as of this writing.
Are these the only discrepancies? No. These offsetting positions, though, speak to a market that can’t determine if the outlook glass is half full or half empty. That indeterminate state has led to some fitful trading conditions for a market that had been priced only for good things happening.
Coming Months Are Integral
The mere idea that there could be an important economic shift afoot has been disruptive for the bull market. The linchpin right now are earnings estimates. They are holding up despite companies starting to sound a more cautious tone on the outlook because of the uncertainty generated by tariff policies and the strain consumers — particularly low-end consumers — are feeling from elevated price levels across a host of goods and services.
Fed Chair Powell observed, however, that the “hard data” is still pretty solid and has yet to fully reflect the weakening levels of consumer and business confidence that have been apparent in “soft” survey data. In other words, what consumers and businesses are saying isn’t matching up with what they are doing. They have been more negative with their thinking than with their spending.
Mr. Powell added that the Fed is focused on the hard data and that, if the soft data is going to affect the hard data, we should know it very quickly.
The coming months, then, will be integral to the earnings estimate trend, not only because we are roughly three weeks away from the start of the first quarter reporting period, but also because we will know more about the impact of the tariff policies that have been put in place, more about government spending cuts, and more about the level and scope of reciprocal tariffs implemented by the U.S. come April 2.
A risk being run by the new administration is that the tariff policies overshadow its work to cut regulations and extend the 2017 tax cuts. That is the case now, but it will worsen if the economy rolls over on account of the tariffs and diminishes the influence of tax cuts, assuming the GOP can reach an agreement to extend the tax cuts without adding to the deficit. The former may ultimately be dependent on the latter. It is a delicate proposition amongst GOP members.
Briefing.com Insights
The investing environment has gotten more challenging — quickly. The economy coming into the year was expected to pick up pace while inflation was expected to keep falling. Now, the market narrative features talk of stagflation with growth faltering and inflation rising, both of which could give way to a weakening labor market if they persist.
The price action has turned more defensive in the stock and bond markets, investor sentiment has been reined in appreciably, and the “Magnificent 7” has been anything but magnificent, which has applied a lot of downward pressure on the market cap-weighted indices.
Small-cap, mid-cap, large-cap, and mega-cap proxies are all down for the year; the low volatility factor has drastically outperformed the high-beta factor; value is outperforming growth; and foreign markets are outperforming the U.S.
That is all happening after a tremendous year in 2024 when everything seemed to go the market’s way, and every dip was bought without question. Well, there are questions now because there are no clear answers about the economic outlook like there seemed to be after the election when investors were focused on less regulation, friendly tax policy, and a “Trump put” that has been talked down by the president himself.
The focus is now on tariffs and spending cuts, because the new administration has made it so. It is all politics, which we said the market would be playing in 2025 for better or worse. Things could get better, but they feel worse now because they have fostered a heightened sense of uncertainty about the economic outlook and, by association, the earnings growth outlook.
With that uncertainty festering, multiple expansion will be hard to come by since earnings prospects won’t be fully trusted. A consequence of that mistrust is likely to be a market that continues to trade in a fitful manner where buy-the-dip tendencies are supplanted by an inclination to sell into strength that keeps this bull market under wraps.
—Patrick J. O’Hare, Briefing.com
Where will our markets end this week?
Lower
DJIA – Bearish
SPX – Bearish
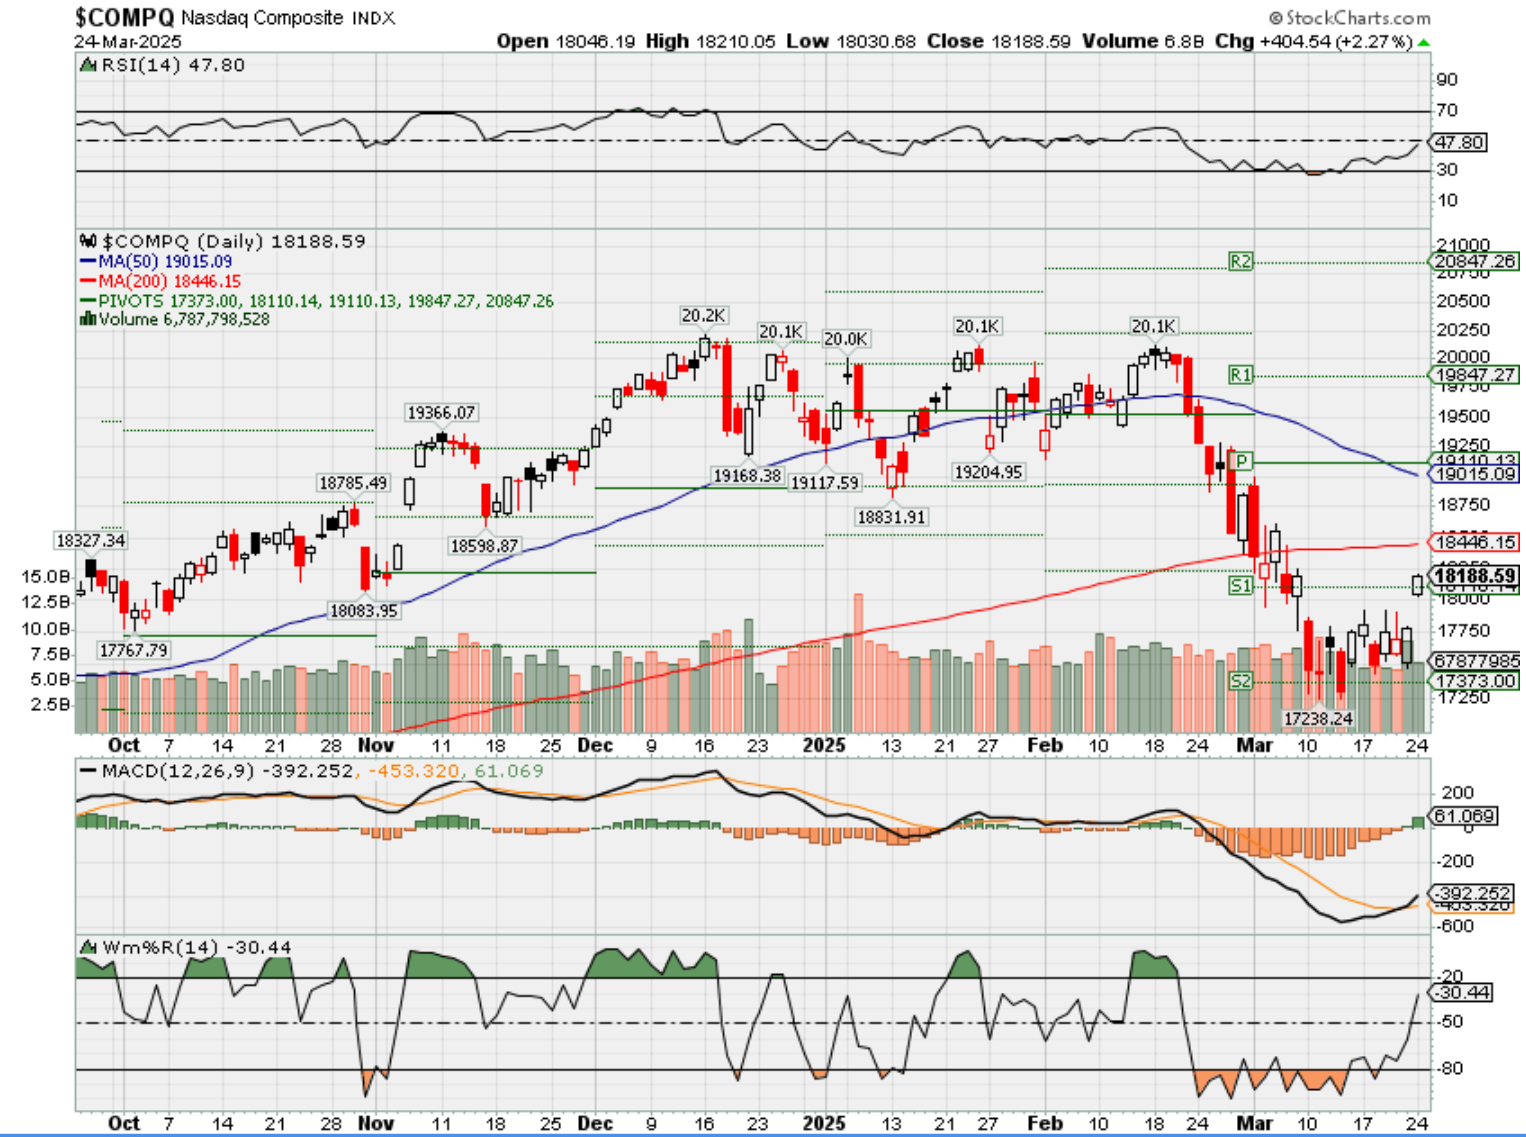
COMP – Bearish
Where Will the SPX end March 2025?
03-24-2025 -4.0%
03-17-2025 -4.0%
03-10-2025 -1.5%
03-03-2025 -1.5%
Earnings:
Mon: KBH,
Tues: GME,
Wed: CHWY, DLTR, FUL
Thur: WGO, LULU
Fri:
Econ Reports:
Mon:
Tue FHF Housing Price Index, S&P Case Shiller, Consumer Confidence, New Home Sales
Wed: MBA, Durable Goods, Durable Ex-trans,
Thur: Initial Claims, Continuing Claims, GDP, GDP Deflator, Pending Home Sales,
Fri: PCE Prices, PCE Core, Michigan Sentiment, Personal Income, Personal Spending,
How am I looking to trade?
Now we are protecting for technical crossovers to the downside AND tariff risk.
www.myhurleyinvestment.com = Blogsite
info@hurleyinvestments.com = Email
Questions???
The Magnificent 7′s lousy year, by the numbers
Published Fri, Mar 21 202510:30 AM EDTUpdated Fri, Mar 21 202512:52 PM EDT
Key Points
- Meta Platforms is the only Magnificent Seven stock in positive territory for 2025.
- Macroeconomic uncertainty, recession fears and concerns over the impact of tariffs have fueled a market sell-off that’s pushed all the major averages into negative territory for the year.
- Tesla is the worst performer this year, with shares down more than 40%.
It’s been a painful year so far for megacap technology giants known as the “Magnificent Seven” and 2025 is only getting started.
Six members of the group are already tracking for significant year-to-date losses, led by a 40% drop in shares of Tesla. Meta Platforms is the only exception, holding on to a slim gain.
The drop in technology stocks comes just two months after leaders flocked to Washington for President Donald Trump’s inauguration and after many megacaps powered to new highs in the post-election rally after his November victory.
Now, macroeconomic uncertainty, recession fears and concerns over the impact of tariffs have fueled a market sell-off that’s pushed all the major averages into negative territory for 2025. Earlier this month, the megacaps lost more than $750 billion in market value in the worst day for the tech-heavy Nasdaq Composite since 2022.
Artificial intelligence leaders such as Nvidia haven’t been spared from the turmoil. The chipmaker has dropped close to 14% in 2025, shedding nearly a fifth in value since its record high in January. The company, once in the $3 trillion market capitalization club, has lost $767 billion in market value since then, with shares headed for a negative week even after its annual GTC Conference.
Alphabet — another key leader in the AI race — is down more than 14% this year and has lost about a fifth of its value since its record close last month. Microsoft is on pace for its eighth straight negative week and its worst losing streak since February 2008.
Tesla has suffered the most significant losses, shedding about $780 billion in market value since its record close in December. CEO Elon Musk’s close ties to Trump haven’t shielded the stock, with shares on pace for their ninth straight negative week.
Apple has lost nearly $700 billion in market value since its record close in December and dropped 17% in that time frame. Amazon was on pace for its seventh negative week in a row, losing 18% over that span. The e-commerce giant is on pace for its longest weekly losing streak since May 2022, when it fell seven consecutive weeks.
While Meta has held on to slight gains, the stock has suffered its fair share of turbulence. The stock is headed for a fifth straight negative week, which would match its five-week decline from October 2022. Shares of Meta have lost a fifth of their value since their record close on Feb. 14.
S&P 500 just entered a correction. Here’s what usually happens next
Published Fri, Mar 14 20259:15 AM EDT
Something that was nearly unthinkable when the year began happened on Thursday.
The S&P 500 closed the session in a correction, down more than 10% from a record high set in February, a little more than three weeks ago. The tech-heavy Nasdaq Composite fell deeper into its own correction, down 14% from its all-time high reached in December.
Uncertainty around President Donald Trump’s tariffs on imports from key trade partners has rattled investor confidence lately, sending stocks lower. On Thursday, Trump threatened to put a 200% levy on Champagne and other European spirits.
A correction can add to investor fears of further losses. However, history shows that the S&P 500 tends to rebound after reaching such a grim milestone.
Data compiled by Ryan Detrick of the Carson Group shows the S&P 500 averages a 3.1% return one month after entering a correction. The benchmark’s return grows to 6.5% and 12% after three and six months, respectively. A year out, the S&P 500 sees an average return of 14.7%, based on data going back to 1950.
To be sure, those numbers only account for corrections, not bear markets — which happen when the S&P 500 is down 20% from a recent high. The S&P 500′s most recent bear run was in 2022, when the Federal Reserve began to raise interest rates to fight inflation. The index has suffered 11 bear markets since 1950, according to Detrick.
That said, Detrick said that another bear market now would be rare. “That would be three bears in 5 years, something we’ve never seen before. The previous closest three bears ever was 6.9 yrs between 1966 and 1973,” he said in a post on X.
Elsewhere Friday morning on Wall Street, Barclays upgraded British analytics stock RELX, calling it a potential port in the market storm.
“We think RELX offers reliable growth in an environment where relative safe havens may be needed,” analyst Nick Dempsey wrote in a Friday note. “The shares are not cheap vs history but not out of line with info services peers.”
https://www.cnbc.com/2025/03/20/micron-mu-q2-earnings-2025.html
Micron shares jump on earnings beat, rosy guidance as data center revenue triples
Published Thu, Mar 20 20254:25 PM EDTUpdated Thu, Mar 20 20254:56 PM EDT
Ashley Capoot@in/ashley-capoot-02496b173/
Key Points
- Micron reported fiscal second-quarter results that beat analysts’ estimates and offered better-than-expected guidance.
- Revenue increased 38% from a year earlier to $8.05 billion.
- Micron CEO Sanjay Mehrotra said data center revenue tripled from a year ago.
Micron shares popped 6% in extended trading Thursday after the company reported second-quarter results that beat analysts’ estimates and offered better-than-expected guidance.
Here’s how the company did:
- Earnings per share: $1.56, adjusted vs. $1.42 expected by LSEG
- Revenue: $8.05 billion vs. $7.89 billion expected by LSEG
Revenue increased 38% from $5.82 billion during the same period in 2024, Micron said in a press release. The memory and storage solutions company reported net income of $1.58 billion, or $1.41 per share, up from $793 million, or 71 cents per share, in the year-ago quarter.
Data center revenue tripled, the company said.
Revenue for the fiscal third quarter will be about $8.8 billion, Micron said, topping the $8.5 billion average analyst estimate, according to LSEG. Adjusted earnings will be roughly $1.57 a share, the company said, beating the $1.47 average estimate.
Prior to Thursday’s close, Micron shares were up 22% for the year, while the Nasdaq is down more than 8%.
Micron will host its quarterly call with investors at 4:30 p.m. ET.
U.S. stock market loses $5 trillion in value in three weeks
Published Fri, Mar 14 20258:29 AM EDTUpdated Fri, Mar 14 202511:21 AM EDT
Jesse Pound@/in/jesse-pound@jesserpound
The S&P 500′s rapid 10% decline from a record high into correction territory has wiped out trillions of dollars in market value.
The market value of the S&P 500 at its Feb. 19 peak was $52.06 trillion, according to FactSet. Thursday’s decline put the index’s market value down to $46.78 trillion.
That makes for a total loss of about $5.28 trillion in about three weeks.
The S&P 500 has gone from a record high to down 10% in less than a month.
The decline has come in the shadow of President Donald Trump’s burgeoning trade war with several of the United States’ major trading partners, with headlines about tariffs at times seeming to drive market moves. There have also been signs of slowing economic growth, with weak consumer sentiment surveys and tepid outlooks from retailers like Walmart.
“Our interactions with clients indicate that the mood music is changing. While many see recession talk as premature, concerns about erratic policy from the new administration abound, with the ‘uncertainty tax’ hitting growth expectations,” Barclays strategist Emmanuel Cau said in a note to clients.
Another contributing factor to the decline appears to be the unwind of the growth trade related to artificial intelligence. Since Feb. 19, Nvidia is down 17% and the Roundhill Magnificent Seven ETF (MAGS) has fallen 16%.
The run up in those AI-related stocks before the correction had raised concern that the stock market was too richly valued, with several names at times having their own market caps above $3 trillion. Even now, the S&P 500 is trading at 24.1-times its trailing 12-month earnings, according to FactSet, which is well above its long-term average.
Correction: Since Feb. 19, Nvidia is down 17% and the Roundhill Magnificent Seven ETF has fallen 16%. An earlier version misstated the date and a percentage.
Inflation rate eased to 2.8% in February, lower than expected
Published Wed, Mar 12 20258:30 AM EDTUpdated Wed, Mar 12 202510:49 AM EDT
Jeff Cox@jeff.cox.7528@JeffCoxCNBCcom
Key Points
- The consumer price index for both all-items and core increased 0.2% in February, slightly below expectations.
- On an annual basis, headline inflation was at 2.8%, while core was at 3.1%. Both also were 0.1 percentage point below the Wall Street consensus and the previous month’s levels.
- The report provided some relief as consumers and businesses worry about the looming impact tariffs might have on inflation
Inflation rate hits 2.8% in February, less than expected
Prices for goods and services moved up less than expected in February, providing some relief as consumers and businesses worry about the looming impact tariffs might have on inflation, the Bureau of Labor Statistics reported Wednesday.
The consumer price index, a wide-ranging measure of costs across the U.S. economy, ticked up a seasonally adjusted 0.2% for the month, putting the annual inflation rate at 2.8%, according to the Labor Department agency. The all-item CPI had increased 0.5% in January.
Excluding food and energy prices, the core CPI also rose 0.2% on the month and was at 3.1% on a 12-month basis, the lowest reading since April 2021. The core CPI had climbed 0.4% in January.
Economists surveyed by Dow Jones had been looking for 0.3% increases on both headline and core, with respective annual rates of 2.9% and 3.2%, meaning that all of the rates were 0.1 percentage point less than expected.
Stock market indexes were mixed after the release after initially moving higher. reasury yields rose. Markets have been highly volatile as the Dow Jones Industrial Average has slipped 6% over the past month.
“A lot of this inflation data does not incorporate what is to come and what already has happened for tariffs,” said Kevin Gordon, senor investment strategist at Charles Schwab. “The vagaries and uncertainties associated with policy are still a much stronger force in the market than anything CPI-related or in terms of one data point.”
Shelter costs moved up 0.3%, less than in January but still responsible for about half the monthly increase in the CPI, the BLS said. The annual increase of 4.2% was the smallest since December 2021. The category makes up more than one-third of the total weighting in the CPI, with particular focus on a measure in what homeowners estimate they could get in rent for their properties, which also increased 0.3%.
Food and energy indexes both increased 0.2%. Used vehicle prices jumped 0.9% and apparel rose 0.6%. Within food, egg prices soared another 10.4%, taking the 12-month increase to 58.8% and pushing a broader measure that also includes meat, poultry and fish up 7.7% on the year. Beef prices also climbed 2.4% in February.
Motor vehicle insurance posted a 0.3% increase on the month and was up 11.1% annually. However, airline fares slipped 4% in February and were down 0.7% from a year ago.
Inflation-adjusted average hourly earnings increased 0.1% for the month and were up 1.2% from a year ago, the BLS said in a separate release.
“The market’s interpretation is appropriate. We still don’t know anything about how inflation is going to work with the new tariff regime,” said Thomas Simons, chief U.S. economist at Jefferies. “At least for now, the momentum is moving in the Fed’s favor.”
The report comes at a potentially critical juncture for the U.S. economy and financial markets, which have been shaken lately as President Donald Trump escalates a trade war and concerns rise of a growth scare.
In the latest developments, Trump’s 25% duties on steel and aluminum took effect Wednesday, prompting retaliatory measures from the European Union. Trump also has slapped 20% levies on goods from China.
“Today’s CPI report shows inflation is declining and the economy is moving in the right direction under President Trump,” Karoline Leavitt, White House press secretary, said in a statement. “This inflation report, much like last week’s jobs report, is far better than the media predicted and the so-called ‘experts’ expected.”
Federal Reserve officials also are watching the developments closely. Central bank policymakers generally consider tariffs to have modest impacts on inflation and often are viewed as one-off measures that don’t have lasting impact on longer-term gauges.
However, a broader trade war could change that if the pace of increases becomes more ingrained in the economy. Markets currently expect the Fed to resume cutting interest rates in June, with a total of 0.75 percentage point in reductions by the end of 2025.
“The February CPI release showed further signs of progress on underlying inflation, with the pace of price increases moderating after January’s strong release,” said Kay Haigh, global co-head of fixed income and liquidity solutions at Goldman Sachs Asset Management. “While the Fed is still likely to remain on hold at this month’s meeting, the combination of easing inflationary pressures and rising downside risks to growth suggest that the Fed is moving closer to continuing its easing cycle.”
The Fed meets next week and is widely expected to hold its key borrowing rate in a target range between 4.25%-4.5%.
Economic growth is trending negative in the first quarter, according to the Atlanta Fed’s GDPNow tracker of incoming data. The measure has pegged Q1 growth at a 2.4% decline, which would be the first negative growth quarter in three years.