
HI Market View Commentary 09-16-2024
Is it all about the rate cut this week?= It’s “only” 25 basis points so it really shouldn’t matter, Powell is going to give us a rate cut, markets will do what markets want to do, 50 basis equals a bounce higher,
In real life a quarter point or a half a point won’t matter!= WILL POWELL Continue cutting for the rest of the year
We already are offering monthly 1.2 Trillion dollars in treasuries and ONLY filling between 600-800 million
My worry is if interest rates go lower how much more deficit will we create for our country?
After a rate cut over the next 12 months the S&P on average gains 5.3-8% roughly
Tech rollover right now or has it just lost its leadership?
CORRECTION = AAPL down 12% year over year from the first-weekend sales of the iPhone 15 last year, I said 25% year over year and was wrong.
Expect leadership because of the historical Christmas Rally
How did you know?
https://www.briefing.com/the-big-picture
The Big Picture
Last Updated: 13-Sep-24 15:39 ET | Archive
Things that make you go “Hmmm”
Inflation is coming down, interest rates have come way down, forward 12-month earnings estimates continue to increase, the unemployment rate remains low at 4.2%, and the Federal Reserve is about to cut the target range for the fed funds rate for the first time since March 2020.
How can you not like the stock market with a fundamental backdrop like that?
To be sure, there has been a lot of love for the stock market this year. The market-cap weighted S&P 500, the equal-weighted S&P 500, and the Dow Jones Industrial Average are on the doorstep of prior record highs reached in August.
The Nasdaq Composite set a record high in July and is up 17.8% for the year as of this writing. The S&P Midcap 400 and Russell 2000 have trailed that performance, yet they are still up 8.9% and 7.2% year-to-date, respectively.
2024 has been a great year thus far for the stock market, which has also been energized by AI enthusiasm, mega-cap leadership, and visions of a successful soft landing for the U.S. economy.
The greatness can be seen in the performance of individual stocks, and it can also be seen in the full, if not rich, valuation for the S&P 500.
It’s Getting Hot in Here
Getting right to it, the market-cap weighted S&P 500 trades at 21.1x next twelve-month earnings (“NTM”) and 23.2x trailing twelve-month earnings (“TTM”). The former is a 32% premium to the 20-year average. The latter is also a 32% premium to the 20-year average. That is rich.
Of course, the run by the mega-cap stocks has had some outsized influence on the stretched valuations. Looking at things on an equal-weighted basis, the P/E multiples are less demanding.
The equal-weighted S&P 500 trades at 16.7x NTM earnings and 18.3x TTM earnings. Both are in-line with their 10-year average. That isn’t rich, but it is full.
The S&P 500 Index, however, provides one pathway to investing in the stock market. There are multiple paths to doing that. One can focus on an individual stock, an industry group, a sector, and/or an index. You can invest in micro-cap stocks, small-cap stocks, mid-cap stocks, large-cap stocks, and mega-cap stocks In aggregate, though, the U.S. stock market isn’t cheap.
One telltale indicator for such an assertion is the ratio of the Wilshire 5000 market capitalization to nominal GDP. This is the so-called “Buffett Indicator,” popularized by none other than Warren Buffett who said the following in late-2001:
“If the percentage relationship falls to the 70% or 80% area, buying stocks is likely to work very well for you. If the ratio approaches 200% – as it did in 1999 and a part of 2000 – you are playing with fire.”
We’re well beyond the ratios seen even in 1999 and 2000. In fact, the ratio today (193.5%) is approaching the record high seen in August 2021 (201.1%).
In the realm of things that make you go “Hmmm,” Berkshire Hathaway has been actively reducing its (large) stake in Bank of America (BAC) and now sits on $277 billion of cash and short-term investments as of its second quarter earnings report, up from $147 billion in the same period a year ago.
Money Park It Funds
Is the Wilshire 5000 to GDP ratio an outright sell signal? No. It is, however, a valuation beacon that suggests one needs to be more discerning about “chasing stocks,” and the price of entry, as future returns will be less when starting from a high valuation point.
That is a prudent warning for a market that runs on momentum, awarding billions of dollars of market capitalization to companies X, Y, and Z just because company A had a good earnings report or has issued a press release with the right buzzwords.
This is also prudent knowing that the stock market has been frontrunning the Goldilocks scenario of the Fed perfectly executing a soft landing and seemingly ignoring the world around it, which includes a war in the Middle East, a war in Europe, a weak Chinese economy, struggling low-income consumers, an untenable debt situation in the U.S., and an election whose outcome will matter greatly for the path of fiscal policy in coming years.
Perhaps those things aren’t being ignored completely. At the same time the stock market has run to record highs, so has the amount of money parked in money market mutual funds.
Higher interest rates have been the draw here, but as stocks have run to record highs on the belief the economy will achieve a soft landing and that the Fed will be cutting rates, there hasn’t been any large outflows from these funds. In fact, there is $6.32 trillion parked there now versus $6.24 trillion when Fed Chair Powell gave his Jackson Hole speech and said the time has come for policy to adjust.
The uncertainty of the election outcome could be a tying factor; and rates haven’t dropped yet. It is hard to ascertain if that money is there in anticipation of a more challenging investment environment or lying in wait to be deployed into riskier assets after the election. Time will tell, but there are a lot of unknowns wrapped up in that $6.32 trillion.
It’s another item that makes you go “Hmmm.”
It’s Earnings
What is it about this stock market that has made it seem unstoppable. The AI enthusiasm will be top of mind for a lot of people, along with impending rate cuts and an economy that has weathered 11 rate hikes by the Fed since March 2022 and hasn’t broken.
That is all part of it, but the catch-all answer is earnings and earnings estimates. The chart below shows a rising trend for next twelve-month earnings estimates. They stand at $266.61 today, according to FactSet. This is why continued economic growth is so important because earnings growth goes along with economic growth.
Recessions are terrible for earnings. As stated in a prior piece, the average peak-to-trough earnings drop in a recession since 1960 has been about 31%, according to Yale University Professor Robert Shiller’s data.
Rising earnings estimates can temper valuation concerns, assuming they go up at a faster rate than stock prices. Profit margin expansion is harder to come by in a slowing economy that is accompanied by lower sales growth, unless companies find a way to cut costs.
That is being helped naturally right now by moderating cost pressures (i.e. lower inflation rates) and potentially by lower interest costs. Another pathway is cutting labor expenses, which thus far has not been a prevailing approach. That is evident in the relatively low level of weekly initial jobless claims.
Stability in the labor market is a key ingredient for the Fed to achieve a soft landing, and the Fed knows that, which is why Fed Chair Powell also said in his Jackson Hole speech that, “We do not seek or welcome further cooling in labor market conditions.”
The unemployment rate remains low at 4.2%, but it is up from 3.7% at the start of the year, reflecting some loosening in labor market conditions along with a reduced number of job openings.
When jobs go away and can’t be found easily, consumer spending gets cut, and when consumer spending gets cut, economic growth projections get cut and earnings estimates get cut. That is why so much attention needs to be paid to labor market conditions. So far, everything remains in a tolerable state, so faith in earnings estimates being revised higher remains intact.
When that trend is broken is when rich multiples will become a bigger problem for the stock market than they appear to be today.
Something Has to Give
Falling market rates have provided some valuation support. They have come down as inflation has come down, and as rate-cut expectations have gone up.
The fed funds futures market is pricing in 100 basis points of rate cuts before the end of the year and another 150 basis points by September 2025, according to the CME FedWatch Tool. The target range for the fed funds rate sits at 5.25-5.50% today.
If the market has it right, that would put the target range for the fed funds rate at 2.75-3.00% following the September 2025 FOMC meeting, which is consistent with the Fed’s longer run (or neutral) target, but well below the 4.10% median estimate for 2025 based on Fed members’ forecasts at the June 2024 FOMC meeting.
Something is going to have to give. Either the Fed needs to cut rates more rapidly than it thinks or the fed funds futures market needs to check itself (again) in terms of its dovish outlook. Here again, though, the current disconnect between the fed funds futures market’s thinking and the Fed’s thinking is something that makes you go “Hmmm.”
What It All Means
The stock market is in a good spot — or, maybe we should say in a good head space. It sees a soft landing; it sees rate cuts; it sees inflation coming down; it sees earnings estimates holding up; and it sees a labor market that remains in relatively good shape. It also sees a secular growth trend in AI possibilities.
What it doesn’t see clearly is an election outcome, and it won’t until November (hopefully, not beyond that). Key to that outcome is not just who is president, but what Congress looks like, because Congress will be at the center of fiscal policy when the 2017 tax cuts expire at the end of 2025.
There will be increased volatility leading up to the November election and certainly thereafter if it is a contested election.
The pull to year-end then promises to be exciting in more ways than one, but with a rich valuation on one hand, a full valuation on another, and a valuation fire potentially burning in the background, one needs to be more prudent in investment allocation decisions, because you are not starting at a low valuation point.
—Patrick J. O’Hare, Briefing.com
MU 09/25 est
Where will our markets end this week?
Lower
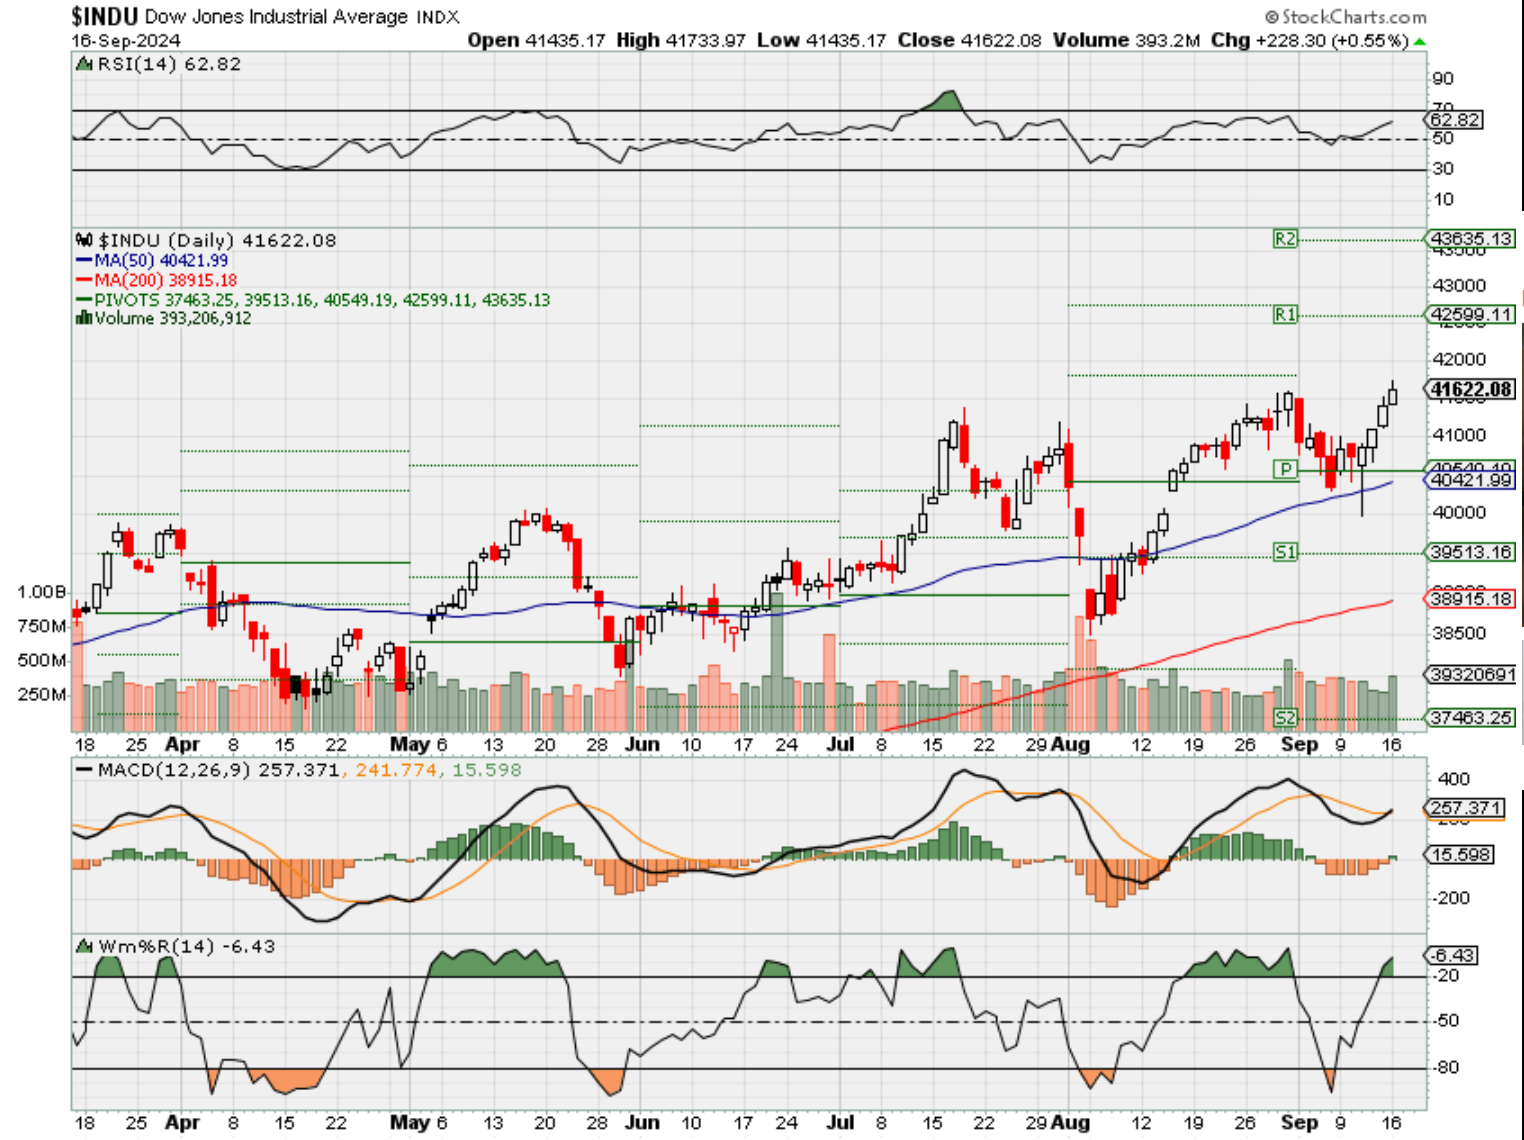
DJIA – Bullish

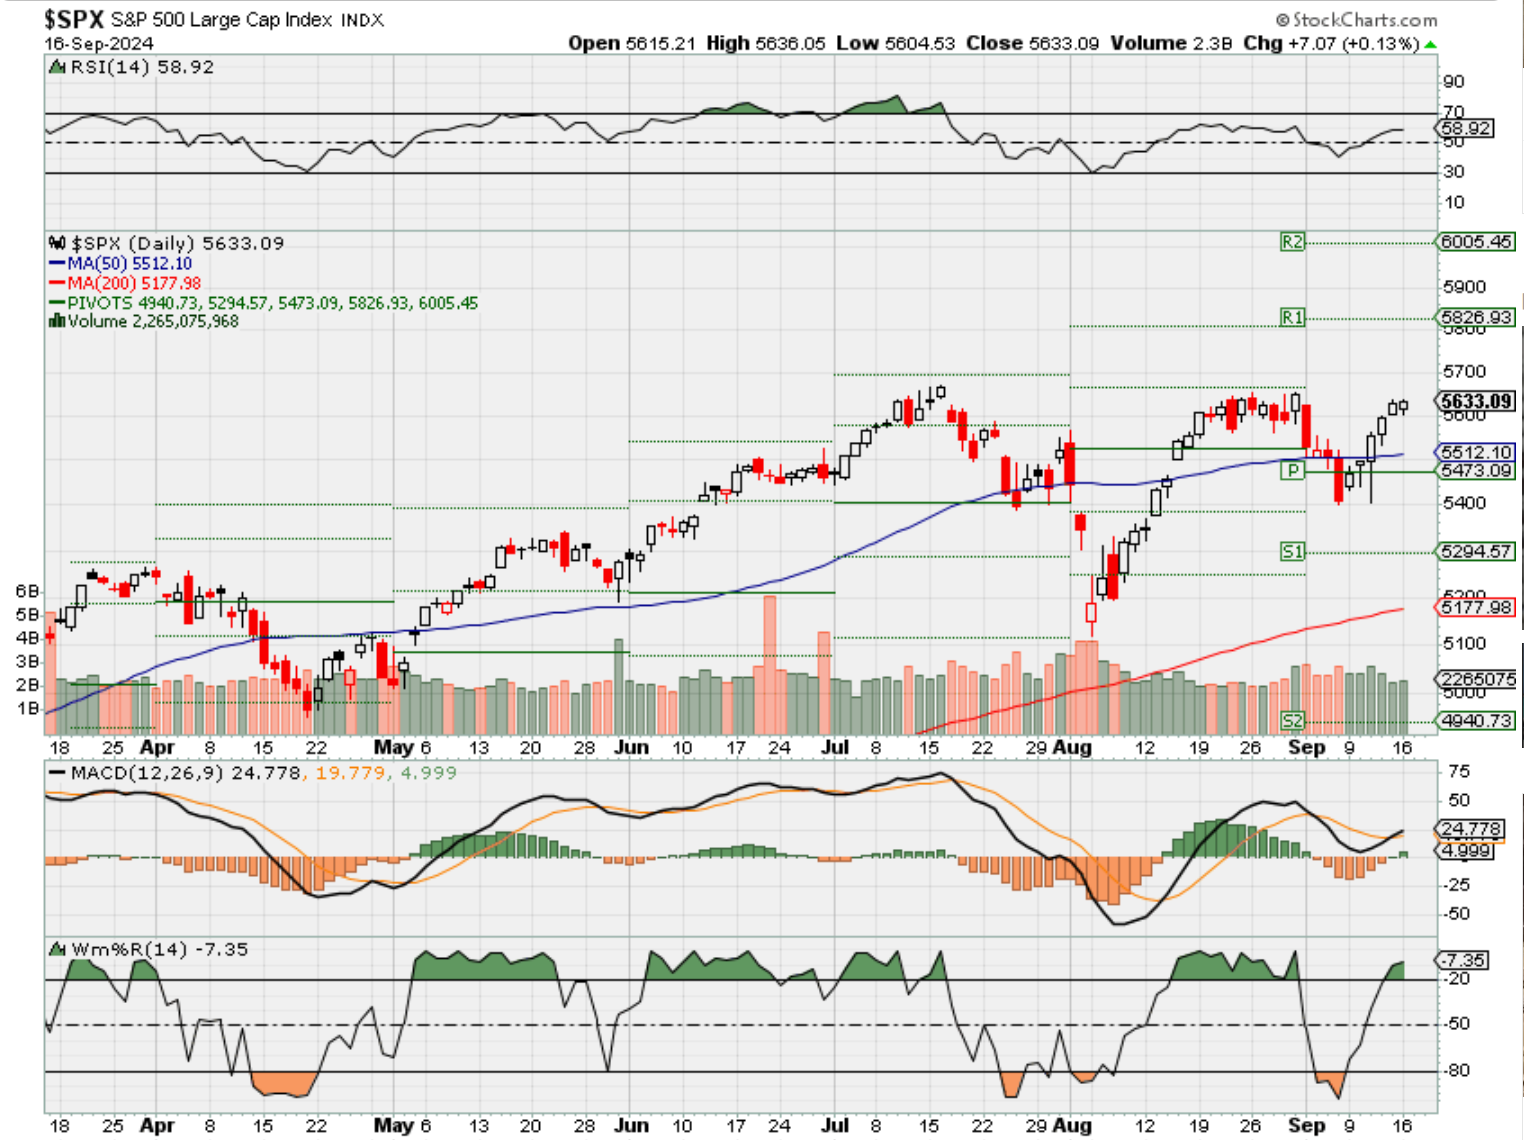
SPX – Bullish
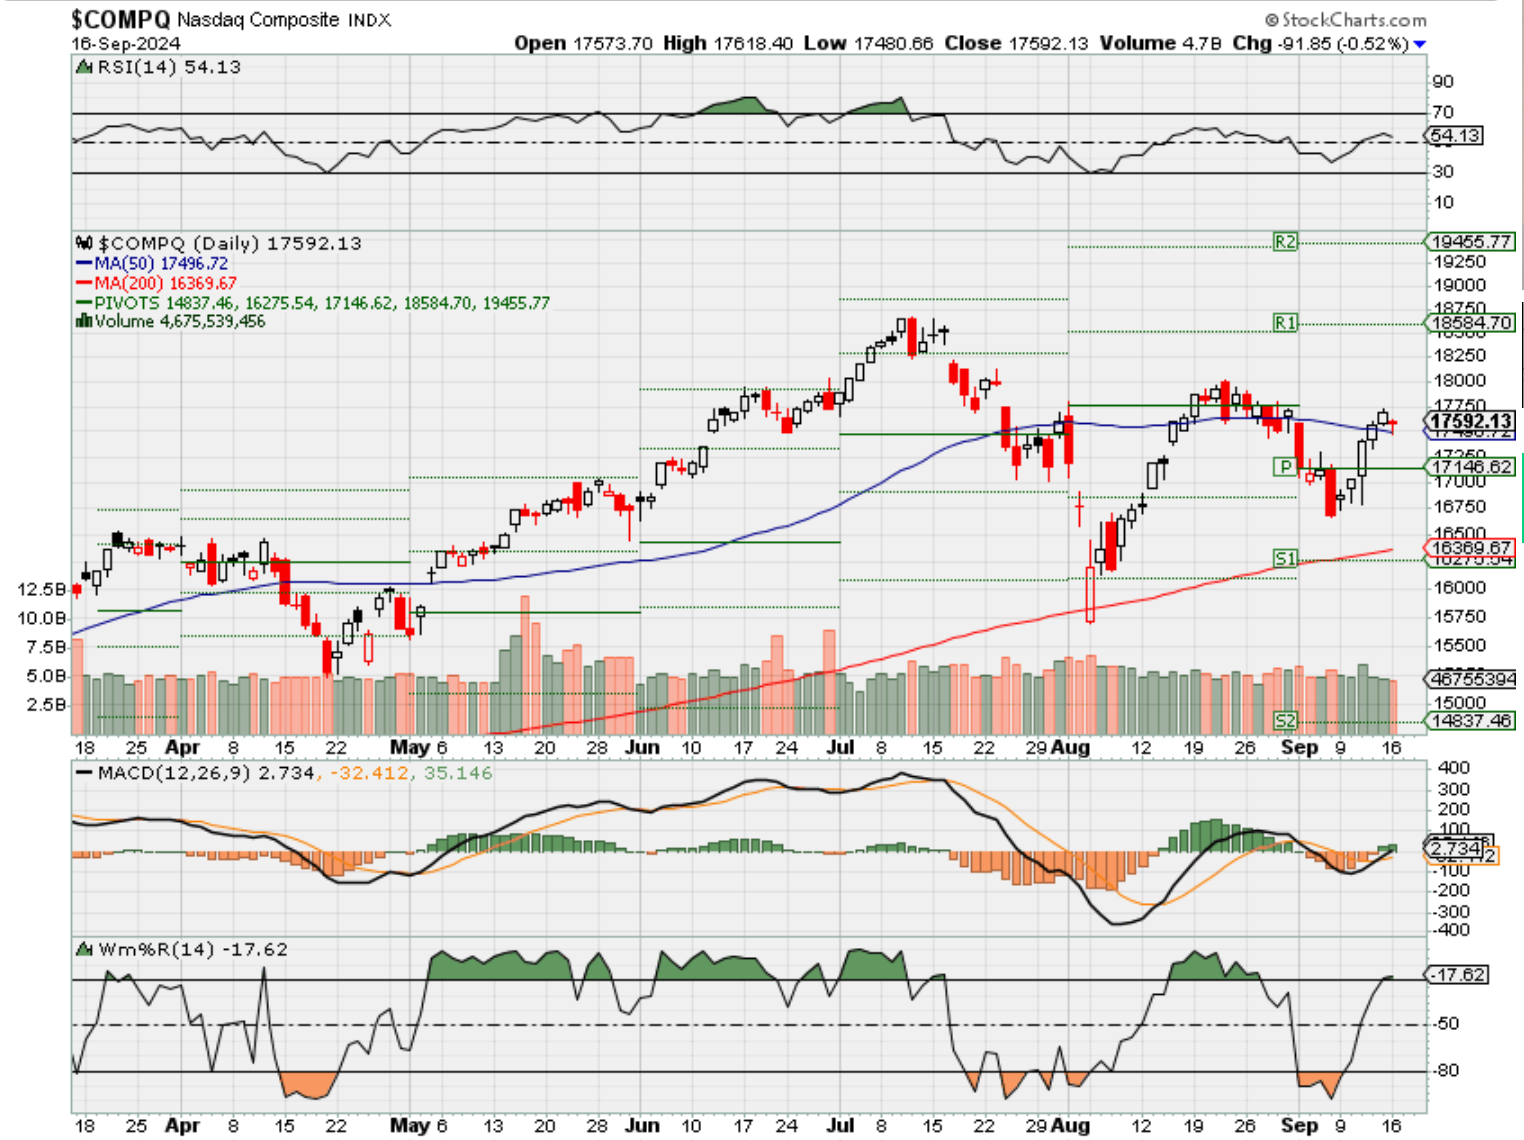
COMP – Bullish NEW support level @ 17, 496-17,480
Where Will the SPX end September 2024?
09-16-2024 -2.50%
09-09-2024 -2.50%
09-03-2024 -2.00%
08-26-2024 -2.00%
Earnings:
Mon:
Tues:
Wed: GIS,
Thur: DRI, FDX, LEN
Fri:
Econ Reports:
Mon: NY Empire,
Tue Retail Sales, Retail ex-trans, NAHB Housing Market Index, Industrial Production, Capacity Utilization, Business Inventories,
Wed: MBA, Housing Starts, Building Permits, FOMC Rate Decision
Thur: Initial Claims, Continuing Claims, Existing Homes Sales, Leading Indicators, Current Account Balances
Fri:
How am I looking to trade?
We Started taking protection off based on Technical Analysis
www.myhurleyinvestment.com = Blogsite
info@hurleyinvestments.com = Email
Questions???
Labor depart numbers might not be accurate?
As gasoline prices slide, here’s how the stock market tends to respond, says Jefferies
Critical information for the U.S. trading day
Last Updated: Sept. 16, 2024 at 9:32 a.m. ET
First Published: Sept. 16, 2024 at 6:31 a.m. ET
Falling WTI crude oil prices have helped push the cost of gasoline lowerPhoto: Brandon Bell/Getty Images
The prospect of the Federal Reserve on Wednesday starting a cycle of interest rate cuts — with either a 25 or 50 basis point reduction — has gripped Wall Street.
The S&P 500 index will start the week a fraction below its record high as 2-year Treasury yields trade at their lowest since September 2022.
However, analysts at Jefferies profess to being “ambivalent to the size of the first cut…as the implications for the economy appear more dependent on the direction of travel for interest rates than the precision of the delivery mechanism over time.”
Indeed, in a note published over the weekend, the Jefferies team led by Andrew Greenebaum, are focused on what they consider another crucial driver of the U.S. economy: energy prices.
They note that after a summer rally, the price of WTI crude
has again dropped below the $70 a barrel mark — at one point last week falling to $65.75, which Jefferies says was the lowest close since December 2021.
Now Playing: Infor’s CEO on Koch Industries, Improving People’s Lives, and More
The video player is currently playing an ad.
Crucially, this has translated into consistently lower prices at the pump for U.S. consumers. Last week’s average spot gasoline price of $3.24 is the lowest since Mid-February says Jefferies, and it reckons the downtrend will continue.
There are two points that stand out to Jefferies. First, the 12-month change in U.S. spot gasoline is minus16%: “while the nominal price remains elevated, not many consumer-borne costs are down around 20% over the past year,” says Jefferies.
And second, “as a high frequency direct purchase for U.S. consumers and an input for many of their other goods purchases, even more downside should bode incredibly well for wallets, even if the labor market is less tight.”
Source: Jefferies
But what, Jefferies asks, does this mean for stocks? Well, analyzing data back to 1991, they looked at how several different indices traded when spot gasoline prices saw a 12-month decline of similar magnitude.
They noted a few significant outcomes. First, they found that of the 13 times this has occurred, the S&P 500 has rallied 18% on average over the next 12 months, with only three instances of negative returns, two of which Jefferies reckons were tech-bubble related.
Next, “our favorite discretionary stock proxy (S&P Retail Select Index), while extremely volatile, has tended to outperform substantially,” they say. The same is true of the Russell 2000.
In addition, such a slide in gasoline prices “also tends to be a boon to the overall commodity index (despite crude’s inclusion), presumably as lower crude/gasoline prices is more than offset by better global activity,” says Jefferies.
Finally, and perhaps most importantly for many of today’s investors, the Nasdaq 100 has tended to consistently outperform the S&P 500 index by high percentage margins over the following 12 months.
Photo: Source: Jefferies
For more market updates plus actionable trade ideas for stocks, options and crypto, subscribe to MarketDiem by Investor’s Business Daily.
BlackRock’s Rick Rieder says take advantage of this golden age for fixed income as Fed is likely to cut rates
Published Mon, Sep 16 202412:23 PM EDTUpdated 2 Hours Ago
Key Points
- With the Federal Reserve expected to begin its rate-cutting cycle this week, investors should take advantage of this “golden age of fixed income” now, according to BlackRock’s Rick Rieder.
- Traders are split between expecting a quarter-point decrease and a half-point cut when the Fed meets this week, with a heavier weighting toward a bigger cut, according to the CME Group FedWatch Tool.
With the Federal Reserve expected to begin its rate-cutting cycle this week, investors should take advantage of this “golden age of fixed income” now, according to BlackRock’s Rick Rieder.
He sees a shift coming in the market.
“The world is changing,” said Rieder, the asset manager’s global chief investment officer of fixed income. “The equity market will continue to do, I think, OK, but no better than OK.”
Plus, as investors question the large multiples on tech stocks, the “fever pitch” that the names have enjoyed will not be sustained, he said, although he believes they will continue to do well.
Investors instead should buy yield “and just watch it do its thing,” he said. BlackRock manages more than $9 trillion.
“The idea of, ‘Gosh, I can lock in for three to five years — and you don’t have to go out to 30 years — I can lock in these yields for the next three to five years.’ I think it’s a pretty compelling proposition,” said Rieder, who manages the BlackRock Flexible Income ETF (BINC). The fund has a 5.84% 30-day SEC yield and net expense ratio of 0.4%.
BlackRock Flexible Income ETF year-to-date performance
Traders are split between expecting a quarter-point decrease and a half-point cut when the Fed meets this week, with a heavier weighting toward a bigger cut, according to the CME Group FedWatch Tool.
Rieder is in the camp expecting the quarter-point decrease, although he personally believes the central bank should cut by a half point.
In this environment, Rieder likes the belly of the curve and assets such as securitized products, high yield and European credit. BINC currently has about 28% of its assets in non-U.S. credit and about 20% in U.S. high-yield bonds. Nearly 13% is in agency residential mortgage-backed securities and about 11% is in collateralized loan obligations.
Rieder is not concerned about the narrow spreads in high-yield credit.
“High-yield companies should be borrowing 200 basis points richer than they’re borrowing today,” he said. “The only reason they are borrowing at these levels is because people think spreads are too tight, because the Fed is behind the curve.”
At the same time, there is not much supply coming onto the market and fundamentals are in great shape, he said.
“We’ve got a chance to buy companies that are arguably in the best shape they’ve been, in aggregate credit-quality wise … in two decades,” Rieder said. “They’re borrowing at significantly cheaper levels, meaning we get to invest in them at cheaper levels.”
Still, he believes investors need to be precise in how they own high yield these days because there is a wide dispersion in the space. With a lot of money flowing into high-yield bonds and limited supply, some areas have gotten too rich and are not worth owning, such as some of the BB-rated bonds, he noted. Meanwhile, CCC bonds “are an adventure in and of themselves,” he said.
Therefore, Rieder would buy BB credit in Europe and B-rated bonds in the U.S.
Then he would marry that high yield with assets such as agency mortgage-backed securities and AAA-rated CLOs.
With agency MBS, rate volatility is coming down and liquidity is tremendous, he said.
“We like low coupon agency mortgages,” Rieder said. “The prepayment risk is very, very low.”
While AAA-rated CLOs may not be as liquid as agency MBS, they are a bargain, Rieder said.
“There are AAA CLOs — floating rate, super high quality — and you’re getting 5.5% to 6% yield for a AAA asset,” he said. “It’s the cheapest asset in all of fixed income.”
Apple shares slide as analysts highlight sluggish iPhone 16 demand
Published Mon, Sep 16 20249:51 AM EDTUpdated Mon, Sep 16 20244:00 PM EDT
Key Points
- Apple shares slid Monday after reports that demand for the new iPhone 16 is lower than expected — and down 12% year over year from the first-weekend sales of the iPhone 15 last year, TF Securities analyst Ming-Chi Kuo wrote in a note.
- One key factor, Kuo wrote, is that Apple Intelligence, one of the major selling points for the new models at Apple’s annual event last week, won’t be available until next month in beta.
- Analysts at Bank of America and JPMorgan also wrote in investor notes that shipping times could translate to lighter demand for the newest iPhone Pro models, compared with last year.
Apple shares slid nearly 2.8% on Monday, after reports that demand for the new iPhone 16 is lower than expected — and down 12% year over year from the first-weekend sales of the iPhone 15 last year, TF Securities analyst Ming-Chi Kuo wrote in a note.
“The key factor is the lower-than-expected demand for the iPhone 16 Pro series,” Kuo wrote after compiling data from Apple’s websites on each iPhone 16 model’s pre-order sales, average delivery times and shipments before pre-order.
Kuo added that one of the “key factors” of lower demand is that the “major selling point, Apple Intelligence, is not available at launch alongside the iPhone 16 release. Additionally, intense competition in the Chinese market continues to impact iPhone demand.”
Last Monday, Apple unveiled new versions of the iPhone, AirPods and Apple Watch at an event at its headquarters in Cupertino, California. Pre-orders for the new iPhones began Friday and launch on Sept. 20, but the first Apple Intelligence features for iPhone 16 won’t launch until next month, in a beta version.
Analysts at Barclays, JPMorgan and Bank of America also wrote in investor notes that shipping times could translate to lighter demand for the newest iPhone Pro models, compared with last year.
“Based on our conversations with distributors and analysis of pre-order figures on major Chinese e-commerce sites, total pre-order units were down Y/Y within the first couple of days, with a lower pro model mix,” Barclays analysts wrote in a note. “We heard that pro model units were down double digits on a Y/Y basis, while base and plus models grew Y/Y.”
The Barclays analysts added that the rollout of Apple Intelligence in the Chinese language “is not until CY2025, which may dampen early enthusiasm for IP16. Weak macro and competition continue to weigh on iPhone sales in China.” They also wrote that Apple had to rely on significant discounts to help China sales for the iPhone 15.
When tracking key markets’ delivery lead times as a demand indicator, the JPMorgan analysts wrote that “early lead-times are indicating demand on the iPhone 16 base models in-line to the iPhone 15 series during Week 1 (e.g., Pre-Order Week), while early demand indicators for Pro models are starting off modestly softer relative to the iPhone 15 series.”
BofA analysts wrote that after tracking iPhone ship dates on Apple’s own website and various carrier websites, ship time “for the iPhone 16 Pro and Pro Max models are extended, but somewhat less (on average) compared to last year at this point in the pre-order cycle.”
They added that “though the extension of ship dates can be reflective of iPhone demand, other factors such as supply, inventory, allocation and pricing could be impacting the ship dates.” The analysts also wrote that Apple reduced iPhone 16 prices in Australia and India.
The iPhone 16 Pro and the iPhone 16 Pro Max are Apple’s more premium phones that have nicer screens and cameras than the regular models, starting at $999 and $1,199, respectively.
The Pro models have the “thinnest borders on any Apple product,” Apple said at its event last week, calling them “by far our best iPhone displays ever.” The titanium is nearly half the weight of stainless steel and is “more scratch resistant than other forms of titanium others have used.”
The company also said during the event the new iPhone 16 Pro Max has “the best iPhone battery life ever” but did not offer additional details.
— CNBC’s Michael Bloom contributed reporting.