
HI Market View Commentary 09-09-2024
My daughters first High School Volleyball game just ended 2 minutes ago
Won the first game easily and I was thinking we are great!! Easy win and she will get more playing time
We then lost the next two. I was feeling heart broken thinking how sad she must be
We miraculously won the fourth game
And it was 15-13 for the last game for the win
My emotions were all over the place = our emotions with the stock market
Today’s news comes at us minute by minute = emotional we are as people
How do you feel when the stocks or stock market goes on sale?= Future worries, I freak out, I’m not patient, this too shall pass
MY emotions = Pissed off, worry, opportunity
OK worst week since March of 2020 = 4.33% roughly
Big Tech stocks were among the worst performers. The names behind much of this year’s rally — Nvidia, Alphabet, Amazon — fell around 4% on Friday alone.
If the movement of markets is a barometer for the health of the economy, then we’re in for some bad times ahead.
That’s, however, a very big “if.” Markets are less an Excel formula than Word’s often random autocomplete suggestions.
What we do know from hard numbers is that the U.S. economy, while not doing too great, isn’t nearly as bad as stocks imply.
https://www.briefing.com/the-big-picture
The Big Picture
Last Updated: 06-Sep-24 15:33 ET | Archive
Economy still okay, but uncomfortable
There is a lot of discussion these days about whether the U.S. economy will have a soft landing or a hard landing (the euphemism for a recession).
What is a recession? The textbook definition says an economy is in recession if GDP contracts for two consecutive quarters.
That doesn’t mean there can’t be recessions in individual sectors of the economy when you don’t have economic activity contracting for two consecutive quarters, yet that doesn’t count as far as the National Bureau of Economic Research’s (NBER) Business Cycle Dating Committee is concerned.
Why does that matter?
The NBER is the official arbiter of when there is a recession, and its “definition emphasizes that a recession involves a significant decline in economic activity that is spread across the economy and lasts more than a few months.” The NBER says three criteria — depth, diffusion, and duration — are treated interchangeably in the interpretation of its definition.
A Closer Look
What is it, though, that the NBER is looking at insomuch as it relates to “economic activity” as it tries to identify peaks and troughs in an economic cycle? Not surprisingly, the committee emphasizes “economy-wide measures of economic activity,” which include the following:
- Real personal income less transfers
- Nonfarm payroll employment
- Employment as measured by the household survey
- Real personal consumption expenditures
- Wholesale-retail sales adjusted for price changes
- Industrial production
The NBER clarifies that, “There is no fixed rule about what measures contribute information to the process or how they are weighted in our decisions. In recent decades, the two measures we have put the most weight on are real personal income less transfers and nonfarm payroll employment.”
Let’s look at those two measures a little more closely.
Real personal income less transfers isn’t screaming recession. If anything, it could be carving out a message of an economy peaking, but that message can only be read in hindsight.
The chart below, which covers the last three decades, clearly shows that the trend in real personal income less transfer receipts looked good — until it didn’t — before a recession. What is evident in the chart is that there has been a drop-off in real personal income less transfers during the recessions seen in the last 30 years. That isn’t evident now.
The same holds true for nonfarm payroll employment. With each recession since 2000, there has been a notable decline in nonfarm payroll employment. That goes hand-in-hand with the drop-off in real personal income that is integral for consumer spending.
This is why the Fed is pre-occupied now with the labor market and why Fed Chair Powell said in his Jackson Hole speech that, “We do not seek or welcome further cooling in labor market conditions.” The Fed recognizes that the key to a soft landing is a stable labor market.
That stability is being put to the test. The 4.2% unemployment rate in August was improved from 4.3% in July, but it is up 80 basis points from the 3.4% rate seen in April 2023. Nonfarm payroll employment, however, continues to be positive.
Looking Ahead
These key indicators for the NBER are in good shape currently, but the NBER readily admits that its determination of turning points in the economy is retrospective. In other words, an expansion will have likely started well before the NBER calls a trough and a recession will likely have started well before the NBER calls a peak. Hindsight for the NBER is 20-20.
The capital markets, of course, are forward-looking and their vision is never 20-20. It can be close, but corrective lenses are often needed.
What the markets are seeing now is a slowdown ahead. A soft landing has been the prevailing view, but there have been enough rumblings beneath the surface to raise some doubt about the economy achieving a soft landing:
- The 2s10s spread has reverted to a normal posture with short rates falling faster than long rates (the 2-yr note yield has dropped 59 basis points this year while the 10-yr note yield has dropped 16 basis points).
- The best-performing sectors this quarter have been the rate-sensitive utilities, real estate, and financial sectors, followed by the counter-cyclical consumer staples and health care sectors.
- WTI crude prices have fallen from $87.00/bbl in April to below $70.00/bbl today despite the ongoing Israel-Hamas war, which has included increased skirmishes with Hezbollah, OPEC+ delaying a plan to increase output for two months, the dollar weakening, and the U.S. government standing as a ready buyer at lower prices to replenish the Strategic Petroleum Reserve.
- The latest Beige Book indicated nine of the 12 Fed districts reported flat or declining activity (up from five in the prior period).
- Trucking company ArcBest (ARCB) said it continues to see lower weight per shipment levels, reflecting the softer macro environment. Fellow trucking company Old Dominion Freight Line (ODFL) said its revenue results in August reflect continued softness in the domestic economy.
- The ISM Manufacturing Index has reflected a manufacturing sector in a state of contraction in 21 of the past 22 months.
- Deep discount retailers Dollar Tree (DLTR) and Dollar General (DG) sharply cut their full-year guidance as core customers, feeling the pinch of inflation, interest rates, and other macro pressures, reduced their spending on discretionary items.
- The Philadelphia Semiconductor Index is down more than 20% from its July high, meeting the generally accepted definition of being in a bear market. Semiconductors are deemed to have leading indicator status because they are used so widely in consumer and industrial applications.
To be fair, there is an indicator that is still flying in the face of a hard landing outcome (or maybe we should say laying low). That would be the spread between junk bonds and Treasuries. That spread typically widens noticeably when economic worries escalate. It has bumped up just a bit recently, but the chart below suggests there isn’t undue concern in the corporate bond market about a hard landing.
What It All Means
Just like the other charts for real personal income less transfers and nonfarm payroll employment, the chart of junk bond spreads shows things can look bad in a hurry in hindsight. Things may look good now, specifically with junk bond spreads, but things in general feel a bit uncomfortable when it comes to the economy.
The Treasury market is sensing as much, which is why yields have dropped precipitously. The fed funds futures market is sensing as much, which is why it is pricing in 100 basis points of rate cuts before the end of the year. The oil market is sensing as much, which is why prices are sliding despite several key sources of support. The stock market is starting to sense as much, which is why buyers have shown a lack of conviction of late.
Maybe even the NBER is starting to sense it, even though the two measures its has placed the most weight on in recent decades for identifying peaks and troughs still speak to an economy in growth mode.
The NBER will tell us with confidence in hindsight when the economy peaked and troughed. What it looks like now, clearly, is that growth is slowing. Given that, a stock market trading at a rich valuation is going to be more discerning in terms of where the wealth is spread, and a Treasury market staring at an inverted 2s10s spread for over two years, is likely to spread the wealth further in a curve-steepening trade.
—Patrick J. O’Hare, Briefing.com
PAST PERFORMANCE DOESN’T INDICATE or GAURANTEE FUTURE RESULTS
Earnings dates:
MU 09/25 est
Where will our markets end this week?
Lower
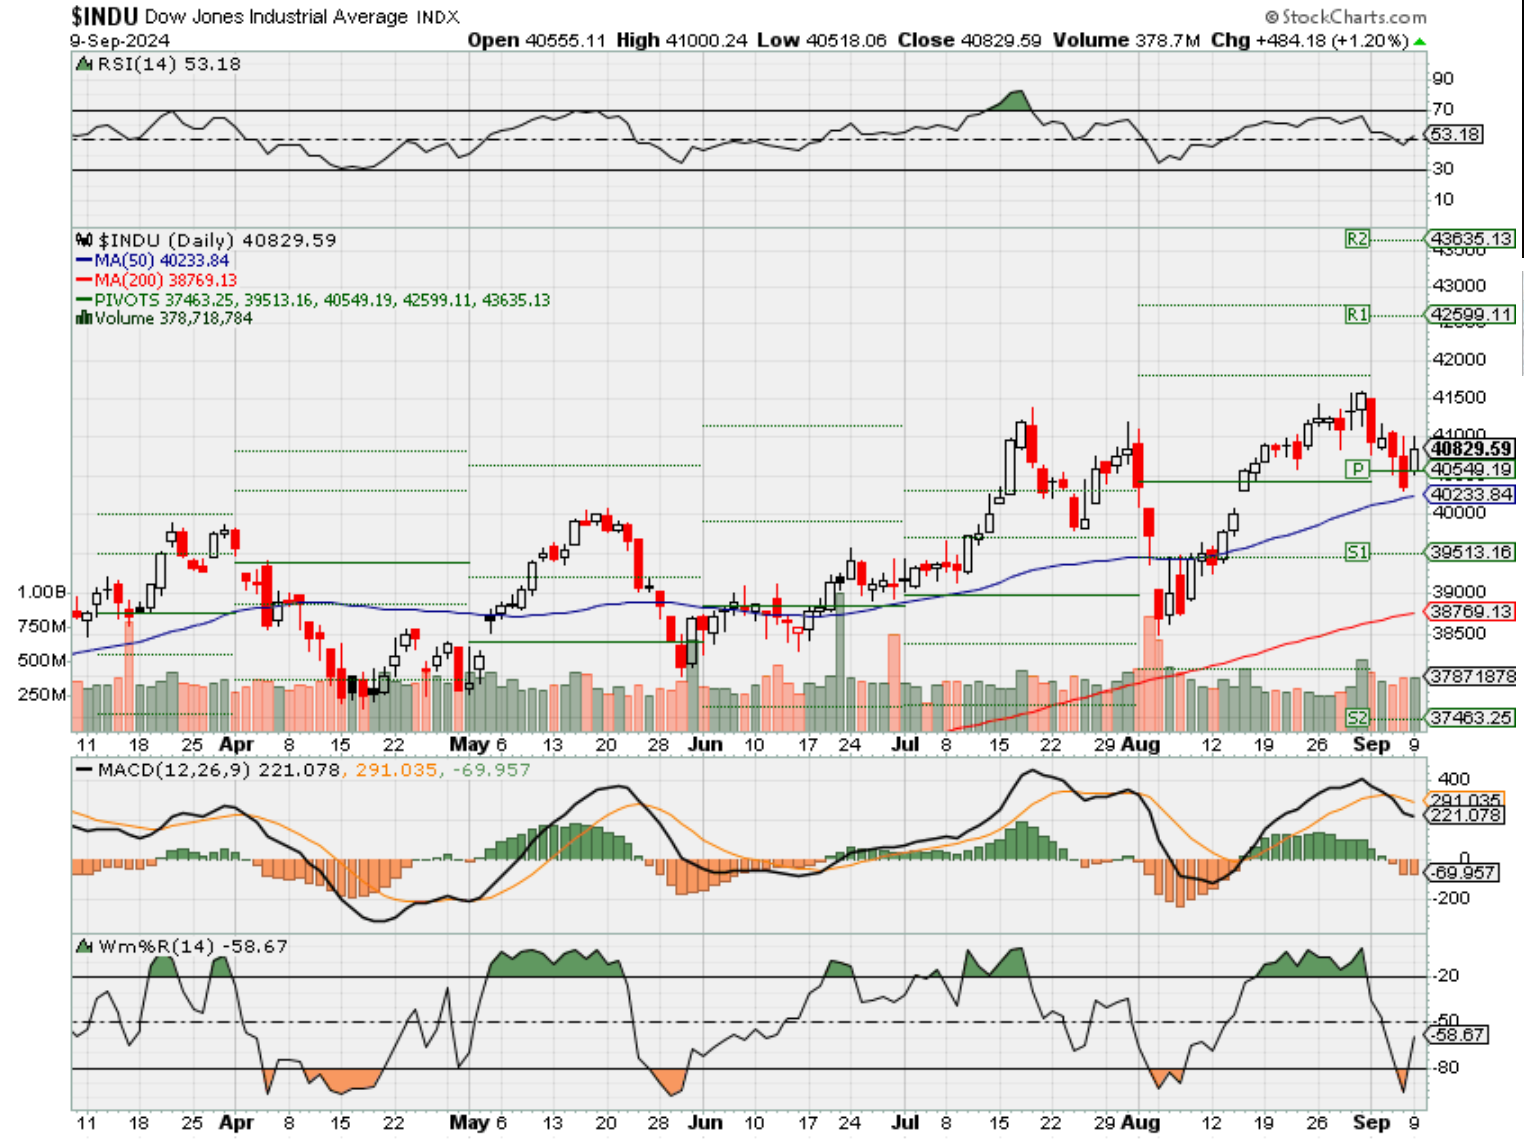
DJIA – Bearish
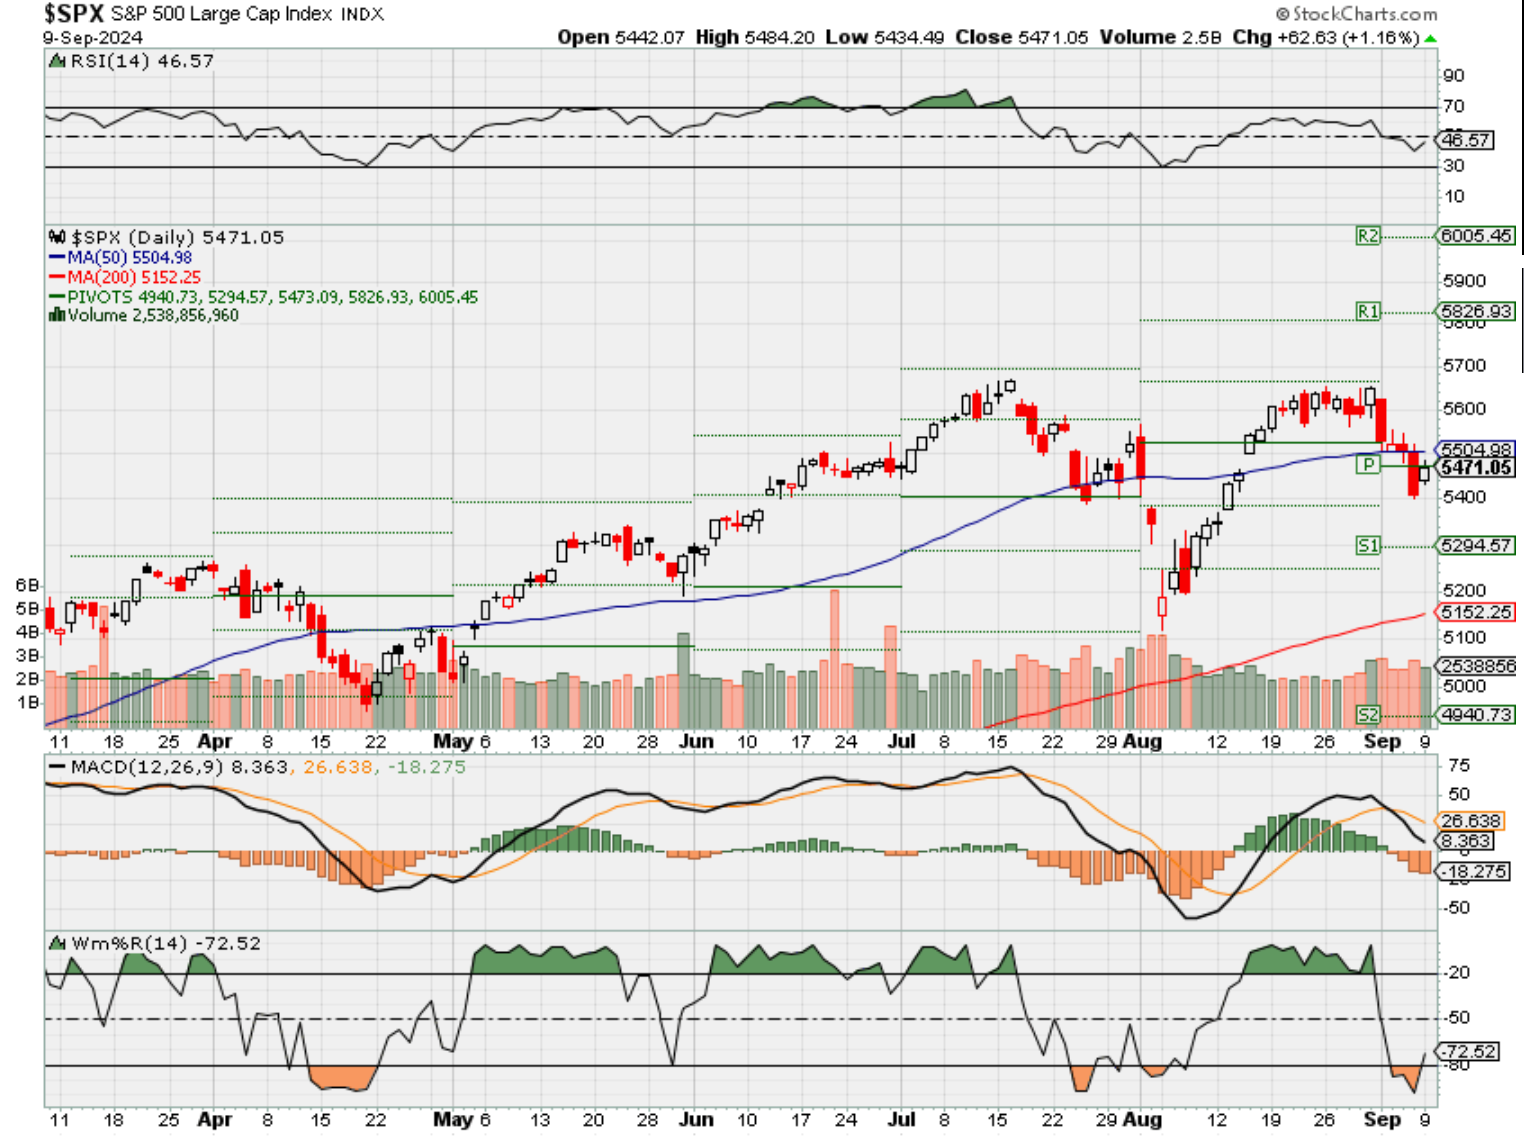
SPX – Bearish
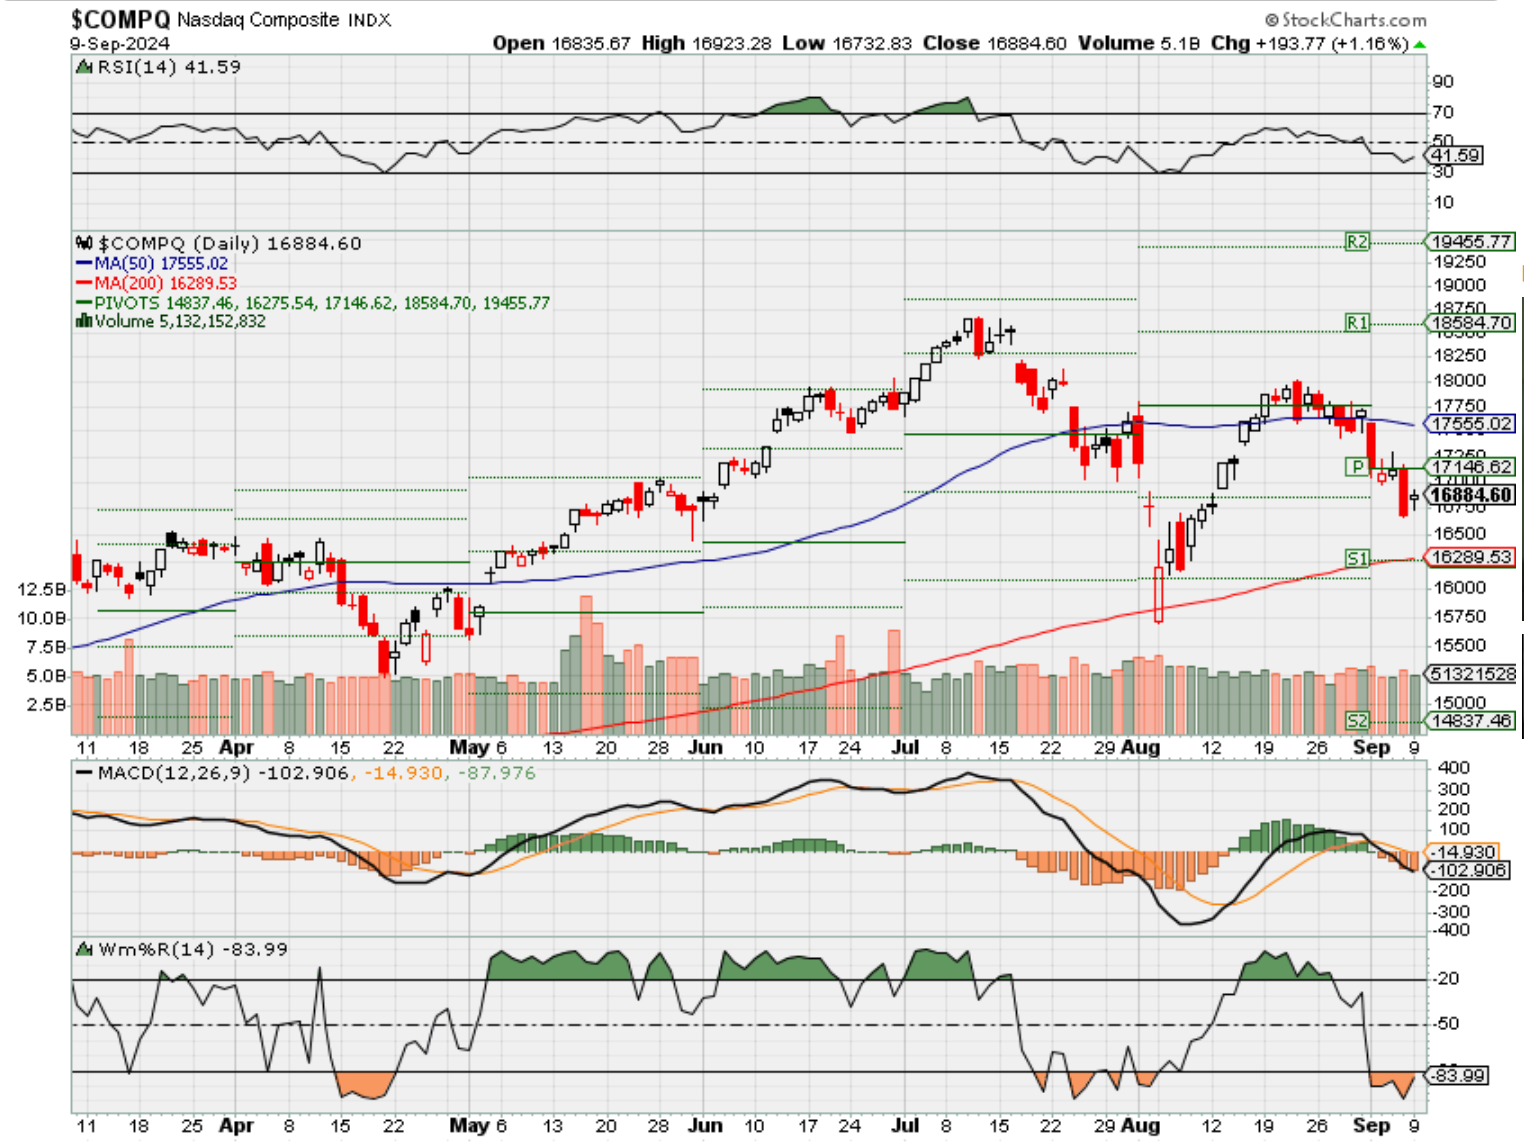
COMP – Bearish
Where Will the SPX end September 2024?
09-09-2024 -2.50%
09-03-2024 -2.00%
08-26-2024 -2.00%
Earnings:
Mon: ORCL,
Tues: GME,
Wed:
Thur: KR, ADBE
Fri:
Econ Reports:
Mon: Wholesale Inventories, Consumer Credit
Tue NFIB Small Business Optimism
Wed: MBA, CPI, Core CPI
Thur: Initial Claims, Continuing Claims, PPI, Core PPI, Treasury Budget
Fri: Import, Export, Michigan Sentiment
How am I looking to trade?
We Started taking protection off based on Technical Analysis
www.myhurleyinvestment.com = Blogsite
info@hurleyinvestments.com = Email
Questions???
Remember business cycles happen all the time!!!
CNBC Daily Open: Why markets aren’t always a good barometer for the economy
Published Sun, Sep 8 20249:10 PM EDTUpdated 4 Hours Ago
In this article
What you need to know today
Mixed jobs report
The U.S. economy added 142,000 nonfarm jobs in August. That’s fewer than the 161,000 expected by Dow Jones, but better than July’s revised 89,000. Unemployment in August ticked down to 4.2% from 4.3% as the labor force grew 120,000 for the month.
Slumping stocks
U.S. markets fell Friday, with the Nasdaq Composite sliding 2.55% to end the week more than 10% off its record close. All major indexes closed in the red for the week. The pan-European Stoxx 600 index lost 1.07%. The benchmark ended the week 2.5% lower, its biggest weekly loss in a month.
Sinking oil
It wasn’t just the stock market that had a bad week. The price of U.S. crude oil slumped 8% last week, clocking its worst week since June 2023. At its lowest, West Texas Intermediate’s October contract touched $67.16 per barrel. Next year’s not going to be any better: Bank of America slashed its price forecast for oil to $71 from $75.
Stiglitz and Yellen
Ahead of the jobs report, Nobel Prize-winning economist Joseph Stiglitz said the U.S. Federal Reserve raised rates “too far, too fast,” and a 50-basis-point cut would help both inflation and jobs. Meanwhile, U.S. Treasury Secretary Janet Yellen reassured the public on Saturday that she sees – and hopes to continue seeing – “a good, solid economy.”
[PRO] The bull limps on
The S&P 500 entered a bull market nearly two years ago, writes CNBC Pro’s Michael Santoli, spurred by the belief a soft landing’s the destination for the U.S. economy. But with the job market softening uncomfortably quickly and stock market leaders losing momentum, it remains a question how much the upcoming rate cuts will affect markets.
The bottom line
What do markets know that we don’t?
On Friday, the S&P 500 declined 1.73%, the Dow Jones Industrial Average lost 1.01% and the Nasdaq Composite sank 2.55%, capping off a losing week for all major U.S. indexes.
Big Tech stocks were among the worst performers. The names behind much of this year’s rally — Nvidia, Alphabet, Amazon — fell around 4% on Friday alone.
If the movement of markets is a barometer for the health of the economy, then we’re in for some bad times ahead.
That’s, however, a very big “if.” Markets are less an Excel formula than Word’s often random autocomplete suggestions.
What we do know from hard numbers is that the U.S. economy, while not doing too great, isn’t nearly as bad as stocks imply.
Job additions in August were substantially higher than in July, while the unemployment rate dipped for the month. Yes, the headline number’s lower than expected. But it breaks a downward-moving trend from May, suggesting the U.S. job market isn’t moving in the wrong direction.
Sure, the jobs report looks to the past while markets forecast the future. But the futures market itself is betting on a 65% chance for a 25-point cut in September, and only 35% for 50 points, according to the CME FedWatch tool.
That implies things in the economy aren’t so bad that the Fed will be forced to make a drastic cut. Adding to that, there hasn’t been any concrete news or earnings reports that have affected the fundamentals of Big Tech.
Further, Goldman Sachs and the Atlanta Federal Reserve recently revised their projection of third-quarter GDP upwards.
The stock market’s downbeat week, then, seems “a sentiment-driven move that’s largely driven by growth concerns,” said Emily Roland, co-chief investment strategist at John Hancock Investment Management.
Sometimes sentiment tells us things our gut knows but our brain doesn’t. Other times, we need to tell ourselves sense and sensibility are often at odds with sentiment.
– CNBC’s Jeff Cox, Sam Meredith, Samantha Subin, Pia Singh contributed to this story.
Correction: The U.S. economy added 89,000 jobs in July. A previous version of this report misstated the number.
DirecTV files FCC complaint against Disney for anti-competitive practices
Published Sun, Sep 8 20241:43 PM EDT
Key Points
- DirecTV filed a complaint with the Federal Communications Commission alleging that Walt Disney engaged in anticompetitive behavior.
- More than 11 million DirecTV subscribers have already lost access to Disney-owned channels, including ESPN, due to the dispute between the two companies.
In this article
Satellite TV provider DirecTV has filed a complaint with the U.S. Federal Communications Commission, accusing Walt Disney of failing to negotiate in good faith and engaging in anticompetitive behavior, the company said on Sunday.
In the complaint, DirecTV said Disney has imposed unreasonable conditions on the renewal of their distribution agreement, including demands for bundling and penetration requirements that a federal court recently ruled unlawful.
DirecTV also said that Disney has insisted on a “fat bundle” of channels, forcing the carrier to offer less popular programming while Disney provides consumers with cheaper, “skinnier” packages.
A Disney spokesperson, in response, said the company continues to negotiate with DirecTV and urged it to finalize a deal that would prioritize customers.
“We continue to negotiate with DirecTV to restore access to our content as quickly as possible,” the spokesperson said in an emailed statement to Reuters.
The dispute has already resulted in over 11 million DirecTV subscribers losing access to Disney-owned channels, including ESPN, ahead of the National Football League season.
The standoff comes amid a broader debate over the future of bundled programming in the streaming era, with DirecTV seeking to offer more flexible, lower-cost packages without ESPN, while Disney argues for protecting its flagship networks.
https://www.cnbc.com/2024/09/07/this-semiconductor-etf-smh-just-had-its-worst-week-since-2020.html
This semiconductor ETF just had its worst week since 2020. Here’s what’s next
Published Sat, Sep 7 20248:57 AM EDT
Jesse Pound@/in/jesse-pound@jesserpound
Chip stocks kicked off September with their worst stretch in over four years, as shares of artificial intelligence favorite Nvidia lost momentum and concerns over U.S. economic growth weighed on the market.
The VanEck Semiconductor ETF (SMH) sank 11.7% in the Labor Day-shortened, four-day trading week. That was its worst week since a 15.2% drop in March 2020, spurred by the Covid lockdown.
The sharp decline is just the latest twist in what has been a volatile summer for semiconductors. Over the past two months, the SMH has moved more than 5% on seven different trading days, according to FactSet. On Friday, it closed more than 24% below its July 10 all-time high.
This semiconductor ETF just had its worst week since 2020.
The SMH has more than $20 billion in assets and is one of the most actively traded funds on the market. Its top holdings include Nvidia and Taiwan Semiconductor Manufacturing.
To be sure, the semiconductor industry is no stranger to big swings. The sector is historically cyclical, tied to the ups and downs of the economy, and now it’s paired with the excitement around AI.
Analysts standing by
Today, however, Wall Street analysts are not abandoning ship, even with the recent turmoil.
“Weeks with the SOX declining 25% and then recovering 20%, all within the span of 6 weeks (what a long, strange trip it’s been). Our call – Just Keep Truckin’ On amidst the current mid-cycle correction and remain overweight semiconductors,” Cantor Fitzgerald analyst CJ Muse wrote in a Sept. 3 note. Muse confirmed in an email to CNBC on Friday that he stands by that call despite the rough week for chip stocks.
While there are struggles at some chipmakers — such as Intel, which announced layoffs in August — much of the sell-off seems unrelated to business fundamentals.
For example, shares of Broadcom tumbled 10.4% on Friday despite an earnings report the day before that topped analysts’ earnings and revenue estimates. While Broadcom’s third-quarter revenue guidance was slightly less than expected, there’s no cause for alarm, as the stock sell-off suggested, Bernstein analyst Stacy Rasgon said in a note to clients Friday.
“Nevertheless under the lid things are still simmering here,” Rasgon wrote. “The non-AI semi businesses at least appear to have bottomed (some starting to grow again) and the company has seen orders growing at 20%+ for the last few quarters; given their leadtimes this would suggest recovery over the next 2-4 quarters and setting up next year much better. The AI story still looks really good to us, with clear evidence of high demand and outlook for ‘strong’ growth next year.”
Broadcom fell more than 10% on Friday after its quarterly report.
Of course, it’s possible for some chip stocks to rebound even as a broad sector fund like the SMH — comprised of 26 stocks — struggles. VanEck itself launched a somewhat narrower version of the fund — the VanEck Fabless Semiconductor ETF (SMHX), with 22 stocks — last month.
The “fabless” fund is focused on companies that design chips but are not themselves major manufacturers. Nick Frasse, associate product manager at VanEck, said the idea for the new fund came from studying Nvidia which, togetrh with Broadcom, accounts for one-thid of the new fund’s portfolio.
The VanEck team decided that Nvidia’s asset-light business model was key to its success, and the new ETF is designed to capture companies with similar structures that, in theory, have the flexibility to focus more on innovation.
“When we looked at just kind of the long-term opportunity set, it seemed like fabless were going to be the names that were the long-term winners in the AI space,” Frasse said.
This summer sell-off, however, is hitting all types of semiconductors. SMHX, too, was down more than 12% last week.
Looking ahead, investors will likely get updates from several chipmakers next week at the Goldman Sachs Communacopia + Technology Conference. Executives from many of the largest semiconductor companies are scheduled to speak at the conference, including the CEOs of Nvidia and Advanced Micro Devices.
— With reporting contributed by CNBC’s Gina Francolla
Asia-Pacific markets mostly fall as Japan spending misses expectations; Hong Kong closes due to typhoon
Published Thu, Sep 5 20247:53 PM EDTUpdated Fri, Sep 6 20244:04 AM EDT
Key Points
- Japan’s household spending data for July rose 0.1% in real terms from the previous year, compared to a 1.2% rise expected from economists polled by Reuters, and a reversal compared to a 1.4% fall in June.
- Hong Kong’s markets will be shut today due to Super Typhoon Yagi.
Asia-Pacific markets mostly fell on Friday as investors brace for a crucial jobs report from the U.S. and digested household spending data from Japan.
Japan’s household spending data for July rose 0.1% in real terms from the previous year, compared to a 1.2% rise expected from economists polled by Reuters, and a reversal compared to a 1.4% fall in June.
Data from the country’s statistics bureau said the average household monthly expenditure for July 2024 was 290,931 yen ($2,031.35), up 3.3% in nominal terms from the previous year.
Average household monthly income came in at 694,483 yen in July, 8.9% higher in nominal terms and up 5.5% in real terms from the previous year.
The weak spending report could constrain the Bank of Japan’s options to raise rates, although this may be offset by the strong wage growth numbers from Thursday.
| TICKER | COMPANY | NAME | PRICE | CHANGE | %CHANGE |
| .N225 | Nikkei 225 Index | *NIKKEI | 36215.75 | -175.72 | -0.48 |
| .HSI | Hang Seng Index | *HSI | 17196.96 | -247.34 | -1.42 |
| .AXJO | S&P/ASX 200 | *ASX 200 | 7988.1 | -25.3 | -0.32 |
| .SSEC | Shanghai | *SHANGHAI | 2736.49 | -29.32 | -1.06 |
| .KS11 | KOSPI Index | *KOSPI | 2535.93 | -8.35 | -0.33 |
| .FTFCNBCA | CNBC 100 ASIA IDX | *CNBC 100 | 9597.2 | -136.37 | -1.4 |
Japan’s Nikkei 225 slipped 0.72% to close at 36,3191.47 and record its fourth straight losing day, and the broad based Topix was 0.89% lower at 2,597.42 after the data release.
7-Eleven’s parent company Seven & i Holdings fell 1.73%, after it rejected a takeover offer from Canadian convenience store operator Alimentation Couche-Tard.
South Korea’s Kospi was 1.21% lower, ending at 2,544.28 and the small cap Kosdaq tumbled 2.58% to also record a four day losing streak.
In contrast, Australia’s S&P/ASX 200 climbed 0.39%, finishing at 8,013.4.
In Hong Kong, the city’s markets will be shut today after the Hong Kong observatory issued a typhoon signal due to Super Typhoon Yagi.
The observatory expects to downgrade the storm signal at 12.40 p.m. Hong Kong time, meaning the markets are expected to be closed for the day. According to the Hong Kong Exchange, there will be no trading for the day should the Number 8 signal be downgraded after noon.
Mainland China’s CSI 300 traded 0.81% below the flatline, closing at a fresh seven month low of 3,231.35.
Get more from CNBC. Breaking news and updates on WhatsApp.
Overnight in the U.S., all three major indexes fell as investors dumped risk assets and concerns mounted over the outlook for the U.S. economy.
The S&P 500 dipped 0.3% for a third straight day of losses, while the Dow Jones Industrial Average lost 0.54%. The Nasdaq Composite gained 0.25% after rising as much as 1.2% earlier in the session.
—CNBC’s Samantha Subin and Jesse Pound contributed to this report.
SEC Fines 9 RIA Firms for Violating Marketing Rule
The Securities and Exchange Commission (SEC) announced the settlement of charges against nine registered investment advisors for violating the Marketing Rule by disseminating advertisements containing untrue or unsubstantiated statements of material fact, as well as testimonials, endorsements, or third-party ratings that lacked required disclosure.
All nine firms have agreed to settle the charges and pay $1.2 million in combined civil penalties.
The nine firms and their penalties are: Abacus Planning Group Inc ($150,000); AZ Apice Capital Management LLC ($70,000); Beta Wealth Group, Inc. ($80,000); Droms Strauss Advisors Inc. ($85,000); Howard Bailey Securities LLC ($90,000); Integrated Advisors Network LLC ($325,000); Professional Financial Strategies Inc. ($60,000); Richard Bernstein Advisors LLC ($295,000); and TS Bank d/b/a Callahan Financial Planning ($85,000).
Abacus and Callahan Financial “published advertisements with untrue statements about third-party ratings” and “Callahan Financial posted an advertisement falsely claiming that it was a member of an organization that did not exist,” according to the SEC.
AZ Apice, Callahan Financial, Droms Strauss, and Integrated Advisors “disseminated advertisements that claimed to provide conflict-free advisory services, which the firms were not able to substantiate,” the SEC said.
In addition, Beta Wealth disseminated advertisements “that it could not substantiate regarding an award provided to a firm principal” and “Howard Bailey disseminated advertisements claiming to contain two testimonials, but neither actually came from current clients,” according to the SEC orders. Howard Bailey also advertised endorsements “that did not disclose that the endorser was a paid, non-client of Howard Bailey in videos, on social media, and on physical objects such as bags and flags.”
Abacus, Beta Wealth, Professional Financial, and Richard Bernstein Advisors advertised third-party ratings, some of which were more than five years old, but did not disclose the dates or time periods on which the ratings were based, the SEC order stated.
“The Marketing Rule’s provisions regarding truthfulness, substantiation, and disclosure are critical to protecting investors. The advertisements at issue in each of these actions violated the Marketing Rule and posed a serious risk of misleading investors,” said Corey Schuster, Co-Chief of the SEC Division of Enforcement’s Asset Management Unit.
Without admitting or denying the SEC’s findings, all the firms consented that they violated the Investment Advisers Act of 1940. The regulator ordered them to be censured, cease and desist from violating the charged provisions, comply with certain undertakings, and pay the civil penalties.