
HI Market View Commentary 08-12-2024
What could tell that our market is currently doing? – Waiting for the Fed to act, Waiting to go doen again to retest the lows, trying to figure out what comes next
Right now we are working on making your accounts more cash heavy by booking long put profits
Adding more shares at lows before the Sept rate cut.
We are in the process of finding out if we bottomed or if we are going to have a double bottom
Where was people money running into the last couple of weeks: Some Mag 7, Cash, Dividend paying
Disney and this AI stock are among the most oversold stocks this week and could be due for a bounce
Published Sat, Aug 10 20246:19 AM EDT
The stock market clawed back from a global rout to finish higher Friday, but there still may be an opportunity for some names to rebound.
Stocks had a rough start to the week. Disappointing payrolls data coupled with an unraveling of the yen “carry trade,” not to mention concerns that the Federal Reserve has waited too long to cut interest rates, sent the major indexes reeling. But following optimistic weekly jobless claims data on Thursday, the indexes headed higher and the S&P 500 notched its best day since 2022.
The broad market S&P 500 gained 0.47% in Friday’s session, finishing the week down by just 0.04%. The Nasdaq Composite closed 0.51% higher, while the Dow Jones Industrial Average advanced 0.13% Friday.
With this in mind, CNBC Pro screened for the most overbought and oversold stocks on the Street, as measured by their 14-day relative strength index, or RSI. Stocks are considered overbought with a 14-day RSI above 70, meaning they may be at a risk of a pullback. Alternatively, stocks are viewed as oversold with an RSI below 30, which suggests a possible buying opportunity.
Most Oversold Stocks on Wall Street
| Symbol | Company | RSI | Analyst Consensus | Price Target + / – |
| MRNA | Moderna Inc | 19.19 | Hold | 51.33 |
| EL | Estee Lauder Companies Inc | 22.13 | Hold | 45.42 |
| ABNB | Airbnb Inc | 22.76 | Hold | 14.05 |
| MNST | Monster Beverage Corp | 23.67 | Buy | 25.57 |
| SMCI | Super Micro Computer Inc | 24.59 | Buy | 79.52 |
| INTC | Intel Corp | 24.74 | Hold | 34.13 |
| ULTA | Ulta Beauty Inc | 26.87 | Buy | 44.27 |
| EQT | EQT Corp | 27.06 | Buy | 43.09 |
| DIS | Walt Disney Co | 27.68 | Buy | 37.74 |
| TTWO | Take-Two Interactive Software Inc | 27.96 | Buy | 24.42 |
Source: LSEG
Disney may be due for a bounce higher with an RSI of 27.7. Shares of the company were down nearly 4% this week despite the entertainment giant topping Wall Street’s fiscal third-quarter estimates. In 2024, the stock, which has a consensus rating of buy, is even lower, dropping around 4.5%.
The company reported that its theme parks business in the U.S. was hit by a pullback in consumer demand. In an earnings call with analysts, Disney executives said they anticipate flat attendance in the quarters to come.
“We saw a slight moderation in demand. I certainly wouldn’t call it a significant change,” Disney Chief Financial Officer Hugh Johnston said. “I would just call this a bit of a slowdown that’s being more than offset by the entertainment business.”
Take-Two Interactive Software also made the cut in the oversold category, having the highest RSI in the group of nearly 28.
On Friday, shares of the video game maker closed higher by more than 4% after the company reiterated its full-year forecast for bookings and earnings. While shares are slightly positive on the week, up nearly 1%, the stock has tumbled 10% in 2024.
Take-Two Interactive Software, year-to-date
Other stocks that made the oversold group are artificial intelligence infrastructure play Super Micro Computer and Ulta Beauty.
There are also some names that may have surged too high and may be due for some losses ahead. Here is a look at the most overbought names on the Street.
Most Overbought Stocks on Wall Street
| Symbol | Company | RSI | Analyst Consensus | Price Target + / – |
| K | Kellanova | 87.23 | Hold | -5.81 |
| LMT | Lockheed Martin Corp | 84.93 | Buy | -2.21 |
| CBOE | Cboe Global Markets Inc | 83.10 | Buy | -2.05 |
| VTR | Ventas Inc | 81.41 | Buy | -1.93 |
| O | Realty Income Corp | 76.31 | Buy | 3.14 |
| AXON | Axon Enterprise Inc | 75.32 | Buy | 1.00 |
| NOC | Northrop Grumman Corp | 75.01 | Hold | 5.38 |
| ICE | Intercontinental Exchange Inc | 74.49 | Buy | 9.37 |
| CTLT | Catalent Inc | 74.39 | Hold | -0.92 |
| WELL | Welltower Inc | 74.29 | Buy | -1.31 |
Source: LSEG
https://www.briefing.com/the-big-picture
The Big Picture
Last Updated: 02-Aug-24 15:47 ET | Archive
Putting “things” in context
When the past week began the U.S. economy was on a comfortable soft landing trajectory, the market was comfortable with the Fed’s first rate cut coming in September, and the small-cap stocks were all the rage. When this week ended, the U.S. economy was headed for a hard landing, the Fed had made a mistake not cutting rates at its July FOMC meeting, and the small-cap stocks were creating a good bit of rage for recent buyers.
We have simplified things here, but the point is that there was a sea-change in sentiment in just a few days’ time. That change manifested itself in broadly lower stock prices, broadly higher Treasury prices, and a weaker dollar.
What happened? Read on for context.
A Perfect Storm
In many respects it was a perfect storm for the stock market, which was already battling some valuation angst, meaning it was vulnerable to upset if “things” didn’t go its way. Well, several things arguably did not go its way.
These things explained below are in no particular order, as they all fed off each other to catalyze the stock market sell-off.
- Key economic data threw off slowdown/recession signals.
- The July ISM Manufacturing Index checked in at 46.8% versus 48.5% in June. The dividing line between expansion and contraction is 50.0%, so the July reading suggests there was a faster pace of contraction in the manufacturing sector last month. This was the fourth straight month (and 20th out of 21) that economic activity in the manufacturing sector contracted.
- Initial jobless claims for the week ending July 27 increased by 14,000 to 249,000. That is the highest level since August 2023. Continuing jobless claims for the week ending July 20 increased by 33,000 to 1.877 million. That is the highest level since November 27, 2021.
- Nonfarm payrolls increased by a smaller-than-expected 114,000 in July, the unemployment rate increased to 4.3% from 4.1%, the U-6 unemployment rate, which also accounts for underemployed workers, rose to 7.8% from 7.4%, and average hourly earnings growth on a year-over-year basis decelerated to 3.6% from 3.8%.
- The Bank of Japan raised its uncollateralized overnight call rate to “around 0.25%” from “around 0.0 to 0.1%” and announced a plan to reduce the JGB purchase amount by 400 billion yen each calendar quarter.
- In straightforward terms, the Bank of Japan raised interest rates and curtailed its quantitative easing plan. That combination added more fuel for the yen, which has been strengthening quickly against the dollar, aided first by intervention support and secondly by monetary policy considerations that are expected to narrow interest-rate differentials between Japan and other developed markets.
- Ultra-low interest rates in Japan enabled traders to borrow at low rates in Japan and invest in higher-yielding assets elsewhere. That is an advantageous trade if rates remain low and the yen remains weak, but it becomes less advantageous when those conditions reverse. Accordingly, with rates going up in Japan and the yen strengthening, so-called “carry trades,” which included added leverage in some cases, became less profitable (or losing propositions), and prompted some unwinding action.
- Since rates had been ultra-low for so long in Japan and the yen had been weakening for some time, these carry trades presumably ran deep across markets, so their unwinding had widespread impact.
- The Federal Reserve did not cut the target rate for the fed funds rate at its July meeting.
- The decision to stand pat was all well and good… until the aforementioned data hit. When those reports were released, the market’s pent-up recession fear was released. In an instant, market participants were unnerved by the thought that the economy could be headed for a hard landing while the Fed still hasn’t moved to cut rates.
- Recessions are undeniably bad for earnings prospects, so market participants were forced to consider a future of earnings disappointments that conflict with stocks currently trading with rich valuations.
- Fear that the Fed is poised to make another policy mistake (i.e., by waiting too long this time to cut rates) triggered a risk aversion trade that benefitted Treasuries and hurt stocks.
- Israel allegedly orchestrated the killing of a top Hamas leader in Tehran. That killing prompted Iran’s Ayatollah to condone a direct strike on Israel.
- One could make a case that this consideration was not a major factor for the market. Falling crude oil prices would be a reasonable defense for that argument, but economic concerns ultimately outweighed this geopolitical tension as a price driver.
- The latter point notwithstanding, there are festering worries that the Israel-Hamas war could turn into a wider regional conflict. Those worries were elevated with the Ayatollah condoning a direct attack on Israel, thereby contributing to a general risk aversion trade that undercut stocks and helped Treasuries.
- Political polls showed former President Trump and Vice President Harris in a tightening race.
- According to RealClear Politics, former President Trump leads Vice President Harris by 1.2 points based on an average of the polls. That is within the average margin of error and down from 1.9 points a week ago.
- The market has preconceived notions that former President Trump would be the more market-friendly candidate given his call for deregulation, lower corporate tax rates, and the extension of the 2017 tax cuts.
- With polls showing a more uncertain outcome, one might assume that there was some recalibration for the possibility that Vice President Harris wins and there is a push to raise corporate tax rates and not to extend the 2017 tax cuts, which expire at the end of 2025.
- The mega-cap stocks didn’t necessarily live up to investors’ high expectations.
- That wasn’t the case for all of them. Meta Platforms (META) and Apple (AAPL), for instance, traded higher after their reports, but Tesla (TSLA), Alphabet (GOOG), Microsoft (MSFT), and Amazon.com (AMZN) all traded lower in the wake of their results.
- A deceleration in growth rates prompted some of the selling, as did misgivings about the ultimate return on investment of heavy AI spending.
- Until recently, there were no chinks in the armor of these stocks (Tesla being a primary exception). The notion that there could be a growth slowdown in the near term fostered an inclination to pare exposure amid heightened worries about concentration risk.
- The indices felt the weight of their collective losses.
- Momentum cut the other way
- There was momentum buying on the way up, and there has been momentum selling on the way down with the S&P 500, Nasdaq Composite, Dow Jones Industrial Average, and Russell 2000 all testing and/or violating support at their 50-day moving averages.
- The fear of further downside manifested itself in the CBOE Volatility Index, which spiked as much as 81% this week to 29.66 before pulling back.
What It All Means
The losses that piled up this week were different. They were different because they weren’t a byproduct of a normal consolidation trade, where stocks simply retreat because they have run up in price too far, too fast. There was some of that, but the difference this week was that the selling activity was imbued with real growth concerns.
Some of those concerns were related to difficult comparisons for the mega-cap companies and other growth stocks stemming from a realization that, while earnings and revenue are still growing, the pace at which they are doing so isn’t as fast as it used to be.
The root of the concerns, however, related to economic growth. We can make that connection looking at how the market behaved on Thursday and Friday, respectively, or after the concerning economic data were released:
- The Russell 2000, which houses small-cap companies with a mostly domestic sales orientation, was down 6.5% and was the biggest index loser.
- The worst-performing S&P 500 sectors were the consumer discretionary (-7.0%), information technology (-5.3%), energy (-5.0%), industrials (-4.1%), and financial (-4.0%) sectors.
- The best-performing S&P 500 sectors were the consumer staples (+1.7%), real estate (+1.5%), utilities (+1.5%), and health care (+0.6%) sectors.
- The fed funds futures market, according to the CME FedWatch Tool, is assigning a 70.5% probability to a 50-basis points rate cut at the September FOMC meeting versus a 22.0% probability the day before the July employment report was released.
- The 2-yr note yield dropped 38 basis points to 3.88% and the 10-yr note yield dropped 25 basis points to 3.80%, yet stocks sold off as Treasury yields plummeted.
The latter was perhaps the most eye-opening development. The pre-existing valuation angst might have prompted some selling interest even if this week’s “things” didn’t happen. Lower market rates, all else equal, are valuation friendly.
The interpretation of “things” this week, though, was that these weren’t friendly developments, so there wasn’t valuation relief. Rather, there was more valuation angst wrapped in concerns earnings growth prospects won’t measure up to expectations because the economy won’t measure up to the soft landing/no landing expectations.
—Patrick J. O’Hare, Briefing.com
(Editor’s Note: The next installment of The Big Picture will be published the week of August 12)
Earnings dates:
BIDU 08/22 BMO
DG 08/29 est
MU 09/25 est
TGT 08/21 BMO
Where will our markets end this week?
Higher to flat
DJIA – Bearish
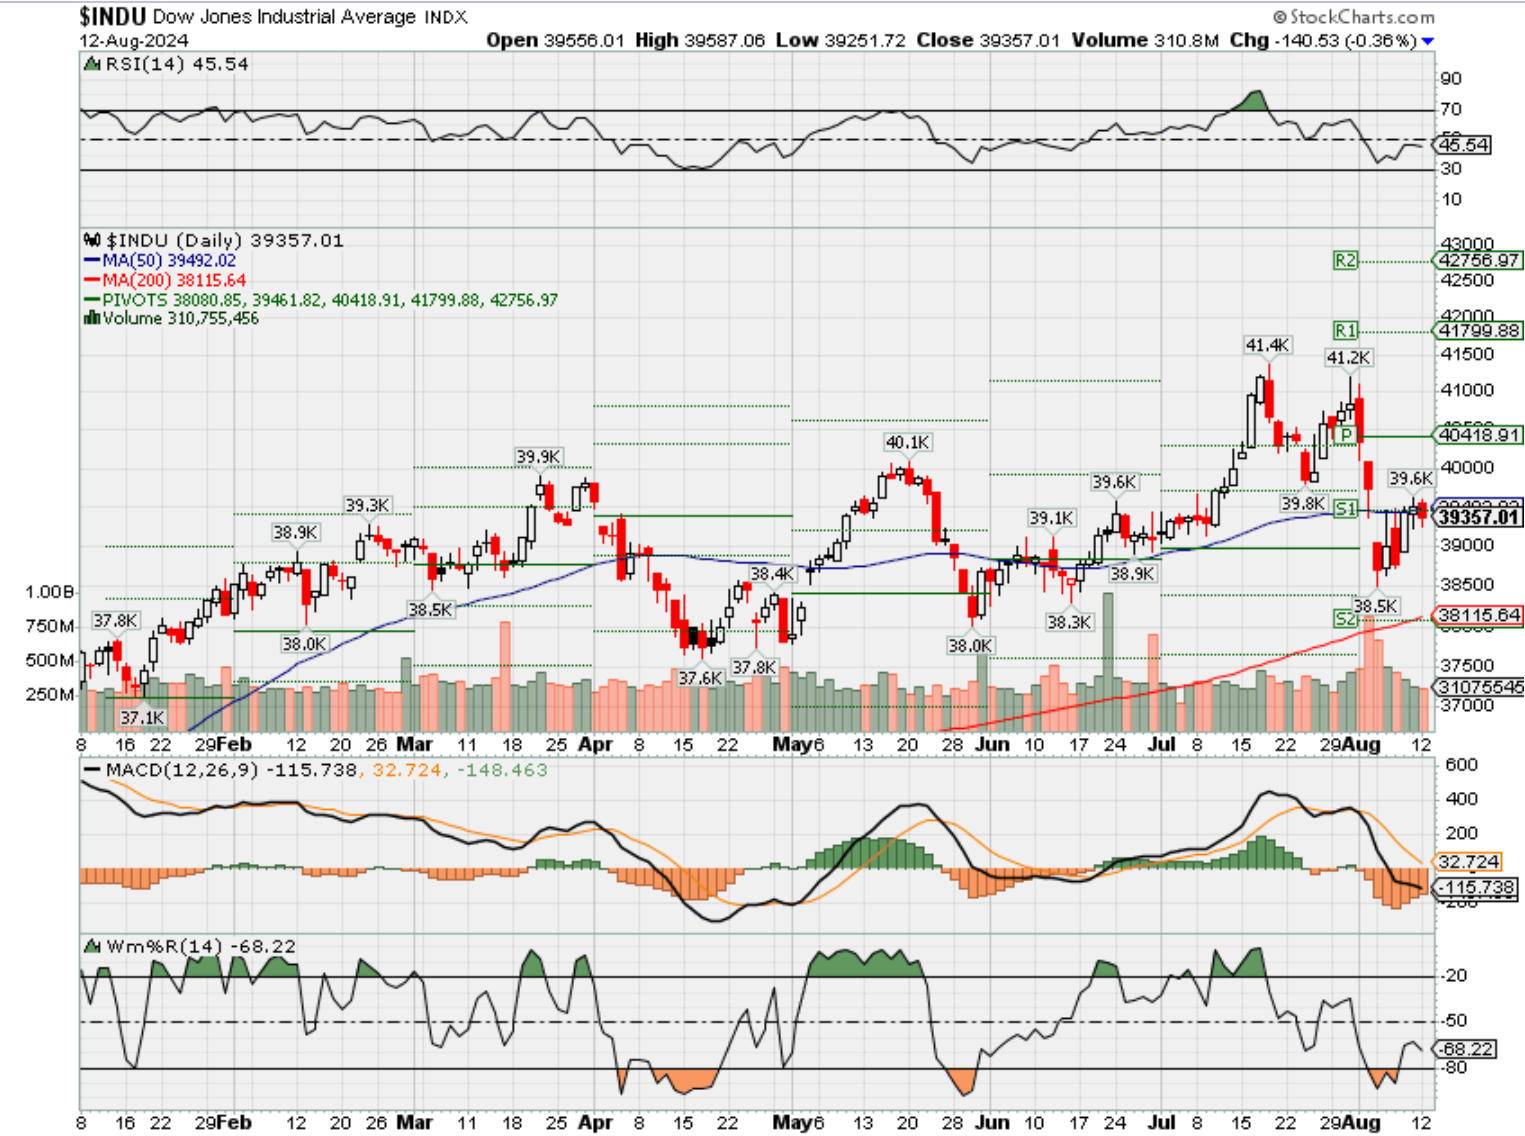
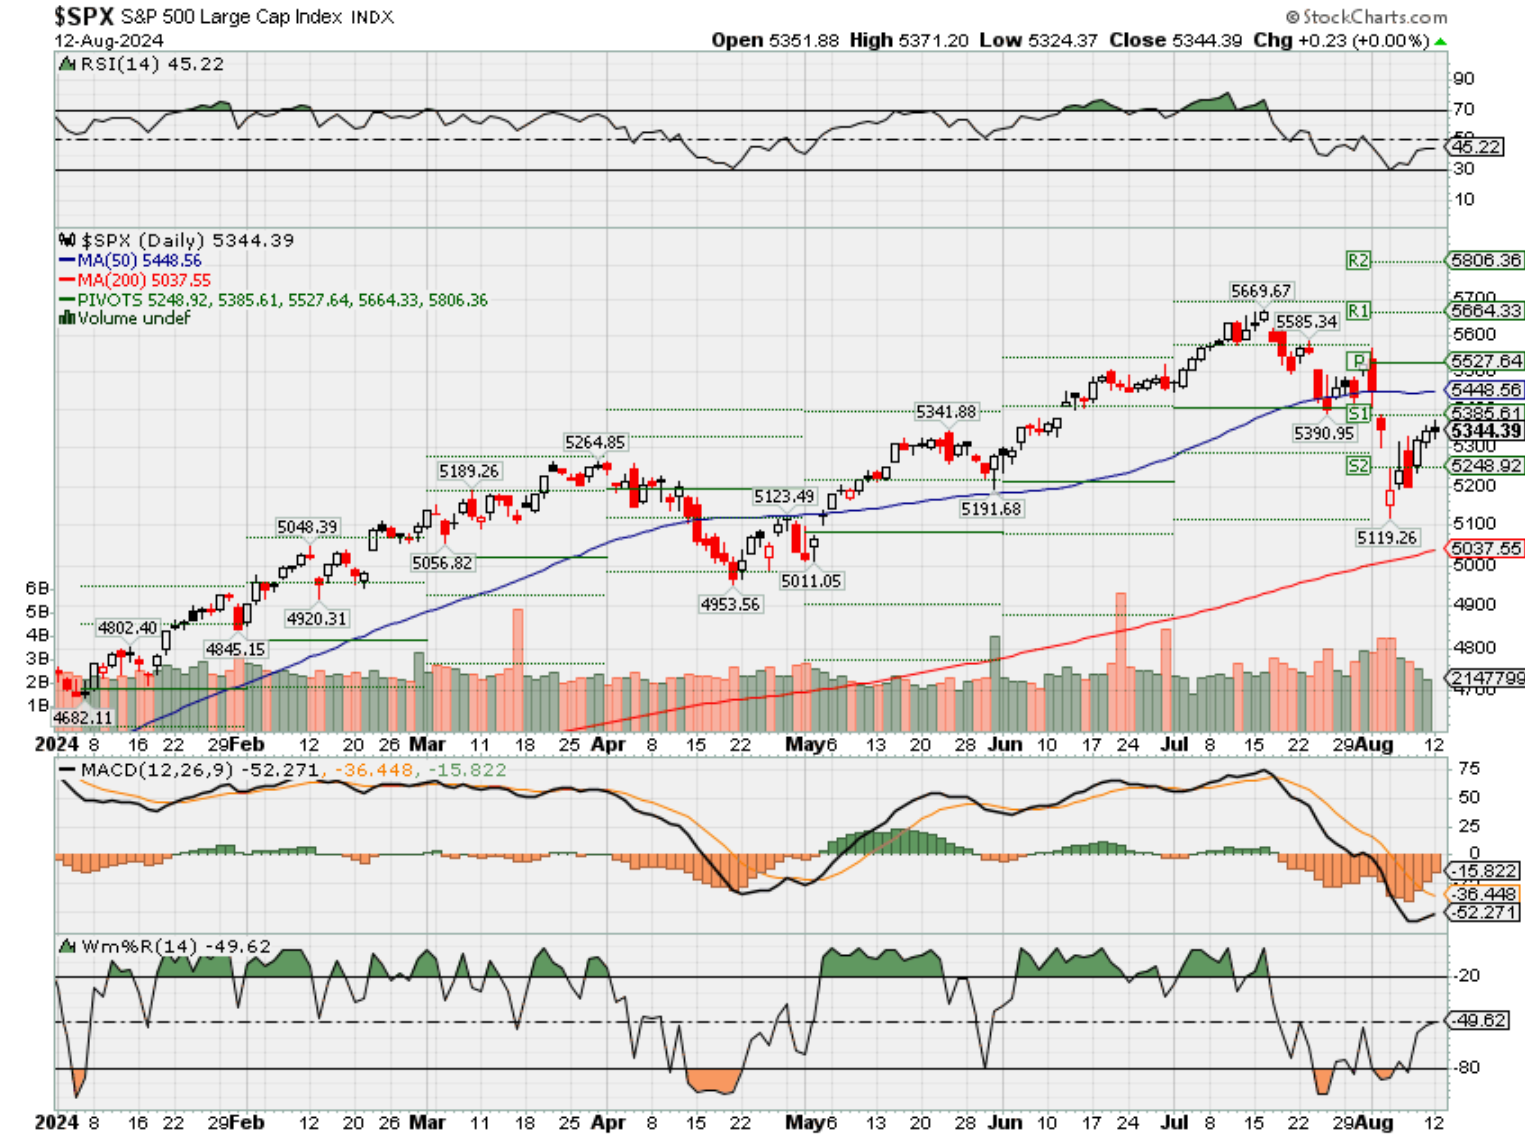
SPX – Bearish
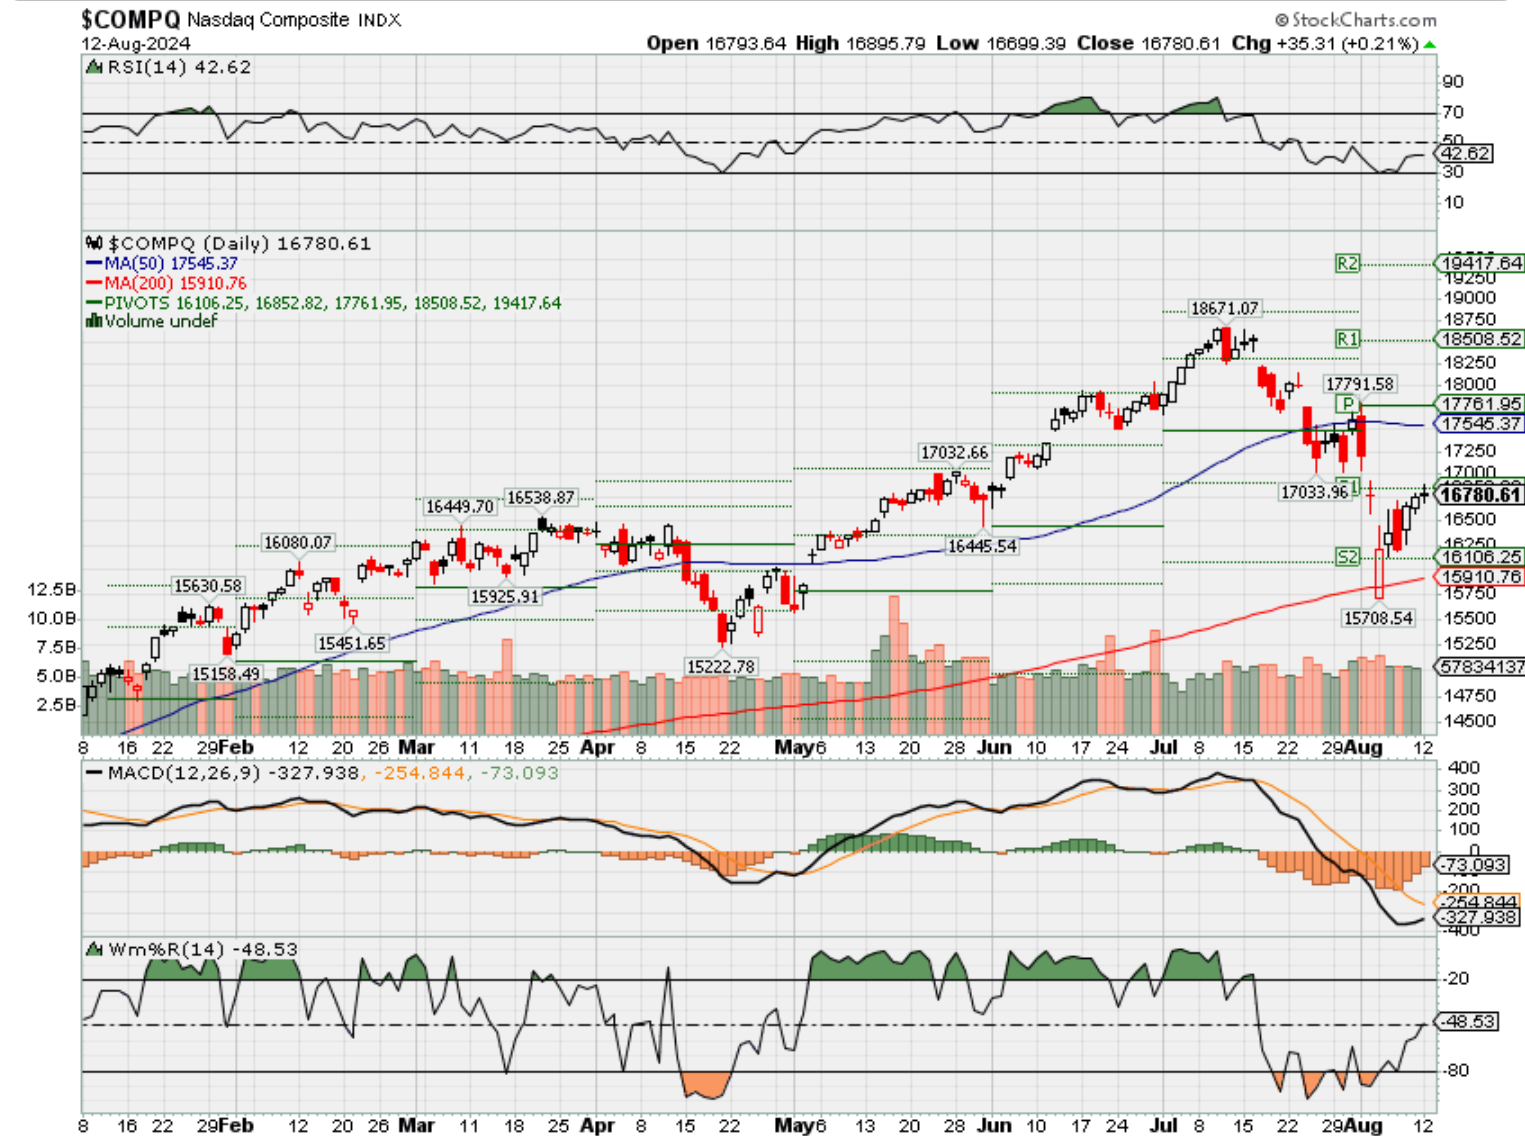
COMP – Bearish
Where Will the SPX end July 2024?
08-12-2024 -2.00%
08-05-2024 -2.00%
Earnings:
Mon:
Tues: HD, TME, XP
Wed: CAH, CSCO
Thur: TPR, WMT
Fri:
Econ Reports:
Mon: Treasury Budget
Tue PPI, Core PPI
Wed: MBA, CPI, Core CPI
Thur: Initial Claims, Continuing Claims, Retail Sales, Retail Ex-Auto, Capacity Utilization, Industiral Production, Business Inventories, NAHB Housing Market Index, Empire Manufacturing
Fri: OPTIONS EXPIRATION, Building Permits, Housing Starts, Michigan Sentiment
How am I looking to trade?
We Started taking protection off based on Technical Analysis
www.myhurleyinvestment.com = Blogsite
info@hurleyinvestments.com = Email
Questions???
https://finance.yahoo.com/news/warning-warren-buffet-selling-stocks-134747333.html?guccounter=1
Warning: Warren Buffett is selling stocks. A lot
Investing.com
Warren Buffett’s Berkshire Hathaway (NYSE:BRKa) was aggressively cutting his exposure to equities in the second quarter, new filings showed.
The company’s financial statements indicated that a net amount of $75.5 billion worth of stocks were sold in the three months through June.
Buffett was seen selling nearly half of its stake in Apple (NASDAQ:AAPL) during the second quarter, a move which contributed to an increase in Berkshire’s cash reserves to $276.94 billion.
His Berkshire reported operating earnings for the second quarter of $11.6 billion.
The recent sales include Berkshire’s systematic reduction of its investment in Bank of America, previously the firm’s second-largest stock holding after Apple. Berkshire cut its stake in the bank to 12.15%, which was valued at over $35 billion as of the market close on Friday.
This sell-off occurred after Bank of America shares experienced a 75% surge from a low in late October up to the point when Berkshire initiated the sale in July.
At Berkshire’s annual meeting in May, Buffett highlighted the difficulty in deploying the company’s cash, emphasizing a preference for investments with minimal risk and high return potential.
Berkshire’s quarterly filing also revealed that after cutting its Apple investment by 13% in the first quarter, the company proceeded to sell about 49% of its remaining Apple stock in the second quarter.
The news that Buffett sold $75.5 billion worth of shares in Q2 comes at a delicate time for the U.S. stock market, which experienced a massive selloff on Friday after a softer-than-expected jobs report.
Concerns are mounting among investors as economic indicators suggested a more rapid deceleration of the U.S. economy than previously anticipated. Following the latest set of economic data, traders are increasingly viewing bad news as actually bad news.
The Federal Open Market Committee (FOMC) is now in a challenging position. Several major Wall Street banks, including Citi and JPMorgan, are now calling for the Fed to implement bps rate cuts at upcoming meetings in September and November.
Markets are counting on the Fed to head off recession with sizable interest rate cuts
Published Tue, Aug 6 20242:15 PM EDTUpdated Wed, Aug 7 20247:45 AM EDT
Jeff Cox@jeff.cox.7528@JeffCoxCNBCcom
Key Points
- In the market’s eyes, the Fed finds itself either poised to head off recession or doomed to repeat the mistakes of its recent past.
- “No recession today, but one is increasingly inevitable by year-end if the Fed fails to act,” said Steve Blitz, chief U.S. economist at TS Lombard.
- Traders are pricing in a half-point September cut, followed by aggressive easing that could lop 2.25 percentage points off the Fed’s short-term borrowing rate by the end of next year.
Federal Reserve Chairman Jerome Powell takes a question from a reporter during a news conference following a Federal Open Market Committee meeting at the William McChesney Martin Jr. Federal Reserve Board Building on July 31, 2024 in Washington, DC.
Andrew Harnik | Getty Images
In the market’s eyes, the Federal Reserve finds itself either poised to head off a recession or doomed to repeat the mistakes of its recent past — when it was too late seeing a coming storm.
How Chair Jerome Powell and his cohorts at the central bank react likely will go a long way in determining how investors negotiate such a turbulent climate. Wall Street has been on a wild ride the past several days, with a relief rally Tuesday ameliorating some of the damage since recession fears intensified last week.
“In sum, no recession today, but one is increasingly inevitable by year-end if the Fed fails to act,” Steven Blitz, chief U.S. economist at TS Lombard, said in a note to clients. “But they will, beginning with a [half percentage point] cut in September telegraphed in late August.”
Blitz’s comments represent the widespread sentiment on Wall Street — little feeling that a recession is an inevitability unless, of course, the Fed fails to act. Then the probability ramps up.
Disappointing economic data recently generated worries that the Fed missed an opportunity at its meeting last week to, if not cut rates outright, send a clearer signal that easing is on the way. It helped conjure up memories of the not-too-distant past when Fed officials dismissed the 2021 inflation surge as “transitory” and were pressed into what ultimately was a series of harsh rate hikes.
Now, with a weak jobs report from July in hand and worries intensifying over a downturn, the investing community wants the Fed to take strong action before it misses the chance.
Traders are pricing in a strong likelihood of that half-point September cut, followed by aggressive easing that could lop 2.25 percentage points off the Fed’s short-term borrowing rate by the end of next year, as judged by 30-day fed funds futures contracts. The Fed currently targets its key rate between 5.25%-5.5%.
“The unfortunate reality is that a range of data confirm what the rise in the unemployment rate is now prominently signaling — the US economy is at best at risk of falling into a recession and at worst already has,” Citigroup economist Andrew Hollenhorst wrote. “Data over the next month is likely to confirm the continued slowdown, keeping a [half-point] cut in September likely and a potential intermeeting cut on the table.”
Emergency cut unlikely
With the economy still creating jobs and stock market averages near record highs, despite the recent sell-off, an emergency cut between now and the Sept. 17-18 open market committee seems a longshot to say the least.
That it’s even being talked about, though, indicates the depth of recession fears. In the past, the Fed has implemented just nine such cuts, and all have come amid extreme duress, according to Bank of America.
“If the question is, ‘should the Fed consider an intermeeting cut now?’, we think history says, ‘no, not even close,’” said BofA economist Michael Gapen.
Lacking a catalyst for an intermeeting cut, the Fed is nonetheless expected to cut rates almost as swiftly as it hiked from March 2022-July 2023. It could start the process later this month, when Powell delivers his expected keynote policy speech during the Fed’s annual retreat in Jackson Hole, Wyoming. Powell is already being expected to signal how the easing path will unfold.
Joseph LaVorgna, chief U.S. economist at SMBC Nikko Securities, expects the Fed to cut rates 3 full percentage points by the end of 2025, more aggressive than the current market outlook.
“Go big or go home. The Fed has clearly said that rates are too high. Why would they be slow at removing the tightness?” he said. “They’ll be quick in cutting if for no other reason than rates aren’t at the right level. Why wait?”
LaVorgna, though, isn’t convinced the Fed is in a life-or-death battle against recession. However, he noted that “normalizing” the inverted yield curve, or getting longer-dated securities back to yielding more than their shorter-dated counterparts, will be an integral factor in avoiding an economic contraction.
Over the weekend, Goldman Sachs drew some attention to when it raised its recession forecast, but only to 25% from 15%. That said, the bank did note that one reason it does not believe a recession is imminent is that the Fed has plenty of room to cut — 5.25 percentage points if necessary, not to mention the capacity to restart its bond-buying program known as quantitative easing.
Still, any quakes in the data, such as Friday’s downside surprise to the nonfarm payrolls numbers, could ignite recession talk quickly.
“The Fed is as behind the economic curve now as it was behind the inflation curve back in 2021-2022,” economist and strategist David Rosenberg, founder of Rosenberg Research, wrote Tuesday. He added that the heightened expectation for cuts “smacks of a true recession scenario because the Fed has rarely done this absent an official economic downturn — heading into one, already in one, or limping out of one.”
Disney raises streaming prices for Hulu, Disney+ and ESPN+
Published Tue, Aug 6 20241:00 PM EDTUpdated Tue, Aug 6 20241:52 PM EDT
Key Points
- Starting mid-October, most plans for Disney+, Hulu and ESPN+ will cost $1 to $2 more per month.
- The price hikes come as Disney continues to push its customers toward bundles to get a bigger bang for their buck.
In this article
The atmosphere at the Disney Bundle Celebrating National Streaming Day at The Row in Los Angeles on May 19, 2022.
Presley Ann | Getty Images Entertainment | Getty Images
Disney is raising prices on its streaming platforms.
Starting mid-October, most plans for Disney+, Hulu and ESPN+ will cost $1 to $2 more per month, according to a press release Tuesday. The most expensive plans for Hulu, which include live TV, will cost $6 more per month.
Disney+ basic and premium will be priced at $9.99 and $15.99, respectively. Hulu with ads will cost $9.99 monthly, while Hulu without adds will cost $18.99 per month. ESPN+, which features ads, will cost $11.99 per month.
The price hikes come as Disney continues to push its customers toward bundles to get a bigger bang for their buck.
For some time, Disney has offered a bundle of its own services, either Hulu and Disney+, or the two streaming services plus ESPN+. The existing bundle of Disney+ and Hulu, with ads, will also get a price hike this fall, up $1 to $10.99 per month. The same bundle without ads won’t see any price increase from the current rate of $19.99 per month.
Disney has also partnered with Warner Bros. Discovery to offer a bundle, which will include Disney+, Hulu and Max. In July, the companies announced the bundle would be available for $16.99 with ads, and $29.99 commercial free, noting “a savings of 38% compared with the price of the services purchased separately.”
Disney also aims to entice subscribers with ABC News Live and a playlist featuring preschool content, available to all subscribers starting Sept. 4, according to the release Tuesday. The company plans to introduce four more curated playlists for premium subscribers.
“Playlists are the latest example of how we’re providing the best value and experience for our subscribers every time they open Disney+,” Alisa Bowen, president of the streaming platform, said in the news release.
Disney reports its fiscal third-quarter earnings before the bell on Wednesday.
Mag 7’ stocks are cheap and a buy after sell-off as long as no recession, Morgan Stanley says
Published Wed, Aug 7 20244:27 PM EDTUpdated Wed, Aug 7 20244:32 PM EDT
In this article
Stocks tried to claw back some gains on Wednesday, but the morning’s rally fizzled as Nvidia and other megacap technology stocks sold off in the afternoon.
Nvidia shares ended the day down 5.1%, while Tesla tumbled 4.4%. Meta Platforms shed about 1.1%, while Microsoft slipped 0.3%. All told, the tech-heavy Nasdaq Composite closed down 1.1% at 16,195.81. The Dow Jones Industrial Average and the S&P 500 also ended the day lower.
This week’s steep sell-off of the market’s reigning technology leaders could be a buying opportunity, if the U.S. manages to skirt a recession, Morgan Stanley said.
On the heels of Monday’s pullback, analyst Erik Woodring argued that valuations for the group sit 30% off their 5-year trailing highs, 50% above their lows for that period and in-line with the average. However, when adjusting for future earnings-per-share growth, the stocks trade at a 40% discount.
“As a result, we’d conclude that while Mag 7 valuations still face significant downside valuation risk in a black swan or recession scenario, current Mag 7 valuations relative to future growth prospects are attractive after the recent drawdown,” he wrote.
As of Wednesday’s close, the group is down about 8.6% on average since the start of the month, underperforming both the S&P and Nasdaq. Investors have been rotating out of the sector in recent weeks, with the sell-off accelerating Monday on the heels of a weak July jobs report Friday and the unwinding of the yen “carry trade.”
AI darling Nvidia currently sits 37% off its all-time closing high, while the tech-heavy Nasdaq has declined 15%.
https://www.ksl.com/article/51092420/consumer-credit-card-debt-hits-all-time-high-of-114-trillion
Consumer credit card debt hits all-time high of $1.14 trillion
By Art Raymond, Deseret News | Posted – Aug. 11, 2024 at 7:16 a.m.
A woman uses her credit card to make her purchase at Trader Joe’s in Draper on March 3, 2023. A record high U.S. credit card rate of 24.84% is helping drive a growing debt cycle. (Scott G Winterton, Deseret News)
SALT LAKE CITY — U.S. consumers are carrying more debt than ever before on their credit cards with outstanding balances reaching $1.14 trillion in the second quarter of the year, according to a new report from the Federal Reserve Bank of New York.
Credit card balances grew by $27 billion over the first three months of 2024, according to the report, and are up 5.8% over last year. Delinquency rates for credit card holders also increased slightly last quarter with 9.1% of card holders now in default on their outstanding balances.
Earlier this week, Bankrate released new data showing that 50% of U.S. credit card users are carrying a balance on their accounts, up from 44% in January and a rate not seen since the early days of the pandemic.
“Credit card balances fell sharply in 2020 as many Americans spent less during the pandemic and used stimulus funds to pay down debt,” said Bankrate senior credit card analyst Ted Rossman in the report. “Since the beginning of 2021, however, credit card balances have been off to the races. According to Federal Reserve data, Americans owe 45% more now on their credit cards than they did in early 2021. And the credit card delinquency rate is at its highest point since 2011.”
Report ad
The report notes that while carryover credit card debt rises with age to a certain point, those with higher incomes carry balances at a lower rate than those with lower earnings. Bankrate reports 42% of Gen Zers, 53% of millennials, 60% of Gen Xers and 48% of baby boomers with credit cards carry a balance from month to month. Looking at the relationship of income levels to credit card balances, 58% of cardholders with annual household incomes under $50,000 carry a balance month to month, compared to 54% with annual household incomes between $50,000 and $79,999, 46% with annual household incomes between $80,000 and $99,999 and 43% with annual household incomes of $100,000 or more.
What’s your interest?
Record-high credit card interest rates are exacerbating the collective consumer credit card debt cycle with the average credit card interest rate now at 24.84%, according to a report from LendingTree.
As of the end of July, the average U.S. credit card rate has now gone 29 straight months without a decrease. While rates have held steady on a month-to-month basis several times in the period, they haven’t decreased since they dipped by two-hundredths of a percentage point in February 2022 — the month before the Federal Reserve began raising rates to try to combat inflation, according to LendingTree.
An individual’s credit score can have a big impact on the rates charged by card issuers, according to the report. An applicant with very good credit can expect an average APR of 21.41% while someone with poor credit history will see an average APR offer of 28.28%.
Here’s an example of how those credit differences are reflected in interest payments if the card holder pays off an outstanding balance over time, calculated by LendingTree. For someone who has spent $5,000 on a card and pays $250 a month on their balance:
- With a rate of 28.28%, you’ll pay $1,842 in interest and take 28 months to pay it off.
- Lower the rate to 21.41% and you’ll pay just $1,239 in interest and take 25 months to pay it off.
- That’s a savings of $603 in interest and three months in payoff time. In normal times, given that most Americans’ financial margin for error is tiny, that’s a big deal. However, these aren’t normal times, so those savings are even more important.
https://www.ksl.com/article/51093969/study-us-emitting-methane-at-4-times-rate-estimated-by-epa
Study: US emitting methane at 4 times rate estimated by EPA
By Amy Joi O’Donoghue, Deseret News | Posted – Aug. 11, 2024 at 12:24 p.m.
Stephen Foulger, an environmental scientist with the Utah Department of Environmental Quality, ties a pink ribbon around a pipe fitting that has a small gas leak at an oil pump site near Roosevelt on Dec. 1, 2021. (Scott G Winterton, Deseret News)
SALT LAKE CITY — A specially equipped jet aircraft measured 70% of the nation’s sites of onshore oil and gas production to detect the level of methane emissions — a supercharged pollutant with harmful health implications and a costly waste for industry.
The Environmental Defense Fund’s MethaneAir research jet found producers across the U.S. are emitting methane into the atmosphere at over four times the rates estimated by the Environmental Protection Agency for those same areas, based on industry-reported data. The results also show that operators are exceeding their own emissions goals by as much as eightfold.
The remote sensing tools make it possible to weigh the accuracy of reported methane emissions at the basin and sub-basin levels, from a diversity of oil and gas producing regions, for the first time. This in turn will help inform key policy and regulatory developments, including emissions reporting and state and federal implementation of EPA standards to cut oil and gas methane pollution.
The data compiled from over 30 flights from June to October last year showed the aggregate emission rate observed across large portions of the country’s 12 major production basins would amount to 7.5 million metric tons per year (or about 860 metric tons of methane pollution every hour). The EDF says that’s enough wasted gas to meet the annual energy needs of over half of U.S. homes. And the Uinta Basin in eastern Utah has the country’s highest loss rate of 7.8%, per the analysis.
“Utah must work with oil and gas companies to reduce methane waste. Wasted methane not only adversely affects those living in the basin but is also an economic loss for companies and taxpayers,” said Nini Gu, a regulatory and legislative manager at EDF. “We applaud the state for its Beehive Emission Reduction Plan and hope that, along with a strong state plan for new oil and gas methane standards, will make Utah and the Uinta Basin a safer and healthier place to live.”
Utah’s methane struggles are nothing new
A 2021 study conducted by Utah researchers concluded the basin has a high leakage rate of 6% to 8% in that region — much higher than what was reported as 2.3% for the national average. Part of that is due to an abundance of low-producing wells.
This EDF probe discovered data that shows:
- Highest total emissions were seen in the Permian Basin, followed by Appalachian and Haynesville basins, in terms of absolute emissions.
- Gas-dominant basins with high well-site productivity (Appalachian, Haynesville) have comparatively lower, though still unacceptably high, methane loss rates.
- Relatively mature basins where oil/gas production and infrastructure is dominated by aging, leak-prone, low producing wells — such as Uinta — have extremely high methane loss rates possibly due in part to fugitive methane emissions that continue to go unaddressed even as production declines.
Rikki Hrenko-Browning, president of the Utah Petroleum Association, said her organization has not had a chance to review the data and the methodology, so she could not comment directly on the EDF findings.
She did stress the industry is constantly acting to contain emissions.
“As an industry, we evolve perpetually to optimize our operations to prevent fugitive methane emissions. The reasons for this are twofold: 1) The thousands of employees who work in our industry are stewards of the environment as they work to provide the power we need for our daily lives,” she said. “They work diligently to protect the environment at every step of the oil and gas development process and adhere to all local and federal regulations; and 2) Methane is one of the saleable products we produce, and keeping it in our tanks and pipes simply makes good business sense.”
Utah producers have taken a host of voluntary actions to reduce emissions, such as installation of solar pumps, tank isolation valves and its own flyovers, she said. Information on those efforts can be found here.
The EDF research says not only does the methane pose pollution and health implications for the United States but has the potential for global implications.
U.S. operators may face new emissions standards to be developed for gas shipped into the European Union, the world’s largest market for imported gas. It adds that mitigation of supply chain methane footprints are also under discussion in South Korea and Japan, both major markets for internationally traded gas. The financial losses are huge, according to EDF, which says the wasted natural gas is worth an estimated $48 million every year, which costs Utah taxpayers about $6.7 million in lost potential tax revenue.
Addressing the problem
The Utah Legislature has provided funding for the ULend program in which infrared cameras, valued at $100,000, are lent to small oil and gas producers to detect leaks.
State regulators say the program accomplishes a couple of different wins — helping producers stop leaks and recover a marketable product, and of course the resulting pollution reductions.
Logan Mitchell, an atmospheric scientist who helped conduct the 2021 study and now works as climate scientist and air quality scientist for Utah Clean Energy, said there needs to be greater emphasis on capturing methane.
“I mean, we have the technology to find and capture this wasted gas, this wasted energy, and by doing that, we’ll not only be better stewards of the environment, but we’re going to be more economically competitive as we’re moving into a future where we’re trying to reduce pollution,” he said. “And, you know, I want the United States to be a leader in developing that technology and that capability.”
Mitchell added that pending federal incentives will offer ways to act in a bipartisan fashion and employ common sense to combat methane pollution.
“So this is this really a golden opportunity for Utah if we can understand our leakage better, where the leaks are occurring, why they’re occurring, then we can better take advantage of the incentives.”